Commodities & Metals
What Gold's Best Quarter in 30 Years Really Looks Like for Key Stocks and ETFs

Published:
Last Updated:

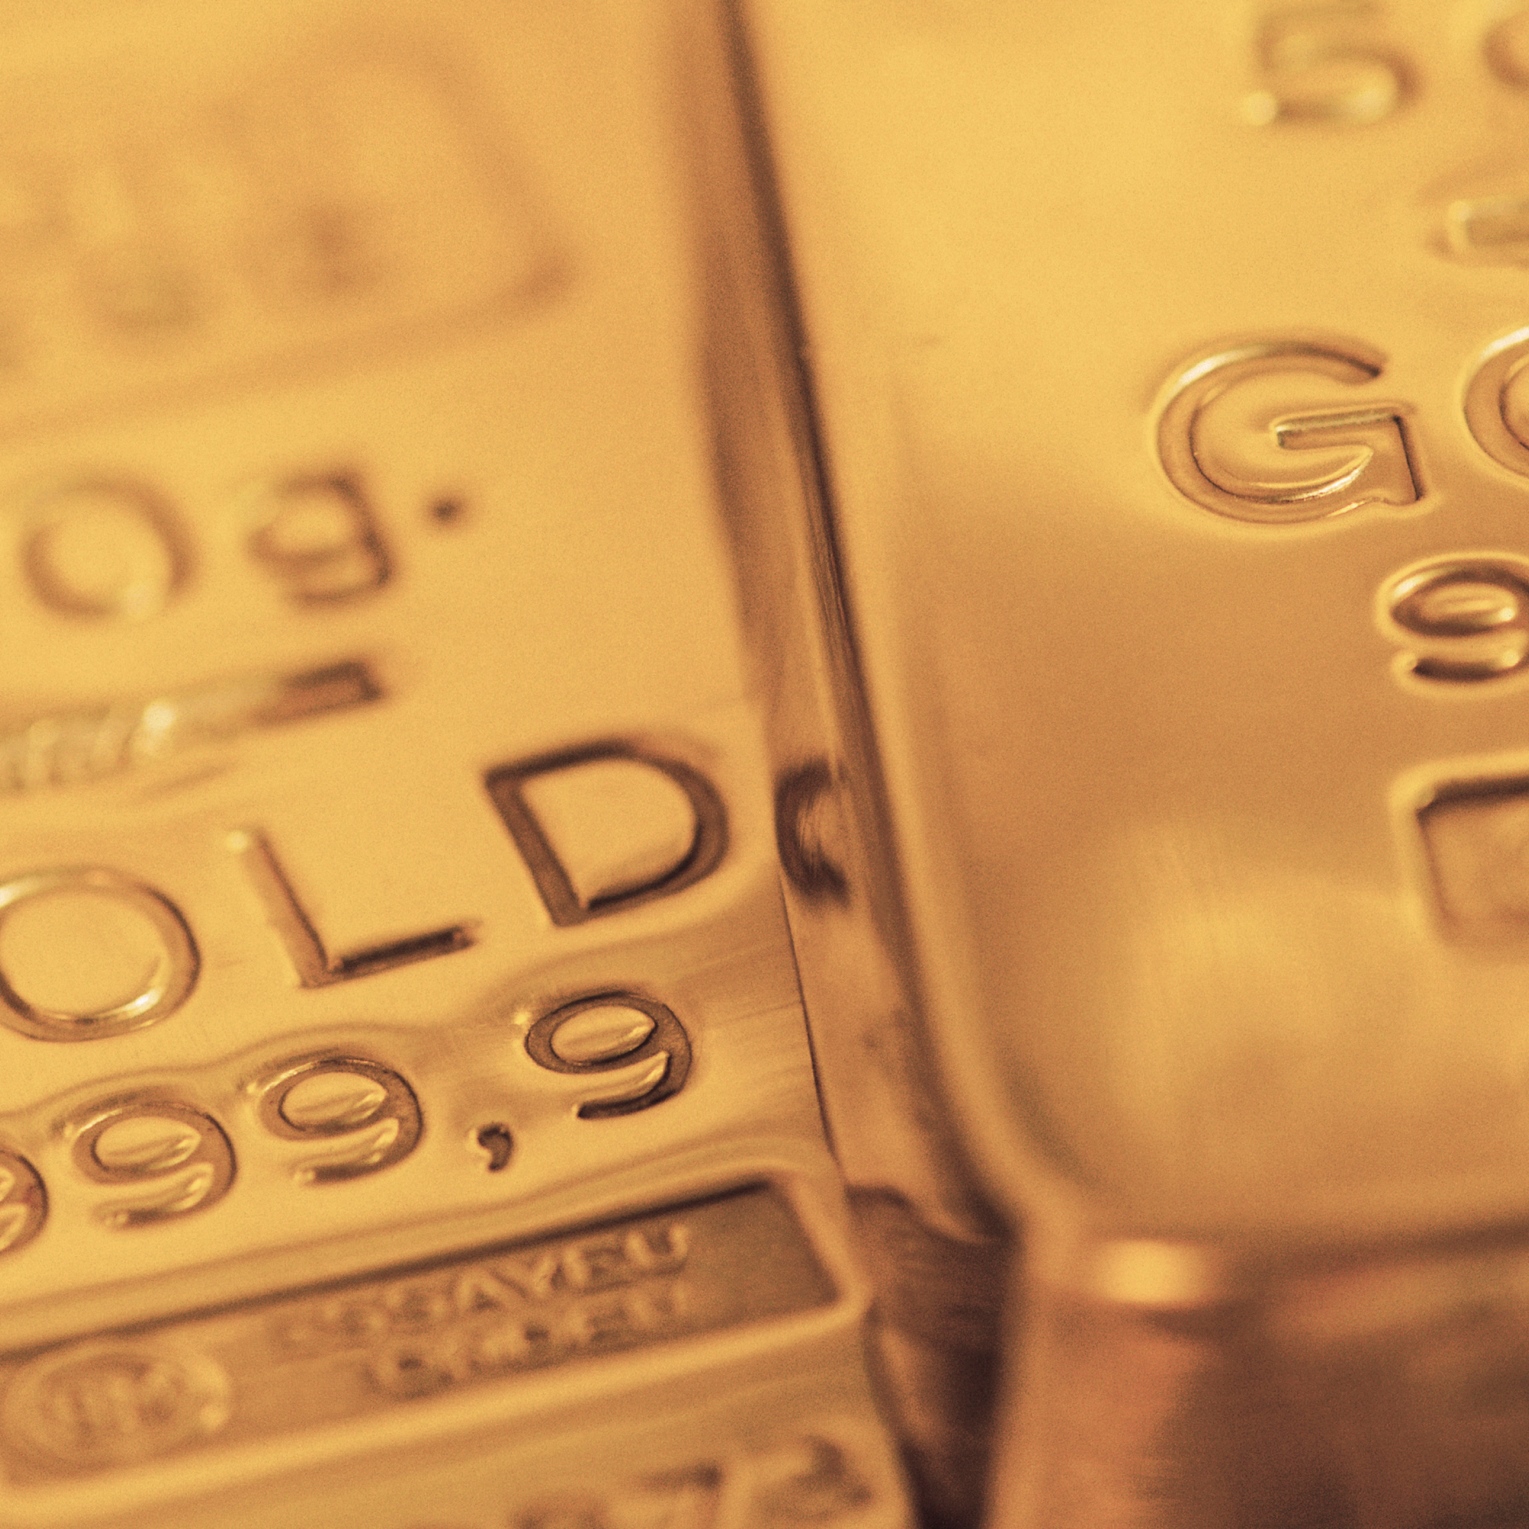
Coming into 2016, gold seem to be losing its luster, even further than in prior years. That was then, this is now. It turns out that the perfect storm leading into the end of the first quarter of 2016 will have created perhaps the single best quarter for gold going back to the mid-1980s. Gold mining and production stocks have seen their shares surge as well. On Thursday, March 31, gold futures were up roughly 17%, with spot gold trading around $1,235.00.
That perfect storm for gold includes quantitative easing to negative interest rates in Japan and Europe, an unexpectedly weak dollar, geopolitical concerns, a Fed shift from hawkish to dovish, a recovery in the stock market and an expected slower return to normalized interest rates. Then throw in a broad commodities rally as well.
Brokerage firms were not alone in their predictions for gold. Many major gold companies made their capital spending and base cost projections for their budgets in 2016 at closer to $1,000 per ounce — and some even worried about gold potentially going even lower.
24/7 Wall St. wanted to take a look at some key gold stocks. We looked at their performance in the first quarter of 2016, as well as a one-year look back. We also looked at their trading ranges and what analysts think these stocks are really worth. Then we looked at the key gold exchange traded funds (ETFs).
Barrick Gold Corp. (NYSE: ABX) was last seen trading at $13.74 on Thursday, with a $16 billion market cap. Its consensus analyst price target is $13.83 (up from last week), and it has a 52-week trading range of $5.91 to $15.52. The stock was up a whopping 86% since the end of 2015, as well as up 120% from six months ago and up almost 25% from a year ago.
Newmont Mining Corp. (NYSE: NEM) was last seen at $26.44, with a market cap of $14 billion. The consensus price target is $27.25 (up from last week), and the 52-week range is $15.39 to $28.39. Newmont Mining shares were last seen 48% higher since the end of 2015, and up 22% from a year ago.
Royal Gold Inc. (NASDAQ: RGLD) is a pure-play on the price of gold as it is an investor in gold royalties and interests from many different projects around the world. Trading at $51.63, its market cap is $3.37 billion, its consensus target price is $52.25 and its 52-week range is $24.68 to $67.99. The shares were last seen up 44% year to date, but this is still down 16% from a year ago.
Silver Wheaton Corp. (NYSE: SLW) has tried to get more into gold, as opposed to being perceived as a silver player. Its shares also have run higher in 2016 with the gold sector. It was last seen trading at $17.00, with a $6.9 billion market cap. The consensus price target is $20.62, and the 52-week range is $10.04 to $21.12. Silver Wheaton shares were last seen up 42% since the end of 2015, but this is down almost 7% from a year ago.
Coming into Thursday, March 31, the SPDR Gold Shares (NYSEMKT: GLD) was trading at $117.10 and was up 15.4% so far in 2016. Its 52-week range was $100.23 to $122.37, and the $117.95 price in late morning trading on Thursday was down from a recent peak over $120 but up from the 2015 closing price of $101.46.
As far as the ETFs tracking the gold miners, the Market Vectors Gold Miners ETF (NYSEMKT: GDX) was trading at $20.22. within a 52-week range of $12.40 to $21.42. This ETF was up 47% so far in 2016. Then there is the junior miners ETF, the Market Vectors Junior Gold Miners ETF (NYSEMKT: GDXJ) trading at $28.12, within a 52-week range of $16.87 to $29.50. The junior miners ETF was last seen up 46% from the close of 2015.
One word of caution is needed here, even if the look back might merit analysts revisiting gold miner and producer price targets. Many gold stocks are trading close to or above their consensus analyst targets. That is not above the most bullish targets of course, but it is above the mean price target.
On a closing note, let’s look back at what many gold forecasters called for at the end of 2015 and the start of 2016. At the start of 2016, Natixis called for gold to drop to $950 in 2016. BNP Paribas also predicted gold below $1,000 for 2016 earlier this year. In late 2015, Goldman Sachs predicted gold would be around $1,000 per ounce later in 2016. At the start of 2016, Citigroup forecast gold at an average of $960 by the end of 2016, and Bank of America Merrill Lynch saw it as low as $950.
HSBC and UBS were both standouts at the end of 2015, calling for a price closer to $1,200 in 2016.
Credit card companies are pulling out all the stops, with the issuers are offering insane travel rewards and perks.
We’re talking huge sign-up bonuses, points on every purchase, and benefits like lounge access, travel credits, and free hotel nights. For travelers, these rewards can add up to thousands of dollars in flights, upgrades, and luxury experiences every year.
It’s like getting paid to travel — and it’s available to qualified borrowers who know where to look.
We’ve rounded up some of the best travel credit cards on the market. Click here to see the list. Don’t miss these offers — they won’t be this good forever.
Thank you for reading! Have some feedback for us?
Contact the 24/7 Wall St. editorial team.