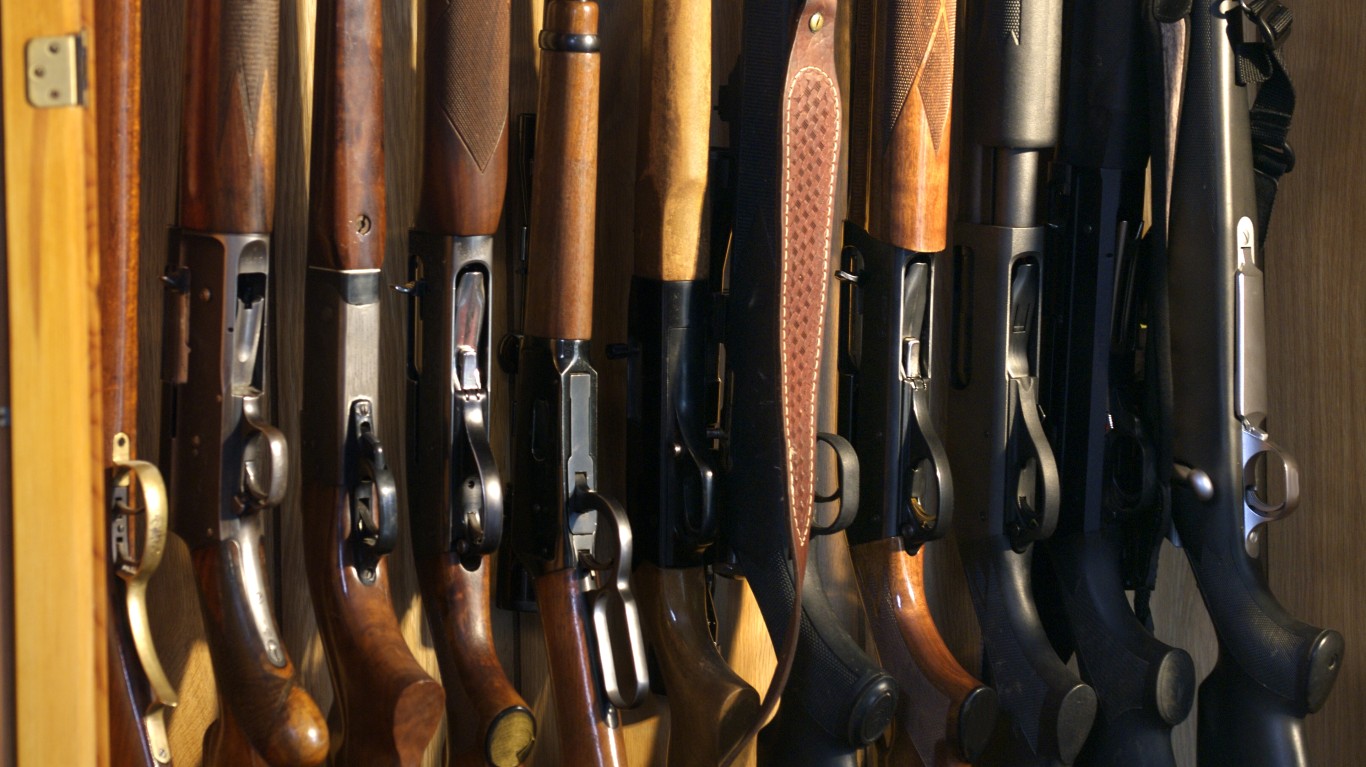
Using ATF firearm tracing data as a proxy for criminal offenses, 24/7 Wall St. identified the U.S. cities where gun crime is surging. We considered the 10 cities in each state with the most firearm tracings in 2022 — 500 U.S. cities in total — and ranked them on the one-year change in ATF gun tracings. Cities in which fewer than 20 firearms were traced in 2021 were excluded from analysis.
Each of the 35 cities on this list reported a more than 50% increase in federal firearm investigations between 2021 and 2022. In many of these cities, criminal firearm investigations more than doubled year over year.
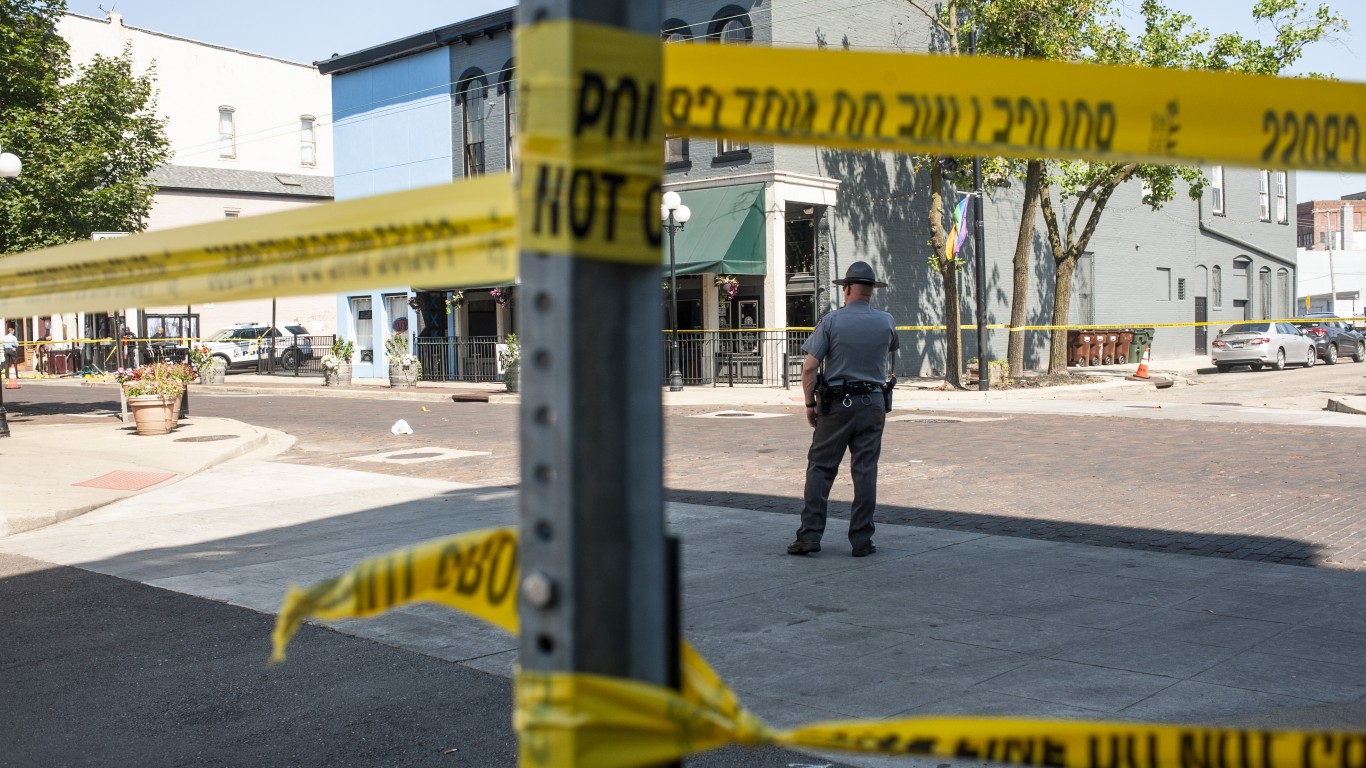
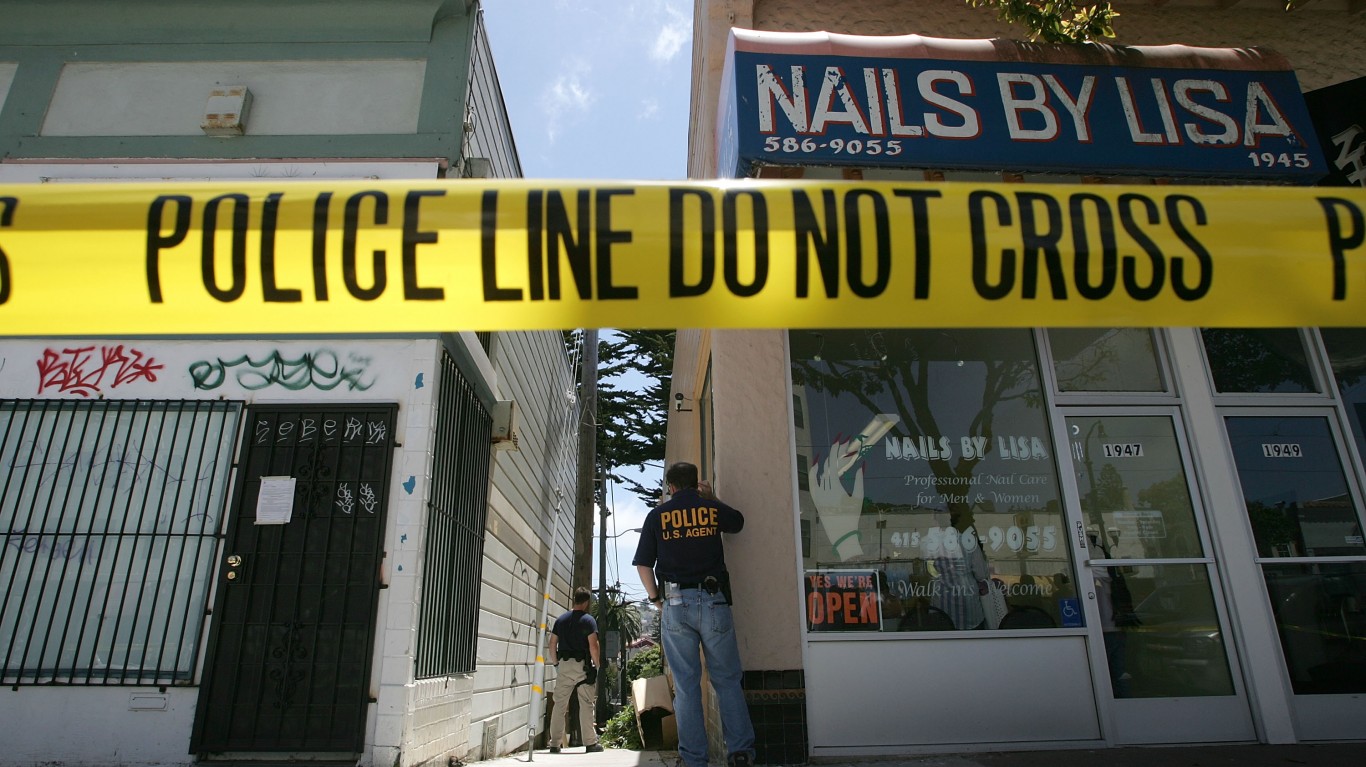
Gun-Related Crime — Why it Matters
Gun violence in America is a common-place occurrence, with eight in 10 murders involving a firearm (2021 statistics). Americans are also 26 times more likely to be shot than citizens of other high-income countries. The issue of gun control is, however, a very politicized one.
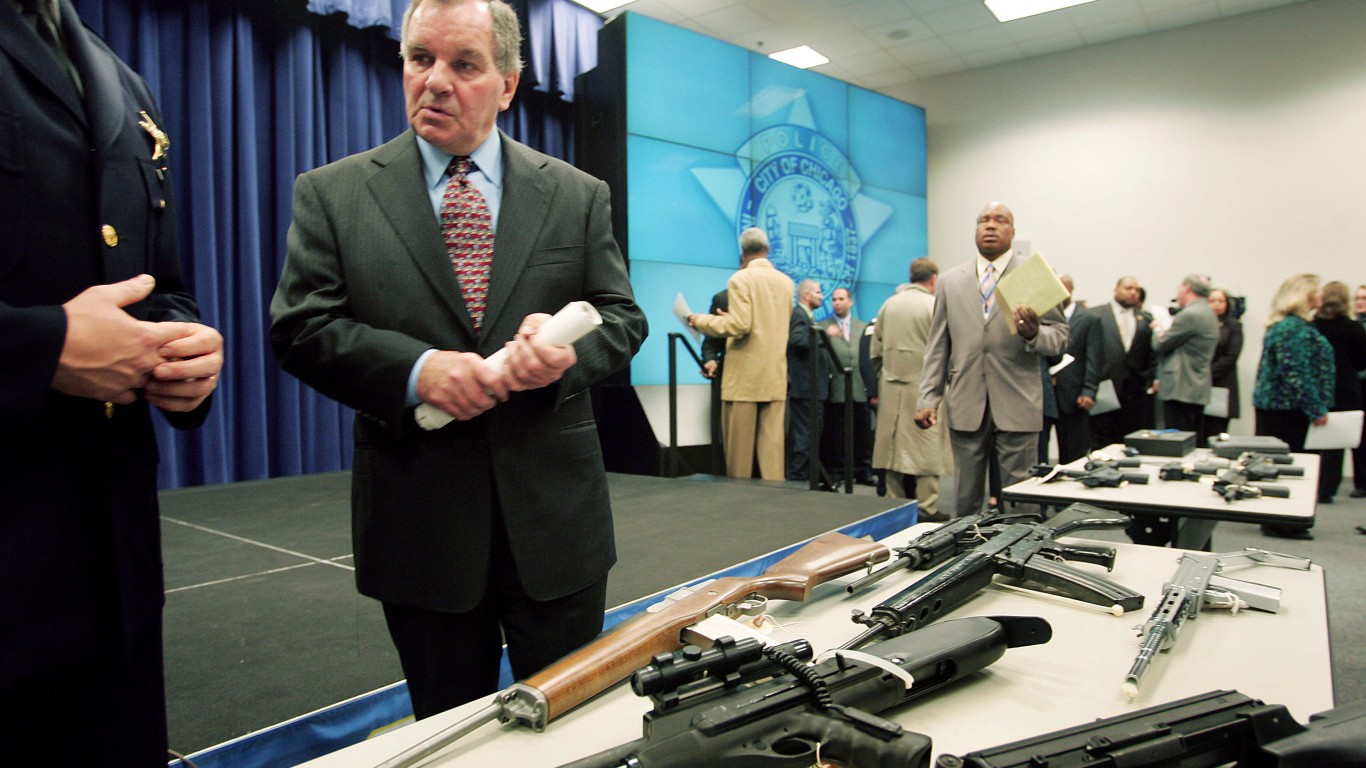
This article is intended to explain where potential problems with gun-related crime will arise and to address the general problem of gun violence. This problem costs the U.S. up to $557 billion (total cost) per year. This is five times the national budget for the Department of Education. The money lost to these incidents could be spent much better elsewhere.
Here are the cities where gun-related crime is surging:
35. Tacoma, WA
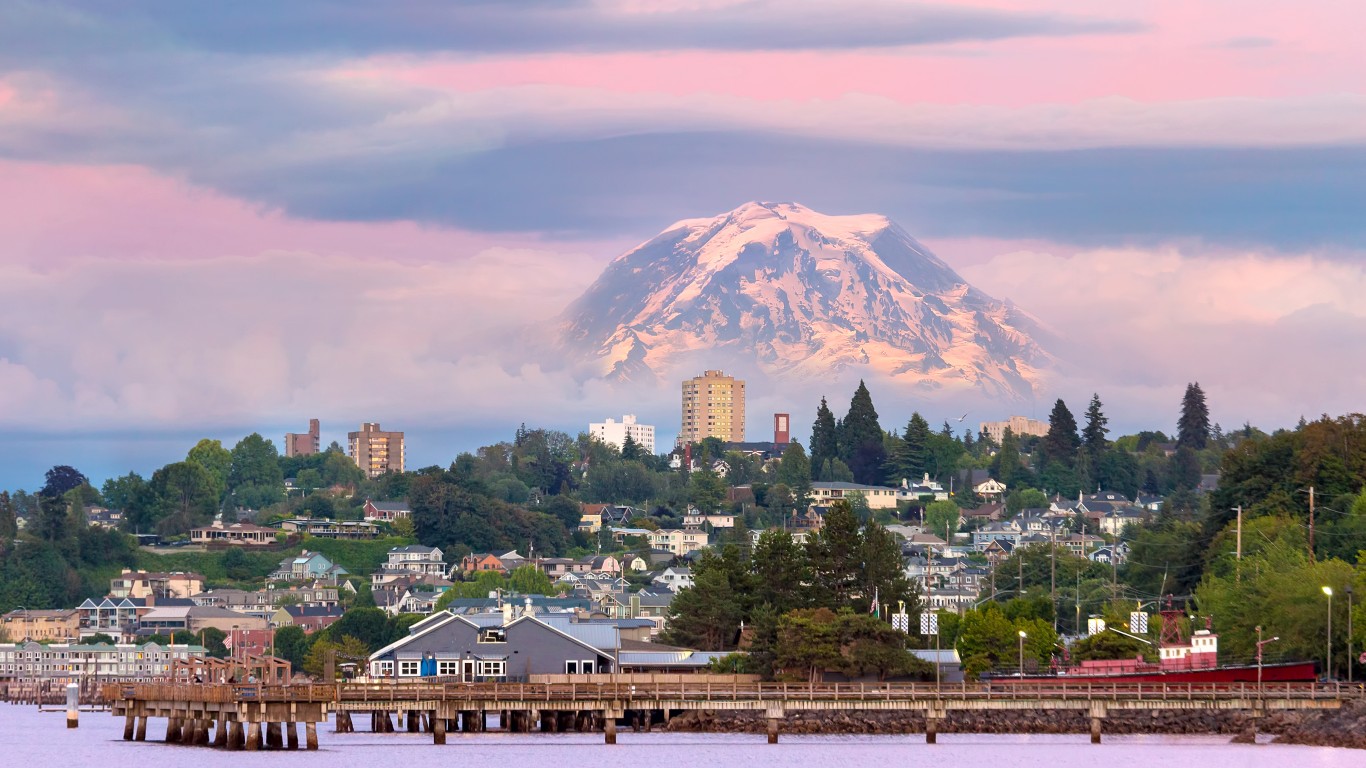
- 1-yr. change in ATF firearm tracings, 2021-2022: +51.8% (+207)
- ATF firearm tracings for each year: 607 in 2022; 400 in 2021
- Change in population, 2021-2022: +0.9% (+1,902)
- ATF firearm tracings in 2022 adjusted for population: 276.9 per 100,000 people
- ATF firearm tracings in 2021 adjusted for population: 184.1 per 100,000 people
34. North Platte, NE
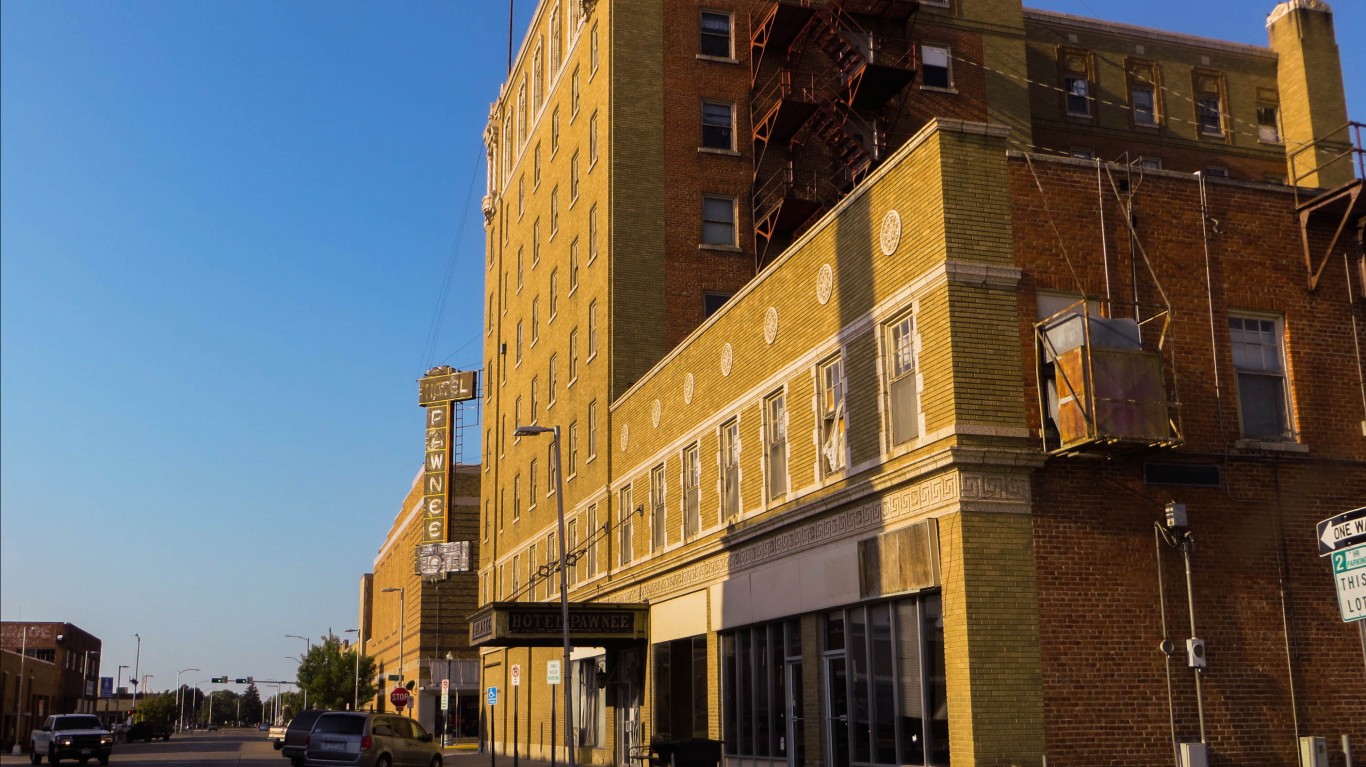
- 1-yr. change in ATF firearm tracings, 2021-2022: +52.3% (+23)
- ATF firearm tracings for each year: 67 in 2022; 44 in 2021
- Change in population, 2021-2022: -1.0% (-234)
- ATF firearm tracings in 2022 adjusted for population: 287.4 per 100,000 people
- PATF firearm tracings in 2021 adjusted for population: 186.9 per 100,000 people
33. Saint George, UT
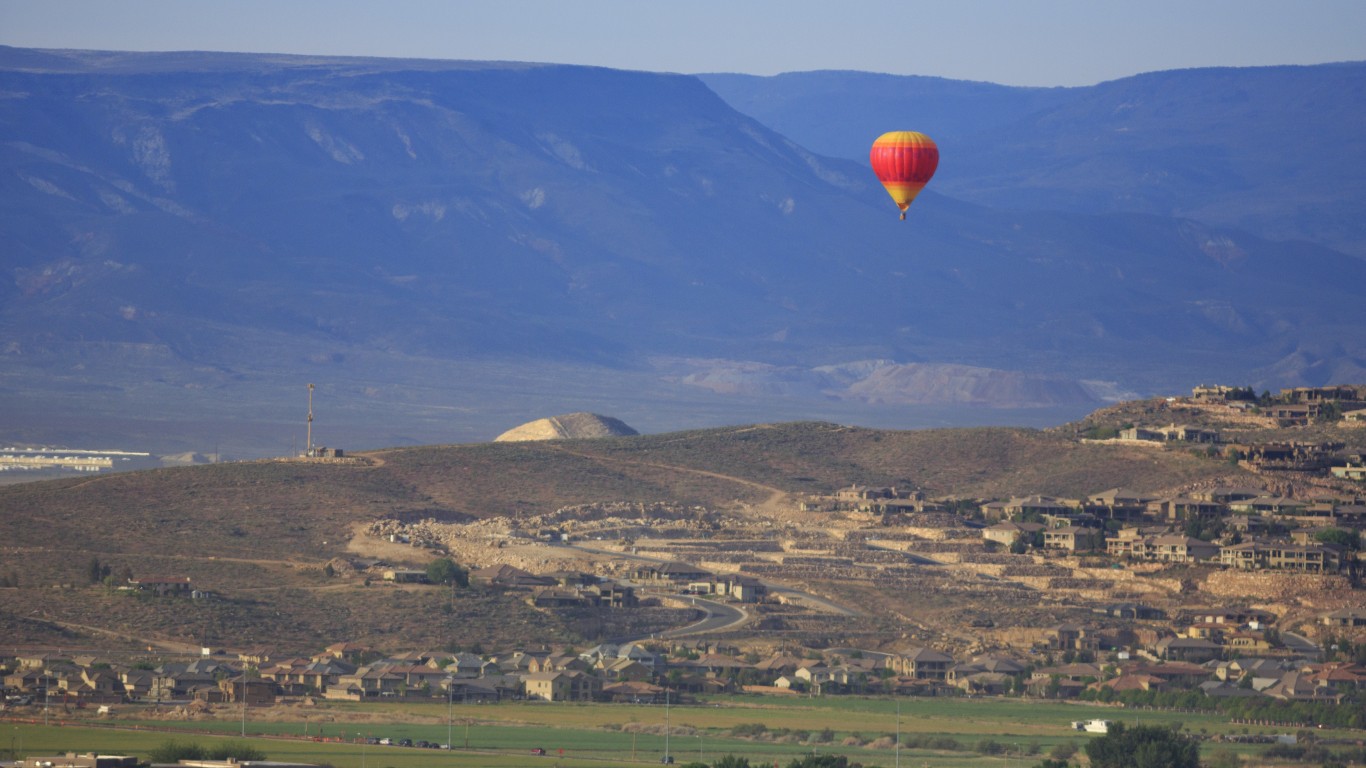
- 1-yr. change in ATF firearm tracings, 2021-2022: +52.9% (+63)
- ATF firearm tracings for each year: 182 in 2022; 119 in 2021
- Change in population, 2021-2022: +3.6% (+3,299)
- ATF firearm tracings in 2022 adjusted for population: 189.2 per 100,000 people
- ATF firearm tracings in 2021 adjusted for population: 128.1 per 100,000 people
32. Corpus Christi, TX
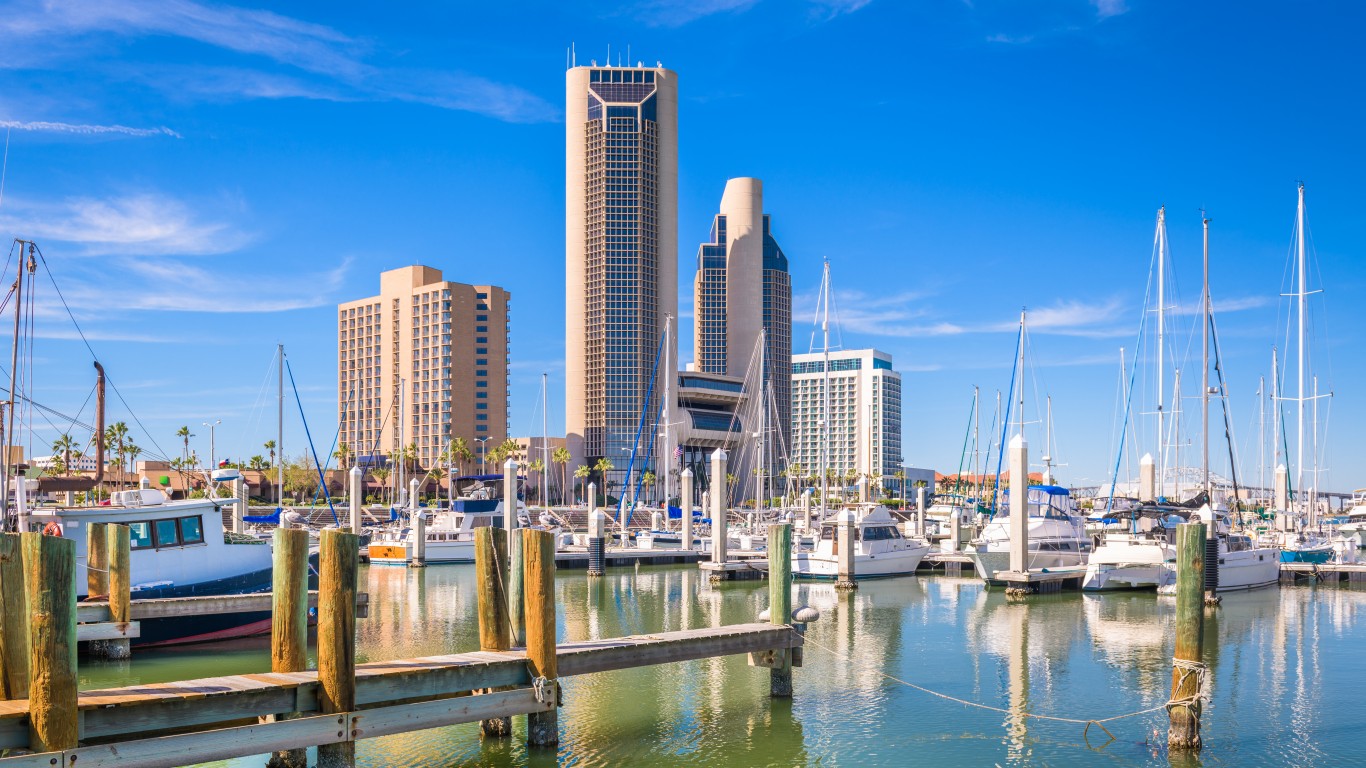
- 1-yr. change in ATF firearm tracings, 2021-2022: +54.2% (+416)
- ATF firearm tracings for each year: 1,184 in 2022; 768 in 2021
- Change in population, 2021-2022: -0.1% (-364)
- ATF firearm tracings in 2022 adjusted for population: 372.6 per 100,000 people
- ATF firearm tracings in 2021 adjusted for population: 241.4 per 100,000 people
31. Holyoke, MA
- 1-yr. change in ATF firearm tracings, 2021-2022: +54.4% (+37)
- ATF firearm tracings for each year: 105 in 2022; 68 in 2021
- Change in populationn, 2021-2022: -0.7% (-270)
- ATF firearm tracings in 2022 adjusted for population: 274.8 per 100,000 people
- ATF firearm tracings in 2021 adjusted for population: 176.7 per 100,000 people
30. Maple Grove, MN
- 1-yr. change in ATF firearm tracings, 2021-2022: +56.9% (+29)
- ATF firearm tracings for each year: 80 in 2022; 51 in 2021
- Change in population, 2021-2022: +0.3% (+210)
- PATF firearm tracings in 2022 adjusted for population: 114.1 per 100,000 people
- ATF firearm tracings in 2021 adjusted for population: 73.0 per 100,000 people
29. Peoria, AZ
- 1-yr. change in ATF firearm tracings, 2021-2022: +58.6% (+112)
- ATF firearm tracings for each year: 303 in 2022; 191 in 2021
- Change in population, 2021-2022: +1.9% (+3,559)
- ATF firearm tracings in 2022 adjusted for population: 158.4 per 100,000 people
- ATF firearm tracings in 2021 adjusted for population: 101.7 per 100,000 people
28. Racine, WI
- 1-yr. change in ATF firearm tracings, 2021-2022: +59.0% (+147)
- ATF firearm tracings for each year: 396 in 2022; 249 in 2021
- Change in population, 2021-2022: -0.3% (-252)
- ATF firearm tracings in 2022 adjusted for population: 511.3 per 100,000 people
- ATF firearm tracings in 2021 adjusted for population: 320.4 per 100,000 people
27. West Allis, WI

- 1-yr. change in ATF firearm tracings, 2021-2022: +61.7% (+116)
- ATF firearm tracings for each year: 304 in 2022; 188 in 2021
- Change in population, 2021-2022: -0.5% (-313)
- ATF firearm tracings in 2022 adjusted for population: 507.5 per 100,000 people
- ATF firearm tracings in 2021 adjusted for population: 312.2 per 100,000 people
26. Syracuse, NY

- 1-yr. change in ATF firearm tracings, 2021-2022: +65.9% (+135)
- ATF firearm tracings for each year: 340 in 2022; 205 in 2021
- Change in population, 2021-2022: -0.4% (-647)
- ATF firearm tracings in 2022 adjusted for population: 232.7 per 100,000 people
- ATF firearm tracings in 2021 adjusted for population: 139.7 per 100,000 people
25. 
- 1-yr. change in ATF firearm tracings, 2021-2022: +68.3% (+86)
- ATF firearm tracings for each year: 212 in 2022; 126 in 2021
- Change in population, 2021-2022: +0.2% (+90)
- ATF firearm tracings in 2022 adjusted for population: 473.4 per 100,000 people
- ATF firearm tracings in 2021 adjusted for population: 281.9 per 100,000 people
24. Newport News, VA

- 1-yr. change in ATF firearm tracings, 2021-2022: +69.3% (+537)
- ATF firearm tracings for each year: 1,312 in 2022; 775 in 2021
- Change in population, 2021-2022: +0.03% (+49)
- ATF firearm tracings in 2022 adjusted for population: 708.7 per 100,000 people
- ATF firearm tracings in 2021 adjusted for population: 418.8 per 100,000 people
23. East Saint Louis, IL

- 1-yr. change in ATF firearm tracings, 2021-2022: +70.2% (+134)
- ATF firearm tracings for each year: 325 in 2022; 191 in 2021
- Change in population, 2021-2022: -3.3% (-641)
- ATF firearm tracings in 2022 adjusted for population: 1729.1 per 100,000 people
- ATF firearm tracings in 2021 adjusted for population: 982.7 per 100,000 people
22. Clarksburg, WV
- 1-yr. change in ATF firearm tracings, 2021-2022: +73.7% (+42)
- ATF firearm tracings for each year: 99 in 2022; 57 in 2021
- Change in population, 2021-2022: -0.7% (-108)
- ATF firearm tracings in 2022 adjusted for population: 619.6 per 100,000 people
- ATF firearm tracings in 2021 adjusted for population: 354.4 per 100,000 people
21. Elizabethtown, KY
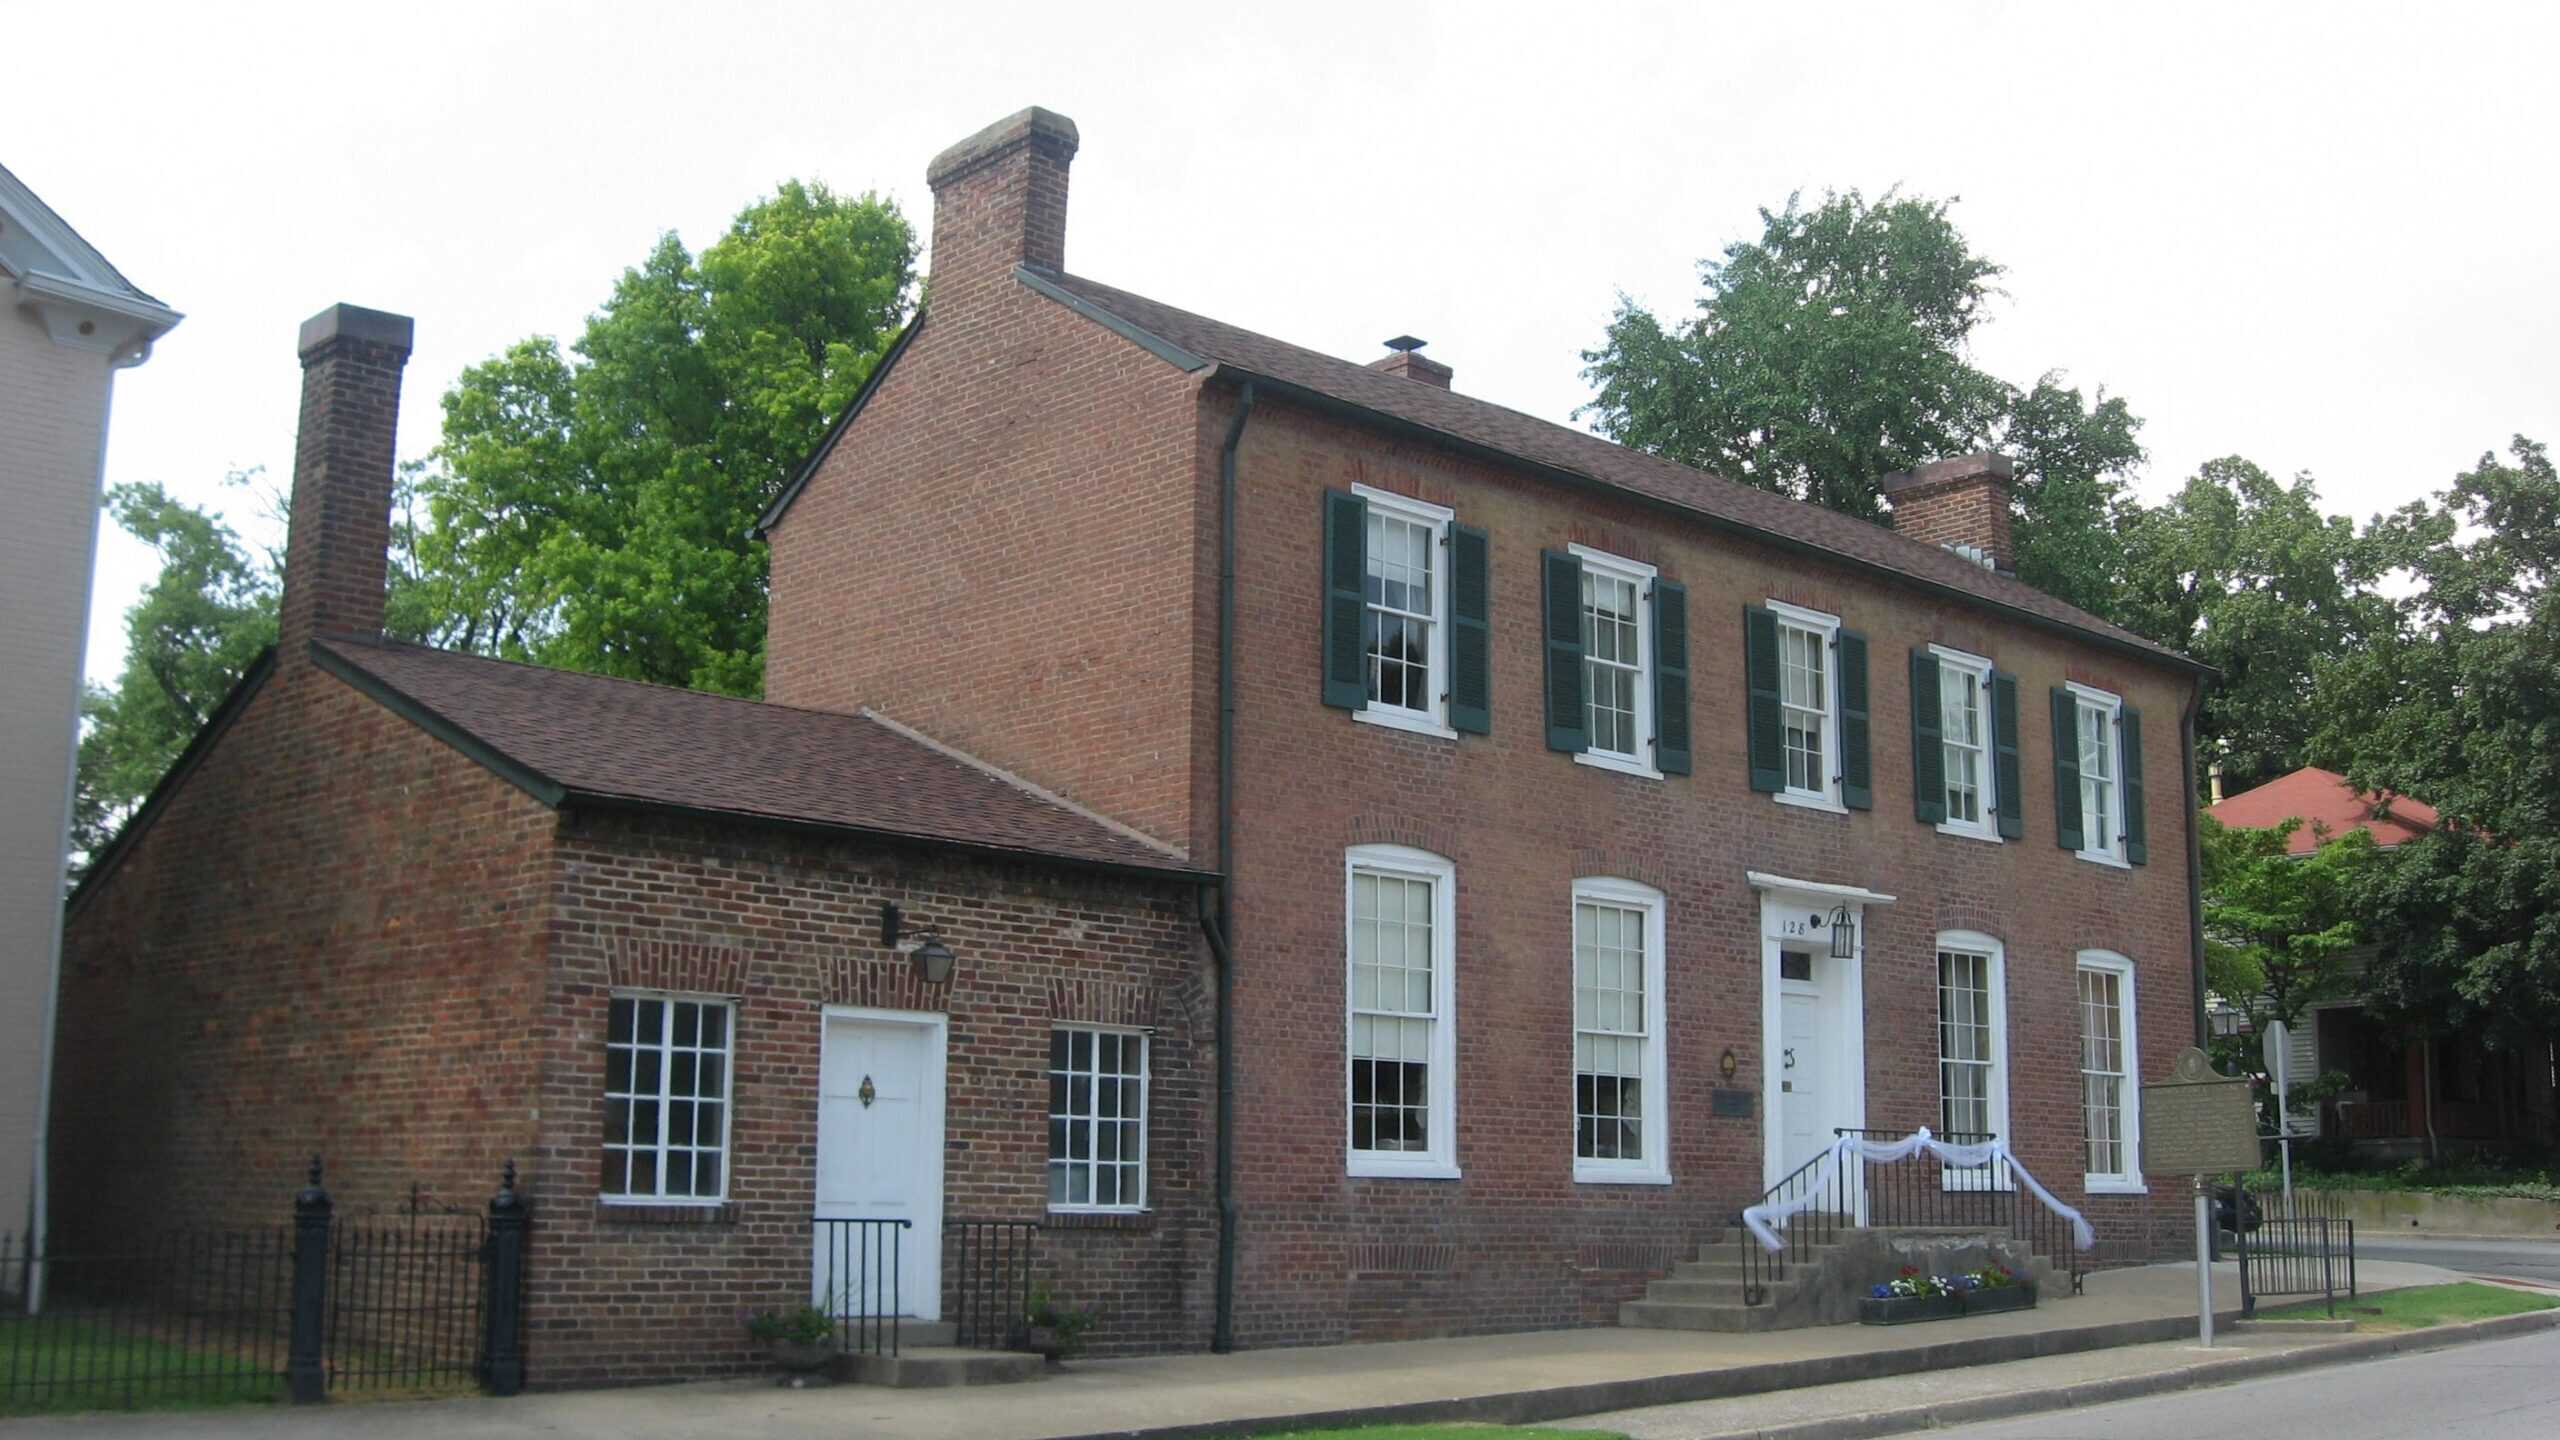
- 1-yr. change in ATF firearm tracings, 2021-2022: +74.7% (+62)
- ATF firearm tracings for each year: 145 in 2022; 83 in 2021
- Change in population, 2021-2022: +1.2% (+359)
- ATF firearm tracings in 2022 adjusted for population: 461.4 per 100,000 people
- ATF firearm tracings in 2021 adjusted for population: 267.2 per 100,000 people
20. Myrtle Beach, SC
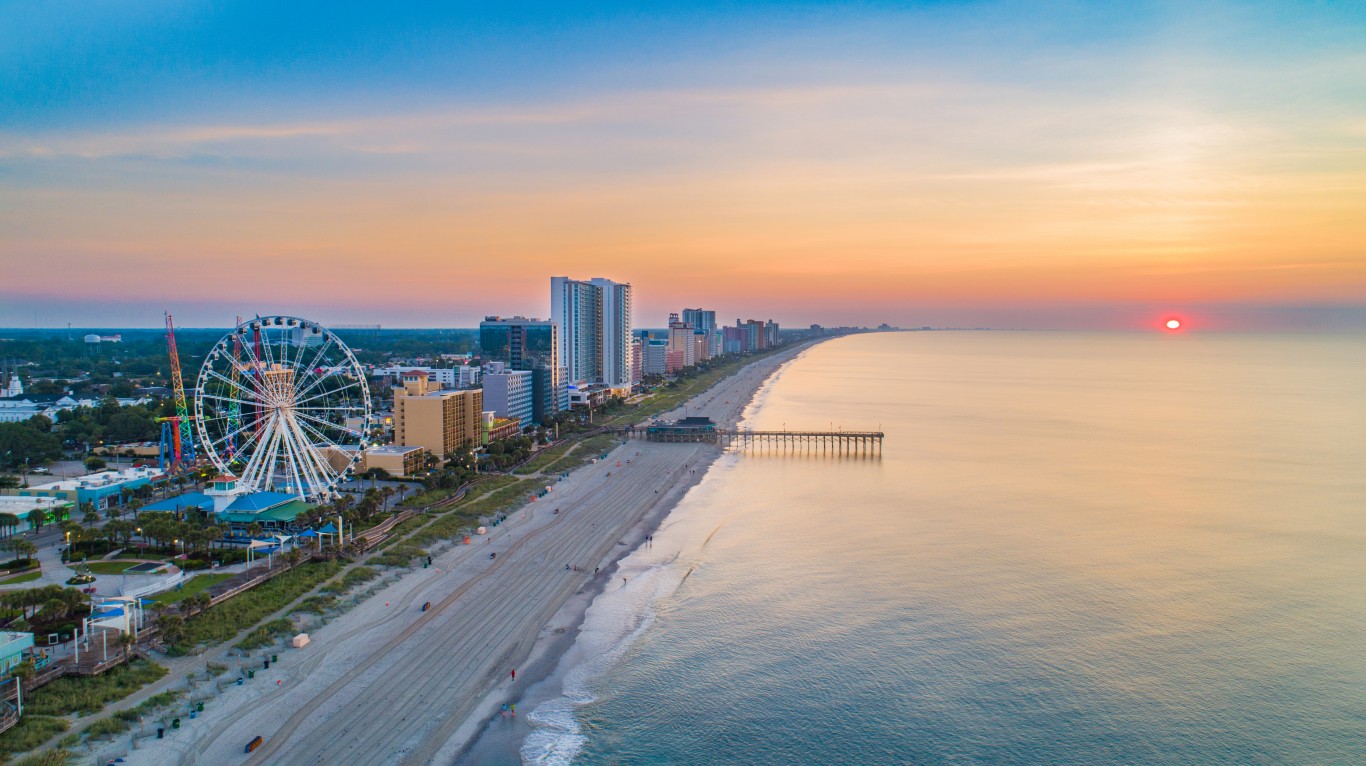
- 1-yr. change in ATF firearm tracings, 2021-2022: +76.9% (+247)
- ATF firearm tracings for each year: 568 in 2022; 321 in 2021
- Change in population, 2021-2022: +2.7% (+948)
- ATF firearm tracings in 2022 adjusted for population: 1575.0 per 100,000 people
- ATF firearm tracings in 2021 adjusted for population: 914.1 per 100,000 people
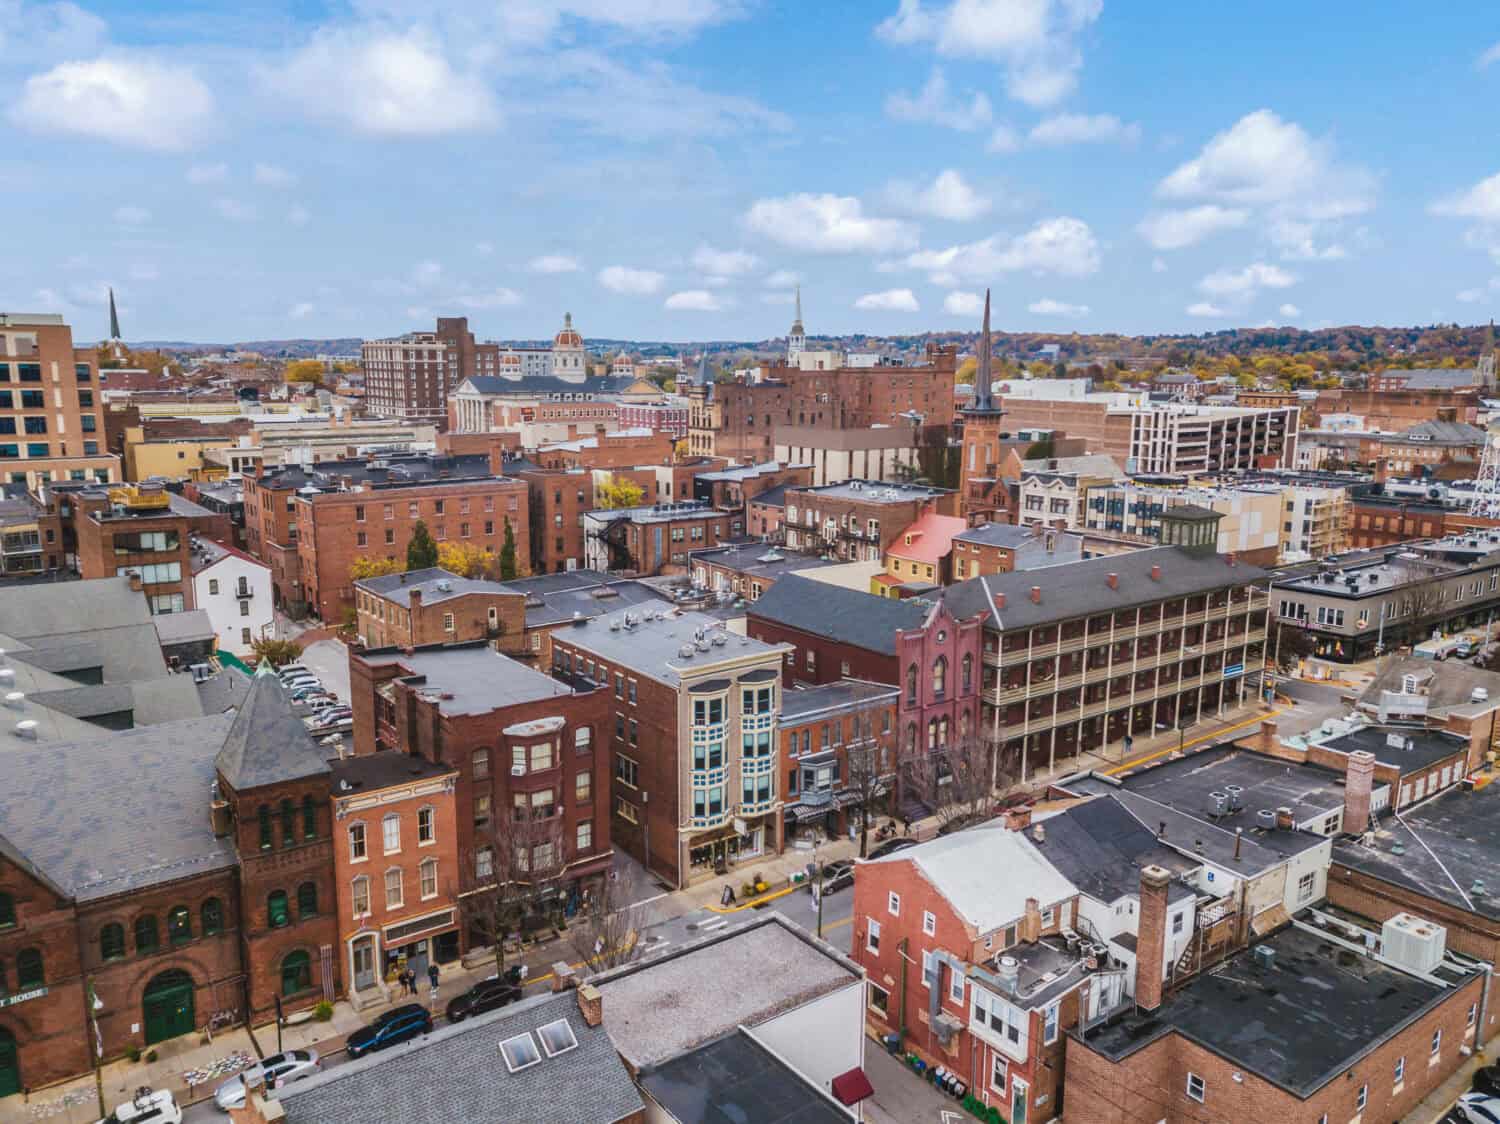
19. Chester, PA
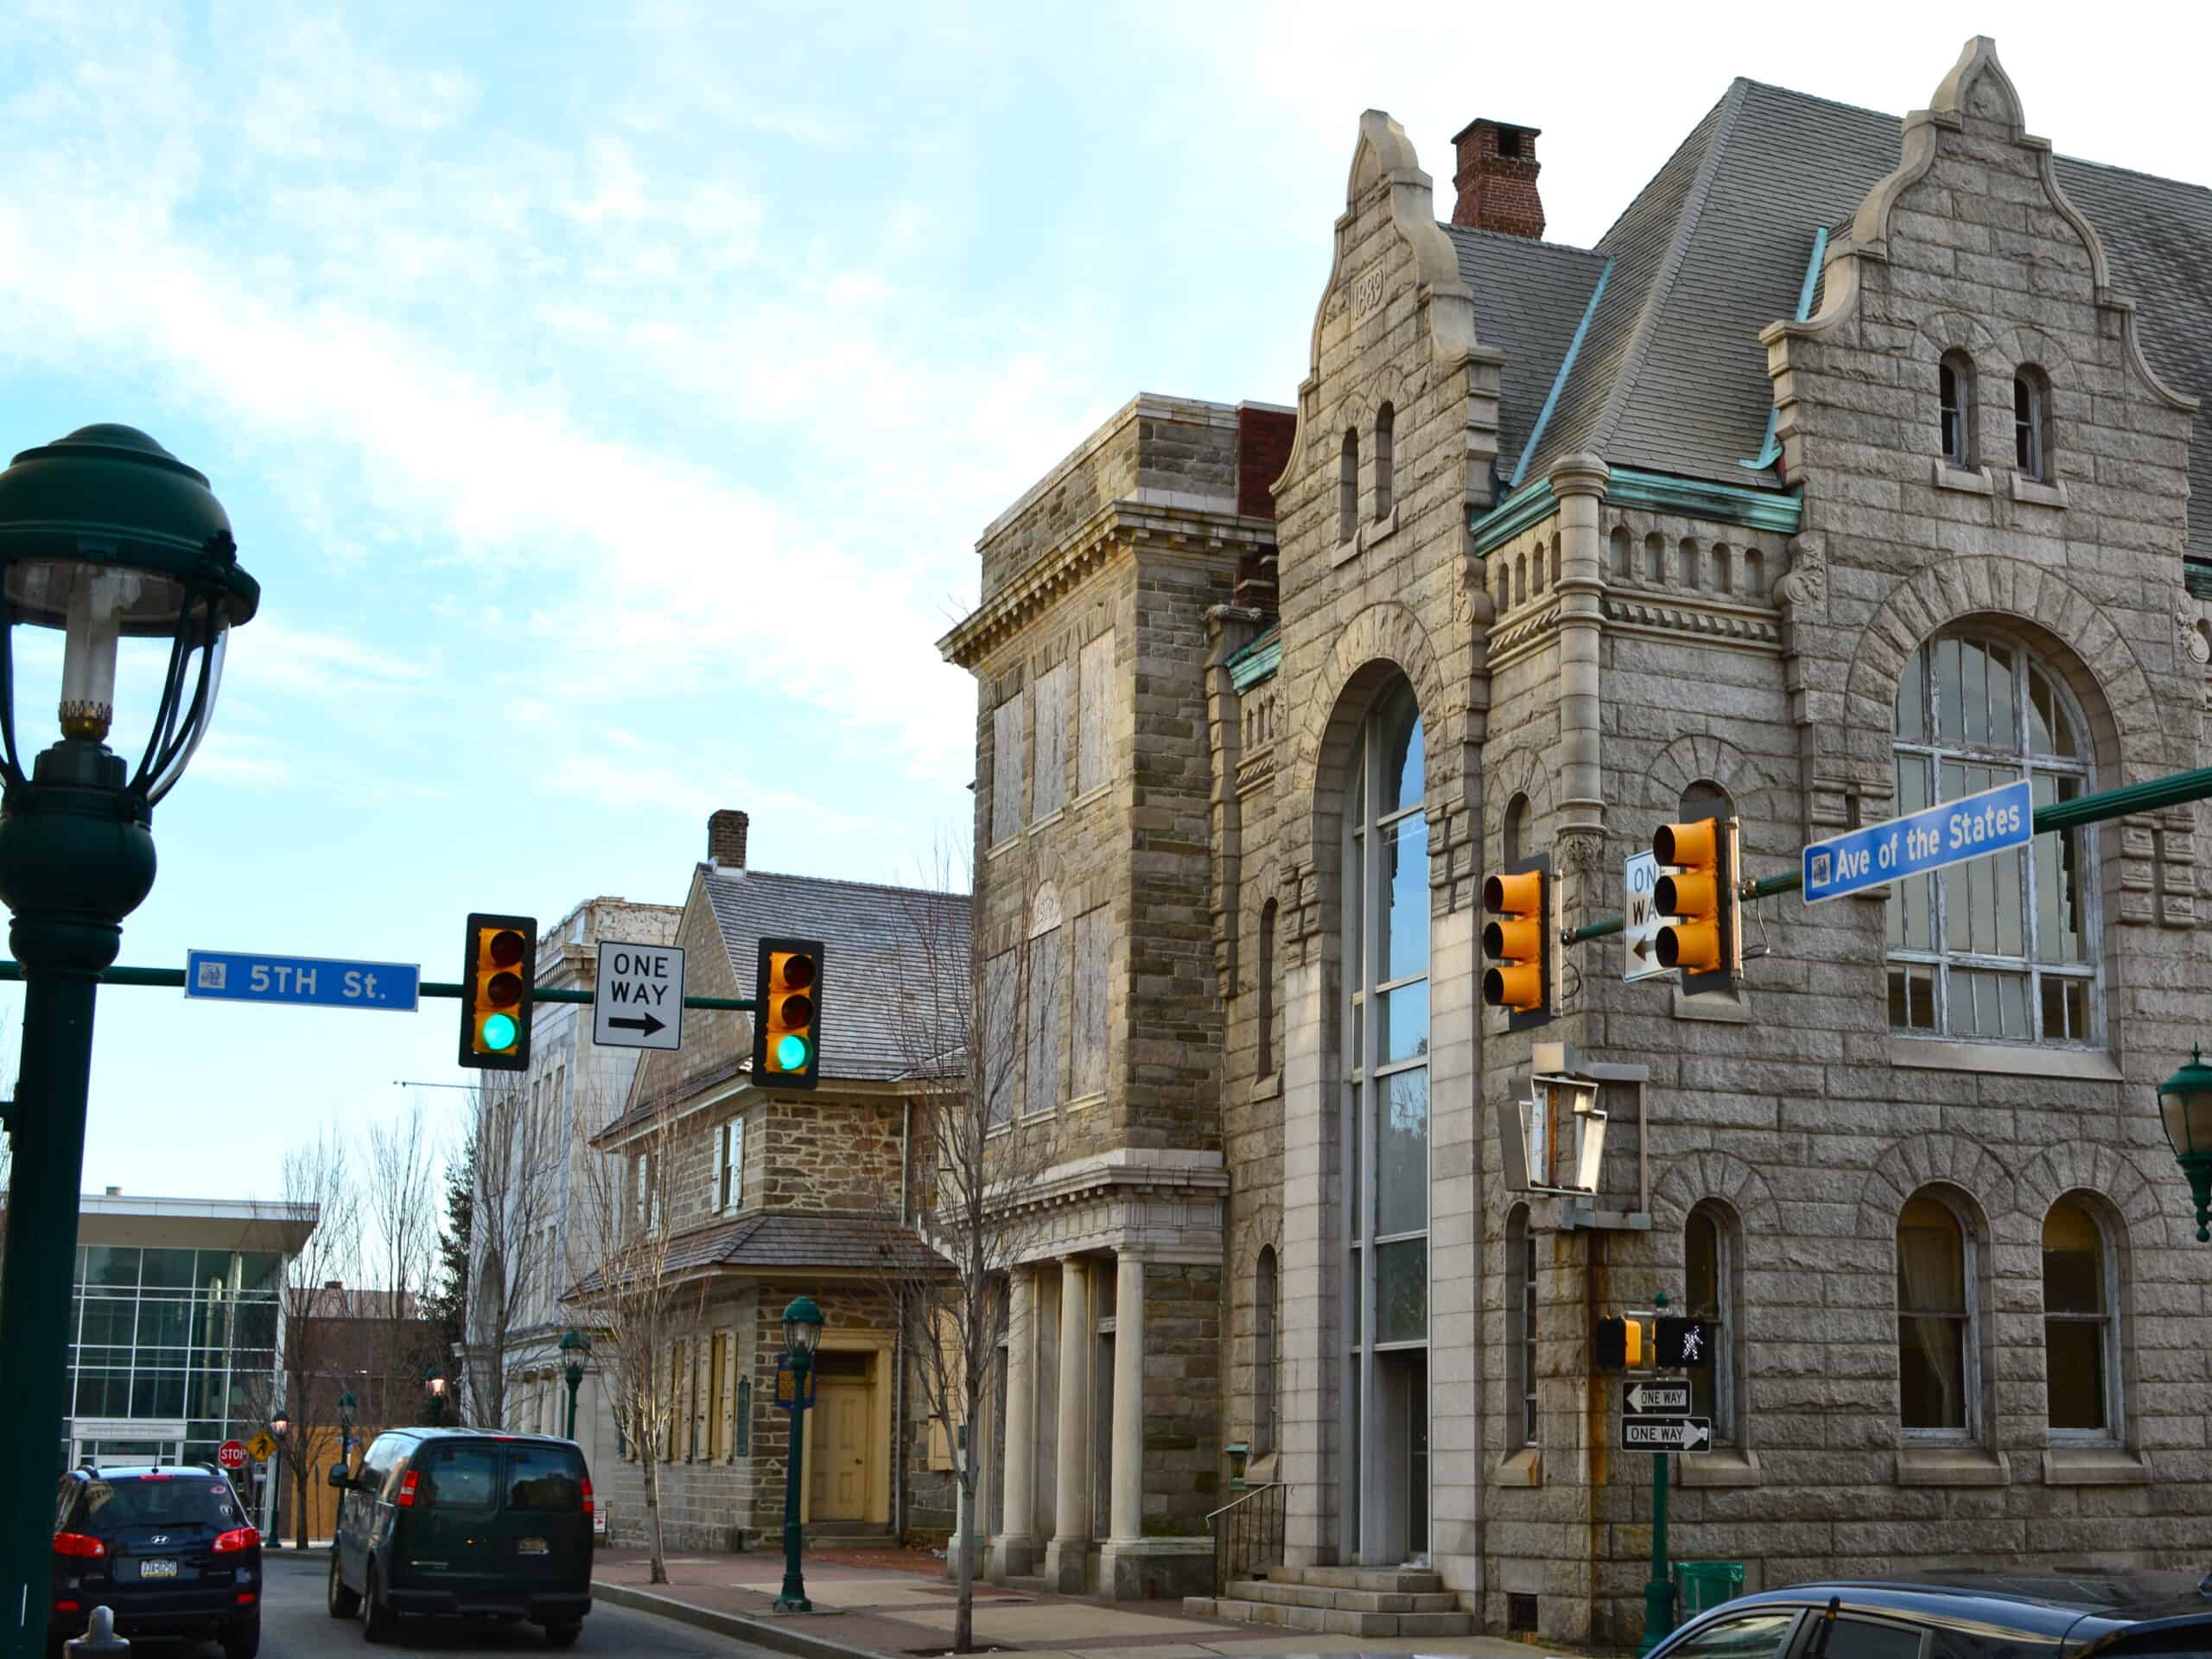
- 1-yr. change in ATF firearm tracings, 2021-2022: +87.7% (+100)
- ATF firearm tracings for each year: 214 in 2022; 114 in 2021
- Change in population, 2021-2022: +0.7% (+229)
- ATF firearm tracings in 2022 adjusted for population: 647.5 per 100,000 people
- ATF firearm tracings in 2021 adjusted for population: 347.4 per 100,000 people
18. Murfreesboro, TN
- 1-yr. change in ATF firearm tracings, 2021-2022: +95.9% (+162)
- ATF firearm tracings for each year: 331 in 2022; 169 in 2021
- Change in population, 2021-2022: +3.0% (+4,517)
- ATF firearm tracings in 2022 adjusted for population: 215.7 per 100,000 people
- ATF firearm tracings in 2021 adjusted for population: 113.4 per 100,000 people
17. Fresno, CA

- 1-yr. change in ATF firearm tracings, 2021-2022: +98.0% (+944)
- ATF firearm tracings for each year: 1,907 in 2022; 963 in 2021
- Change in population, 2021-2022: +0.5% (+2,850)
- ATF firearm tracings in 2022 adjusted for population: 352.2 per 100,000 people
- ATF firearm tracings in 2021 adjusted for population: 178.8 per 100,000 people
16. Norman, OK
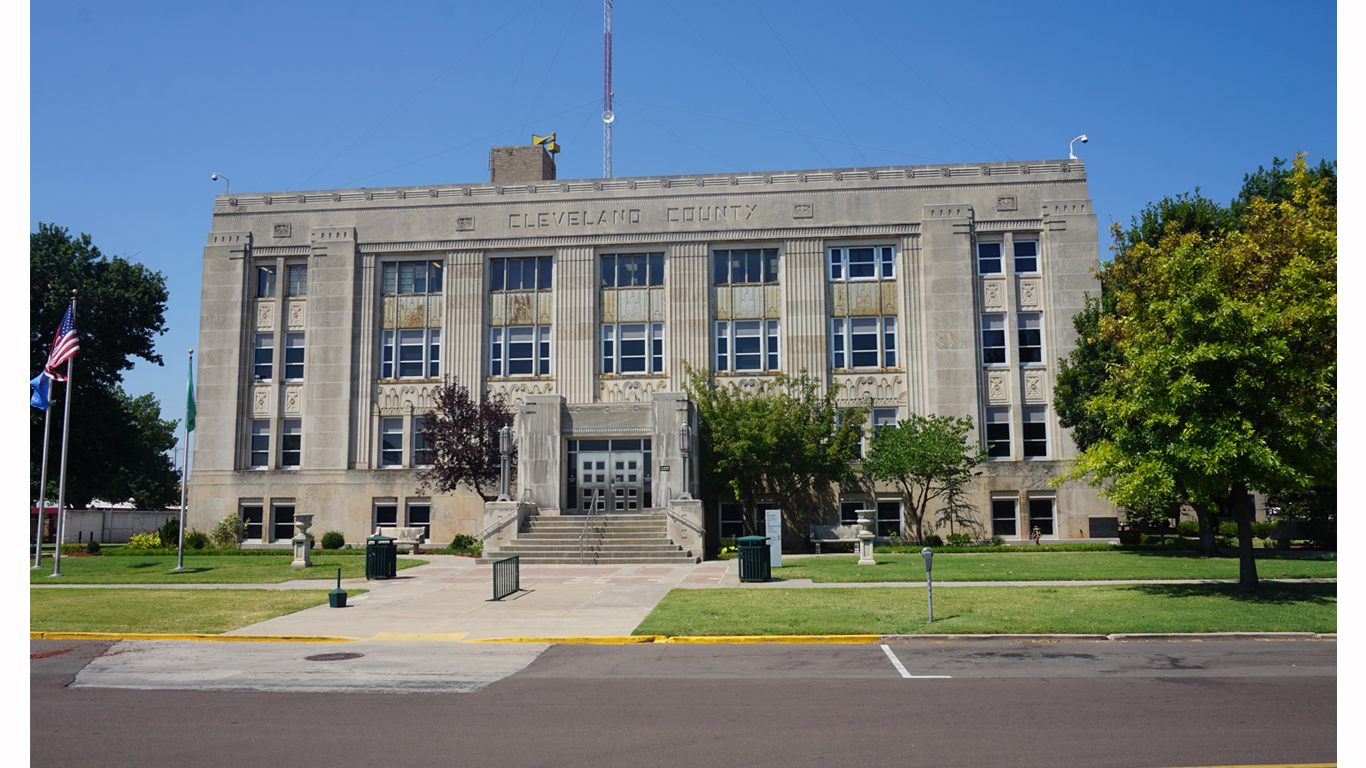
- 1-yr. change in ATF firearm tracings, 2021-2022: +100.0% (+28)
- ATF firearm tracings for each year: 56 in 2022; 28 in 2021
- Change in population, 2021-2022: +1.6% (+1,956)
- ATF firearm tracings in 2022 adjusted for population: 43.9 per 100,000 people
- ATF firearm tracings in 2021 adjusted for population: 22.3 per 100,000 people
15. Las Cruces, NM
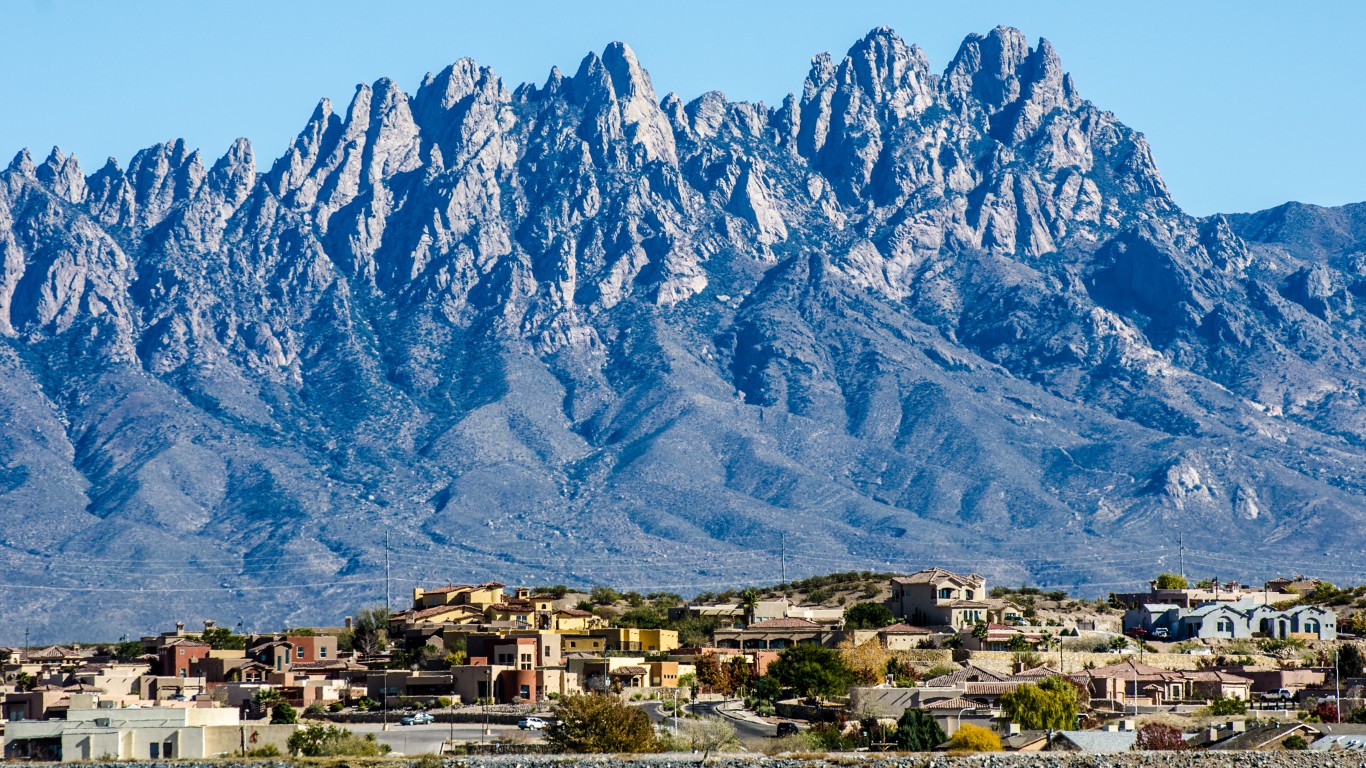
- 1-yr. change in ATF firearm tracings, 2021-2022: +104.5% (+139)
- ATF firearm tracings for each year: 272 in 2022; 133 in 2021
- Change in population, 2021-2022: +1.2% (+1,339)
- ATF firearm tracings in 2022 adjusted for population: 244.4 per 100,000 people
- ATF firearm tracings in 2021 adjusted for population: 121.0 per 100,000 people
14. Ogden, UT

- 1-yr. change in ATF firearm tracings, 2021-2022: +107.8% (+110)
- ATF firearm tracings by year: 212 in 2022; 102 in 2021
- Change in population, 2021-2022: +0.7% (+644)
- ATF firearm tracings in 2022 adjusted for population: 244.4 per 100,000 people
- ATF firearm tracings in 2021 adjusted for population: 118.5 per 100,000 people
13. Aurora, CO
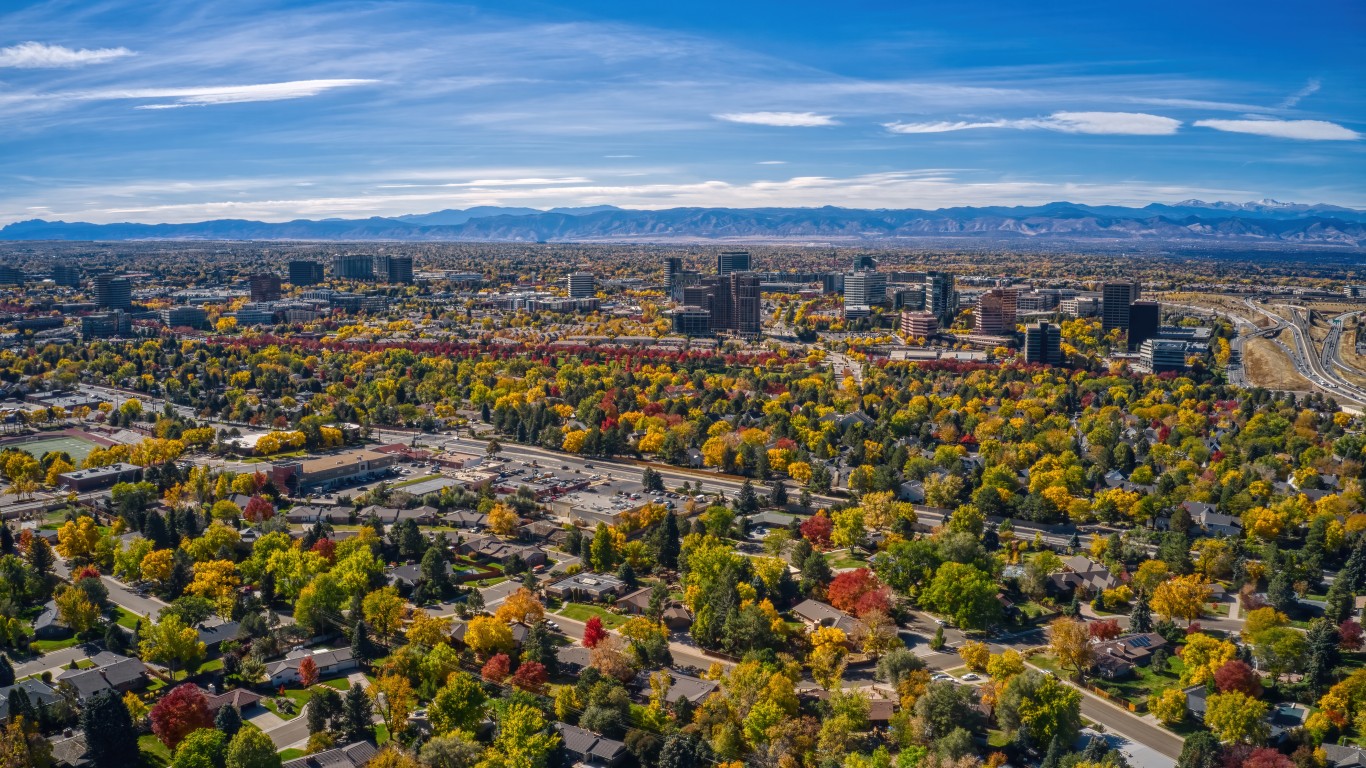
- 1-yr. change in ATF firearm tracings, 2021-2022: +113.8% (+272)
- ATF firearm tracings by year: 511 in 2022; 239 in 2021
- Change in population, 2021-2022: +1.0% (+3,853)
- ATF firearm tracings in 2022 adjusted for population: 131.9 per 100,000 people
- ATF firearm tracings in 2021 adjusted for population: 62.3 per 100,000 people
12. Duluth, MN
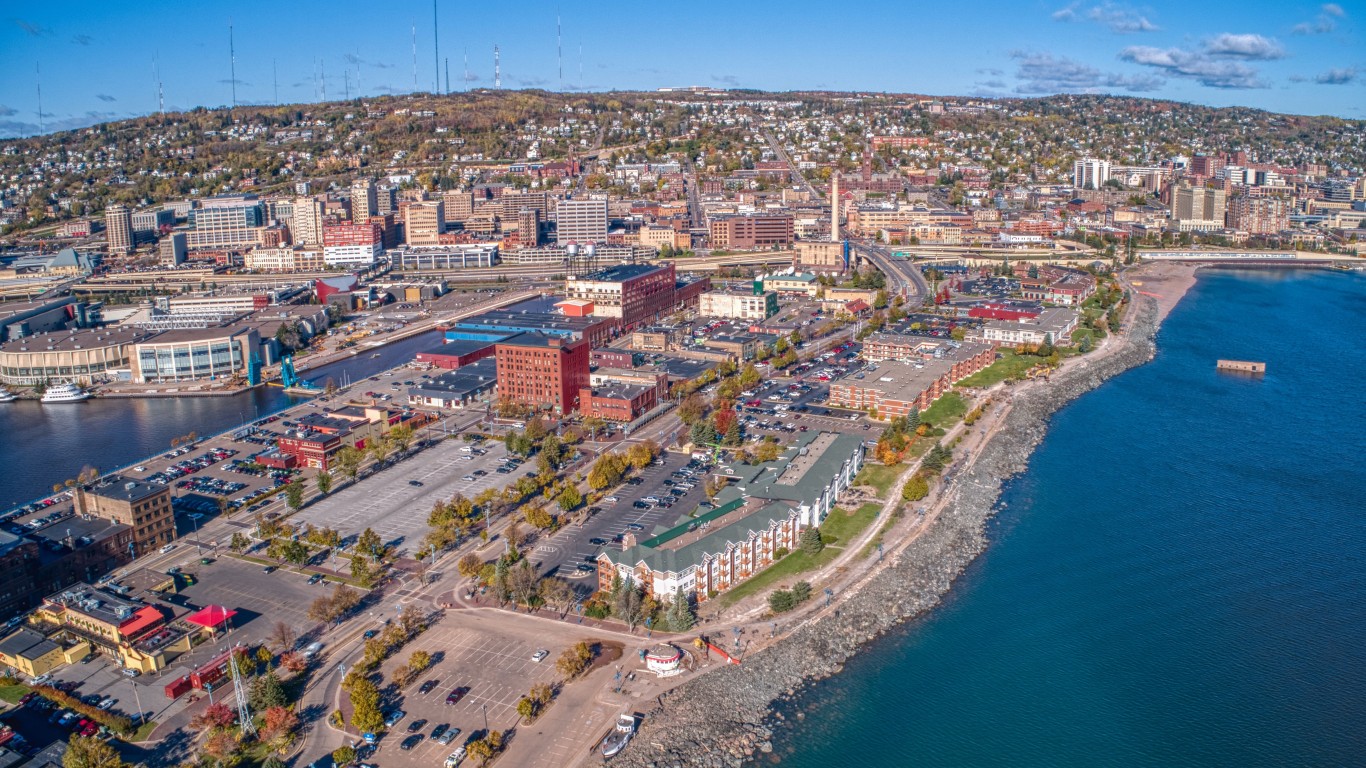
- 1-yr. change in ATF firearm tracings, 2021-2022: +114.3% (+80)
- ATF firearm tracings for each year: 150 in 2022; 70 in 2021
- Change in population, 2021-2022: +0.1% (+61)
- ATF firearm tracings in 2022 adjusted for population: 172.9 per 100,000 people
- ATF firearm tracings in 2021 adjusted for population: 80.7 per 100,000 people
11. Wasilla, AK

- 1-yr. change in ATF firearm tracings, 2021-2022: +129.4% (+44)
- ATF firearm tracings for each year: 78 in 2022; 34 in 2021
- Change in population, 2021-2022: +1.9% (+169)
- ATF firearm tracings in 2022 adjusted for population: 841.7 per 100,000 people
- ATF firearm tracings in 2021 adjusted for population: 373.7 per 100,000 people
10. Anchorage, AK

- 1-yr. change in ATF firearm tracings, 2021-2022: +129.5% (+500)
- ATF firearm tracings for each year: 886 in 2022; 386 in 2021
- Change in population, 2021-2022: -0.6% (-1,871)
- ATF firearm tracings in 2022 adjusted for population: 304.8 per 100,000 people
- ATF firearm tracings in 2021 adjusted for population: 131.9 per 100,000 people
9. Honolulu, HI
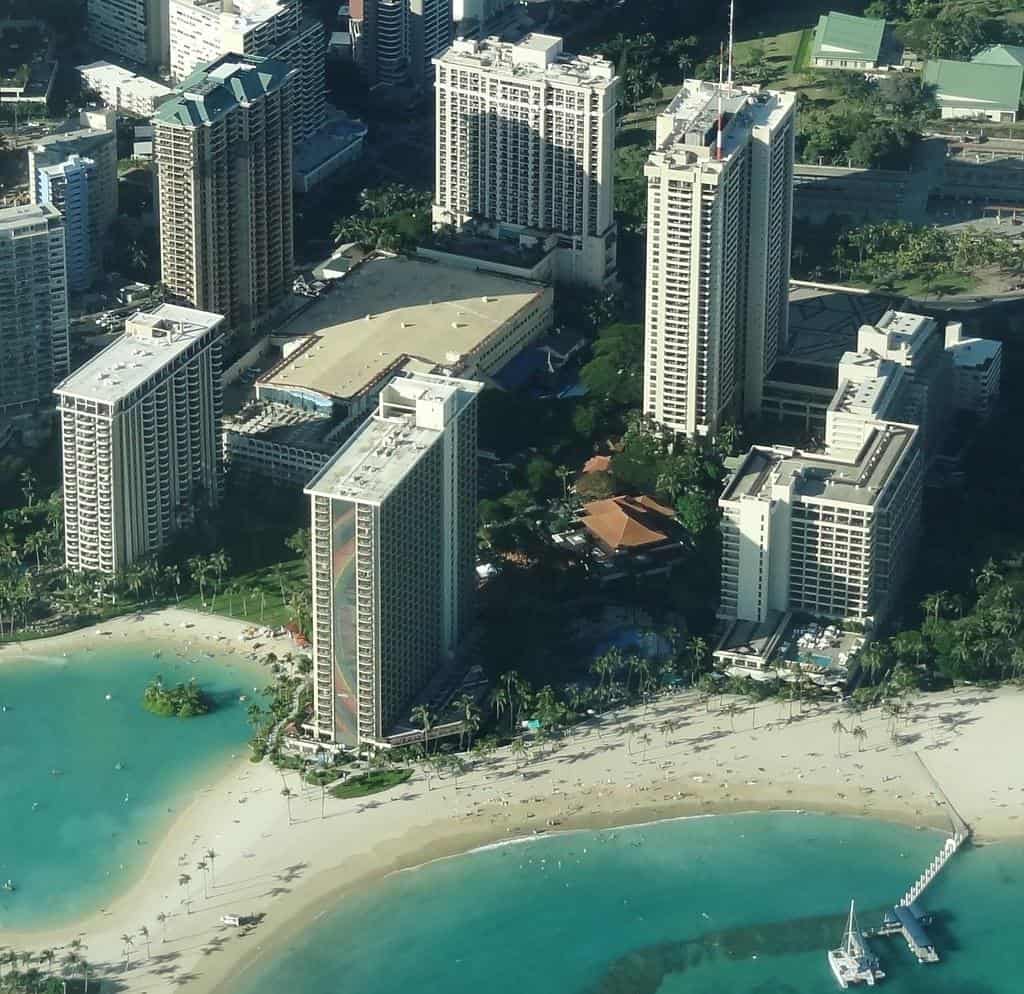
- 1-yr. change in ATF firearm tracings, 2021-2022: +136.7% (+41)
- ATF firearm tracings for each year: 71 in 2022; 30 in 2021
- Change in population, 2021-2022: -0.9% (-3,007)
- ATF firearm tracings in 2022 adjusted for population: 20.4 per 100,000 people
- ATF firearm tracings in 2021 adjusted for population: 8.5 per 100,000 people
8. Lihue, HI

- 1-yr. change in ATF firearm tracings, 2021-2022: +150.0% (+33)
- ATF firearm tracings for each year: 55 in 2022; 22 in 2021
- Change in population, 2021-2022: +3.3% (+278)
- ATF firearm tracings in 2022 adjusted for population: 635.9 per 100,000 people
- ATF firearm tracings in 2021 adjusted for population: 262.8 per 100,000 people
7. Austin, TX

- 1-yr. change in ATF firearm tracings, 2021-2022: +156.7% (+1,042)
- ATF firearm tracings for each year: 1,707 in 2022; 665 in 2021
- Change in population, 2021-2022: +1.4% (+13,544)
- ATF firearm tracings in 2022 adjusted for population: 178.1 per 100,000 people
- ATF firearm tracings in 2021 adjusted for population: 70.4 per 100,000 people
6. Sioux City, IA
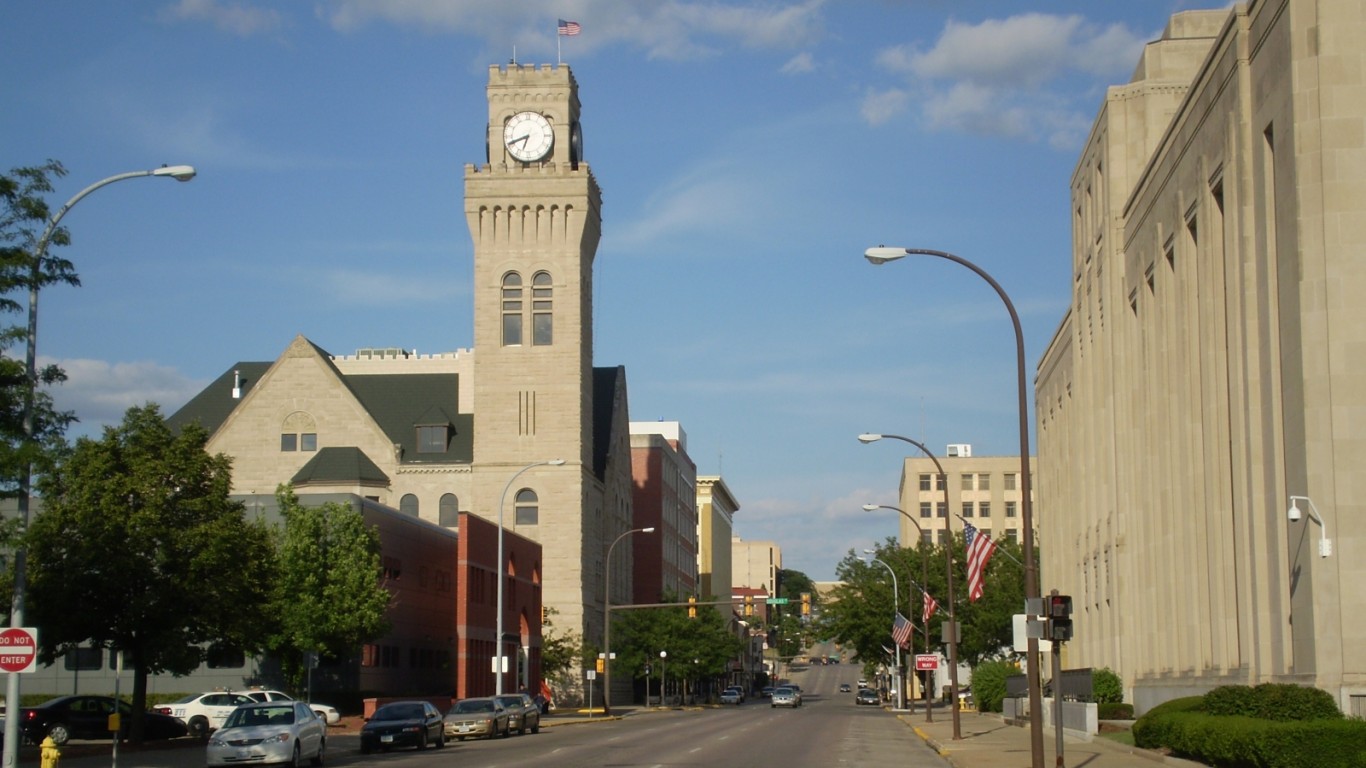
- 1-yr. change in ATF firearm tracings, 2021-2022: +159.2% (+121)
- ATF firearm tracings for each year: 197 in 2022; 76 in 2021
- Change in population, 2021-2022: +0.5% (+388)
- ATF firearm tracings in 2022 adjusted for population: 230.5 per 100,000 people
- ATF firearm tracings in 2021 adjusted for population: 89.3 per 100,000 people
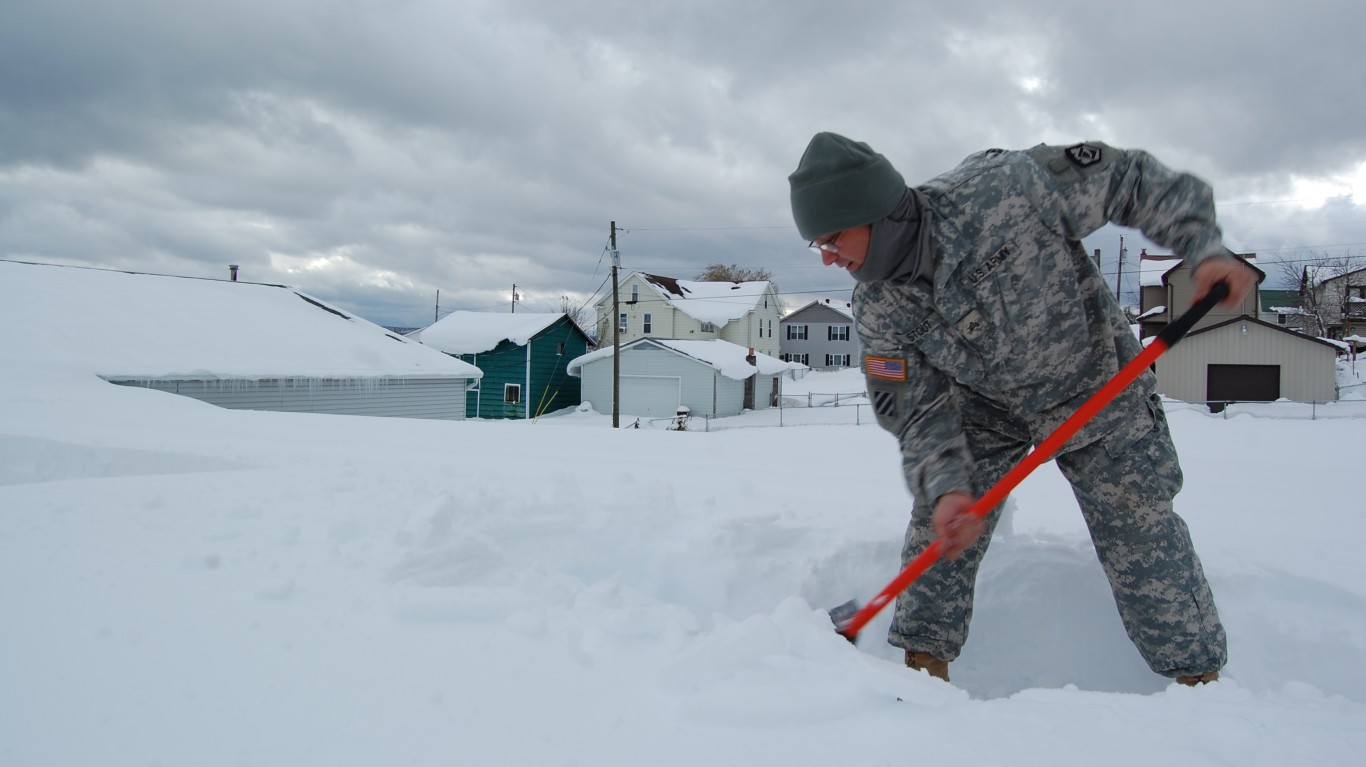
5. Great Falls, MT
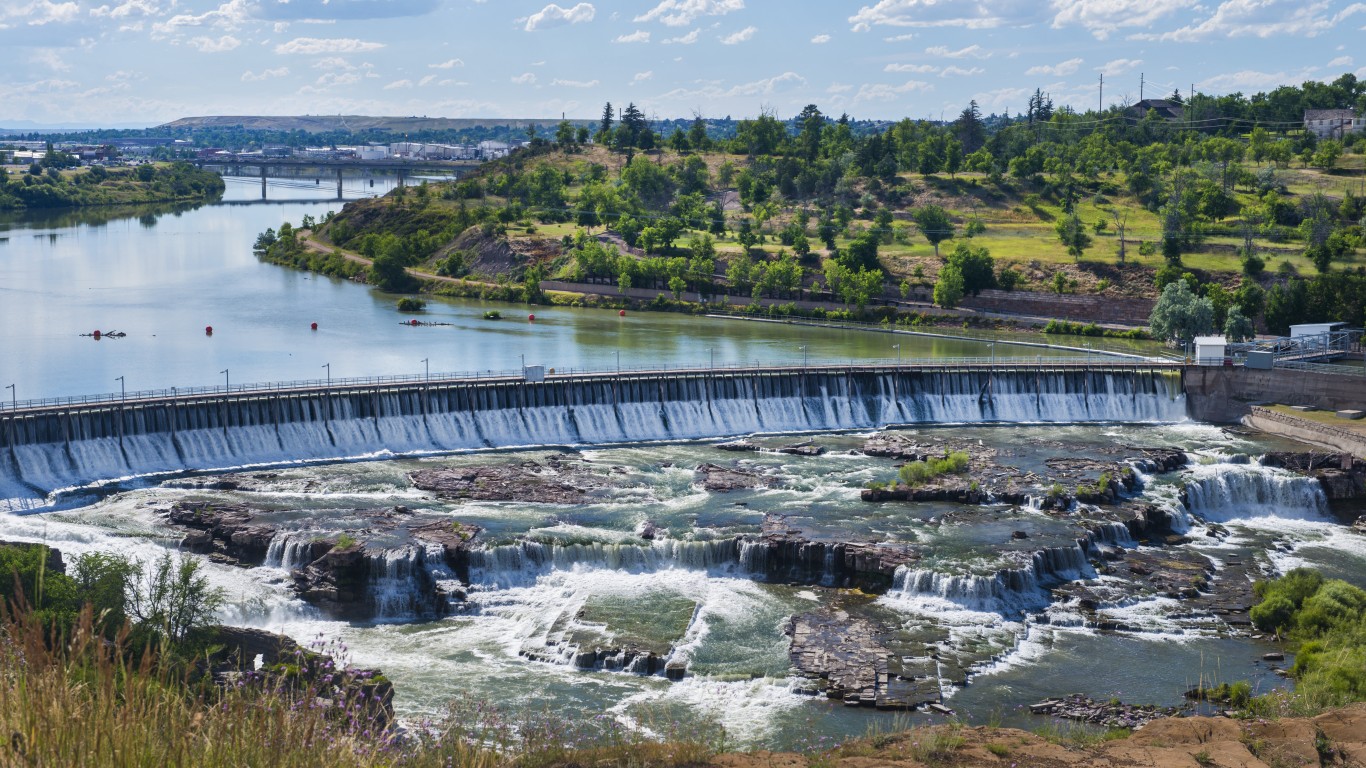
- 1-yr. change in ATF firearm tracings, 2021-2022: +164.7% (+140)
- ATF firearm tracings for each year: 225 in 2022; 85 in 2021
- Change in population, 2021-2022: -0.01% (-8)
- ATF firearm tracings in 2022 adjusted for population: 372.7 per 100,000 people
- ATF firearm tracings in 2021 adjusted for population: 140.8 per 100,000 people
4. New Britain, CT
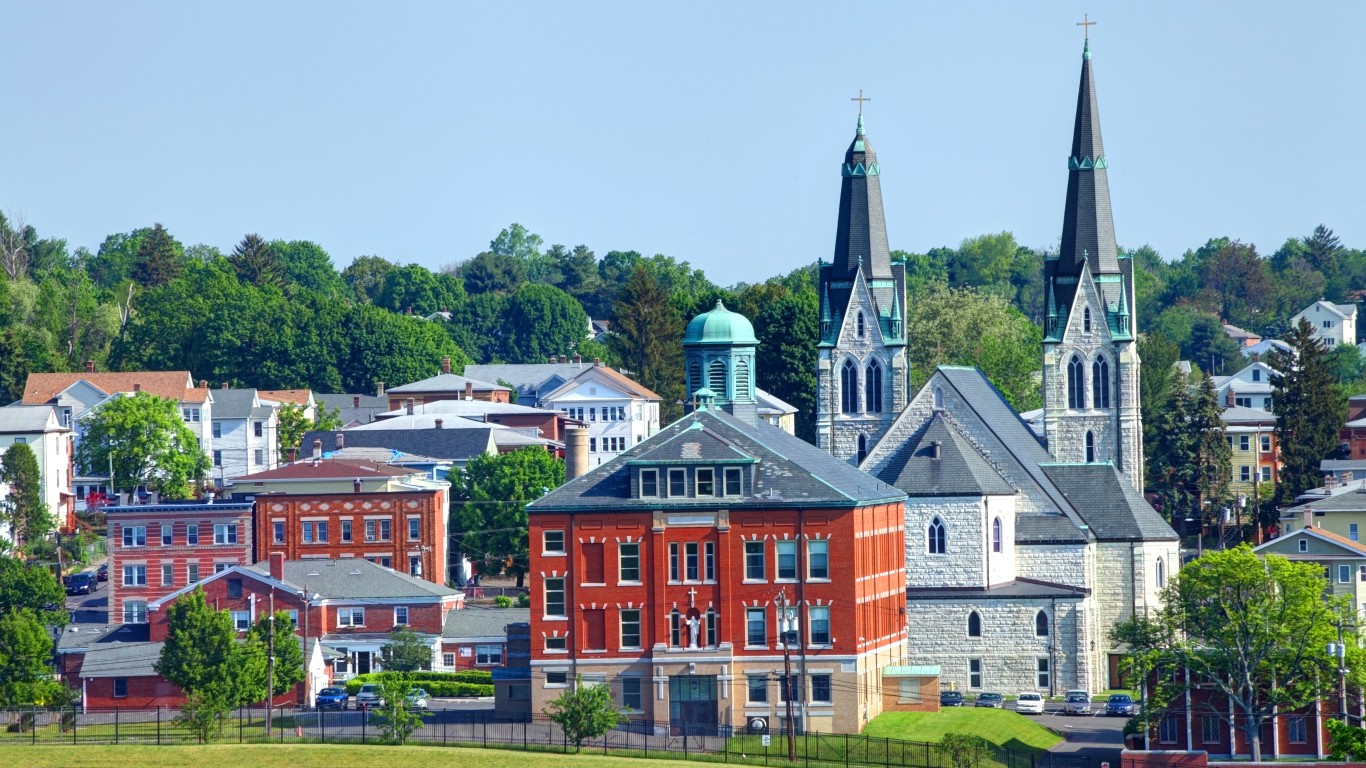
- 1-yr. change in ATF firearm tracings, 2021-2022: +165.2% (+114)
- ATF firearm tracings for each year: 183 in 2022; 69 in 2021
- Change in population, 2021-2022: +0.3% (+190)
- ATF firearm tracings in 2022 adjusted for population: 246.6 per 100,000 people
- ATF firearm tracings in 2021 adjusted for population: 93.2 per 100,000 people
3. Farmington, NM

- 1-yr. change in ATF firearm tracings, 2021-2022: +176.9% (+92)
- ATF firearm tracings for each year: 144 in 2022; 52 in 2021
- Change in population, 2021-2022: -0.5% (-239)
- ATF firearm tracings in 2022 adjusted for population: 310.0 per 100,000 people
- ATF firearm tracings in 2021 adjusted for population: 111.4 per 100,000 people
2. Fort Worth, TX
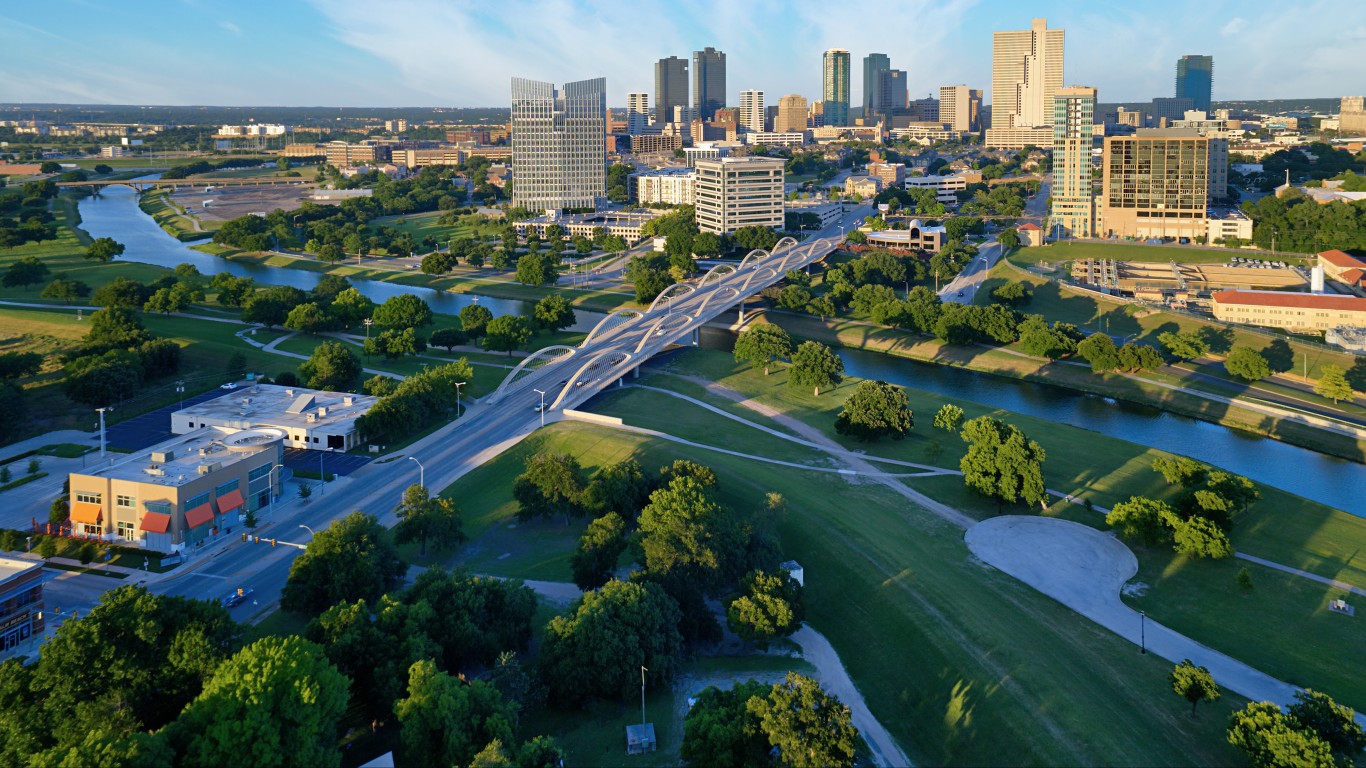
- 1-yr. change in ATF firearm tracings, 2021-2022: +274.3% (+1,975)
- ATF firearm tracings for each year: 2,695 in 2022; 720 in 2021
- Change in population, 2021-2022: +1.8% (+16,194)
- ATF firearm tracings in 2022 adjusted for population: 291.5 per 100,000 people
- ATF firearm tracings in 2021 adjusted for population: 79.3 per 100,000 people
1. Montgomery, AL

- 1-yr. change in ATF firearm tracings, 2021-2022: +317.0% (+596)
- ATF firearm tracings for each year: 784 in 2022; 188 in 2021
- Change in population, 2021-2022: -0.6% (-1,203)
- ATF firearm tracings in 2022 adjusted for population: 392.4 per 100,000 people
- ATF firearm tracings in 2021 adjusted for population: 93.5 per 100,000 people