Key Points
- Police officers are authorized to use deadly force in certain situations, and since the beginning of 2020, more than 6,000 people in the U.S. have been killed by American law enforcement.
- Nationwide, there have been approximately 1.8 police killings for every 100,000 people in the last five years — but in many American cities, deadly police violence is far more prevalent.
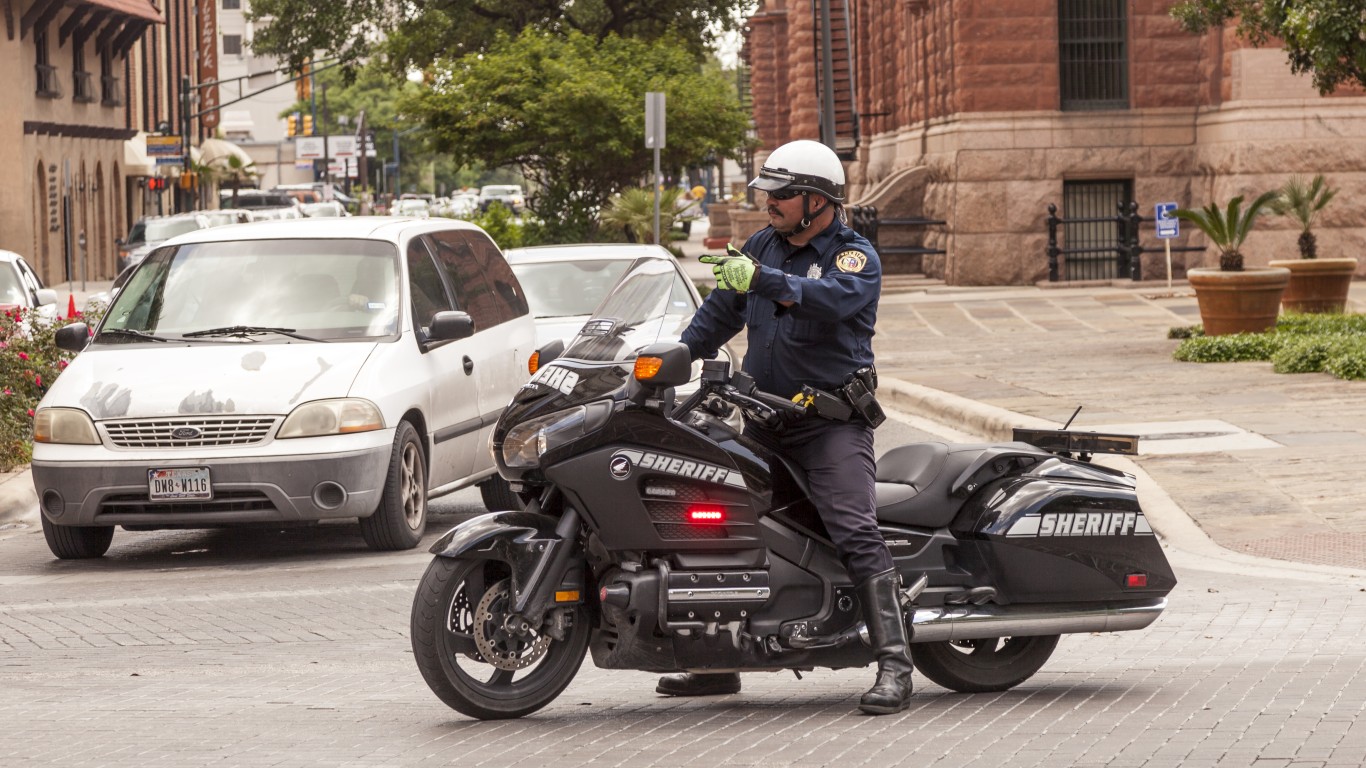
Few professions in the United States are as dangerous as law enforcement. Responding to emergencies, patrolling high-crime areas, conducting traffic stops, and making arrests are part and parcel of the job for many police officers. With regular exposure to these and other potentially volatile situations — particularly in a country where civilian gun ownership is a constitutional right — American law enforcement officers typically carry a firearm.
Generally, police are authorized to use their firearm in cases in which doing so would protect officers or members of the public who are in imminent physical danger. While these circumstances are well defined, reality is not always as clear cut. In practice, officers often have to make split-second judgment calls based on limited information. (Here is a look at the most commonly used police firearms.)
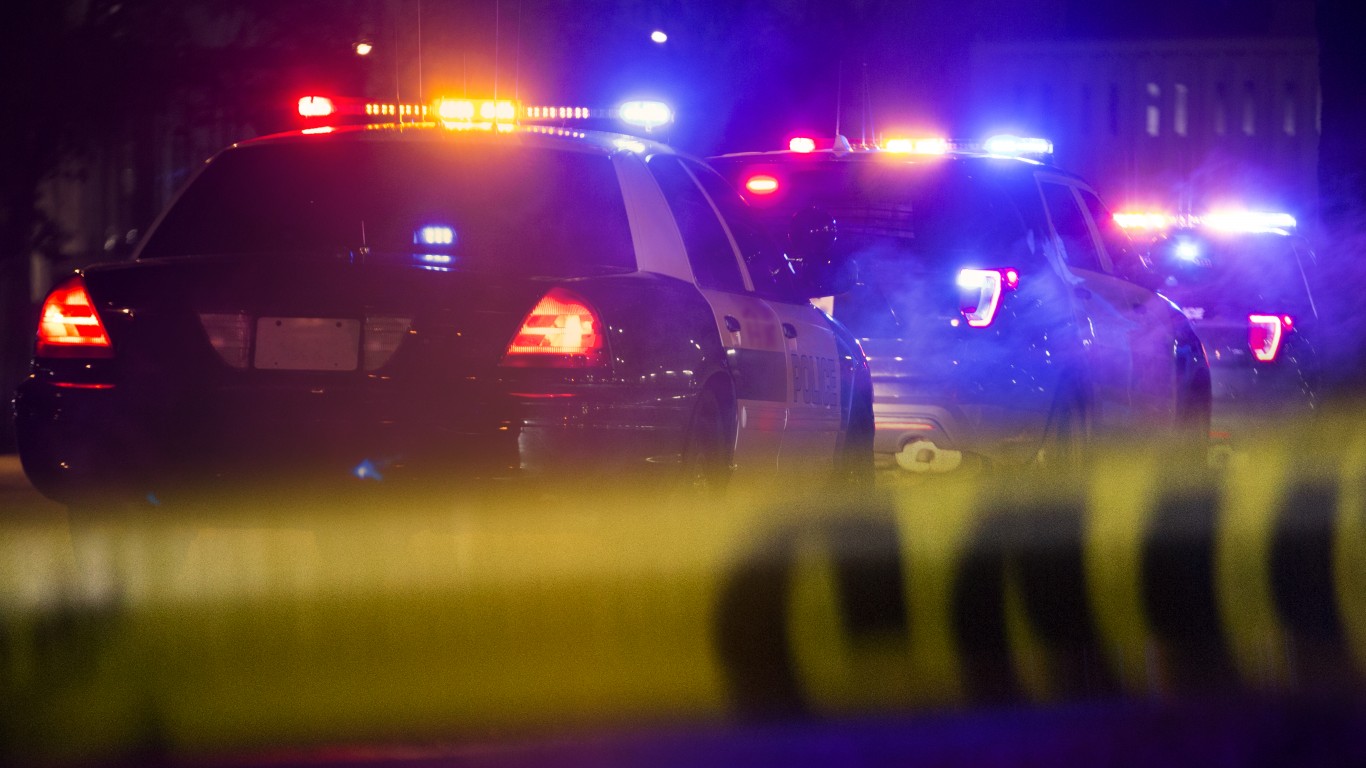
Between January 2020 and October 2024, more than 6,000 people were killed by American law enforcement officials — both on duty and off. Many of these killings have been deemed justifiable. Others, meanwhile, were accidental, and some stand as clear examples of abuses of power. Whether justified or not, police killings are far more common than average in certain U.S. cities.
Using data from Mapping Police Violence, a research collaborative that collects data on police killings, 24/7 Wall St. identified the American cities where police kill the most people. Cities are ranked by the population-adjusted number of people killed by police officers between January 2020 and October 2024. Population data used to calculate the rate of police killings are five year estimates from the U.S. Census Bureau’s 2022 American Community Survey.
Nationwide, there have been a total of 1.8 police killings for every 100,000 people since the beginning of 2020. Meanwhile, among the 50 cities on this list, the rate of police killings over the same period ranges from about 3 for every 100,000 people to well over 10 per 100,000. (Here is a look at the states with the most gun-related crime.)
Nationwide, about 20% of those killed by police since January 2020 displayed signs of mental illness, and nearly 17% of Americans killed at the hands of police were unarmed. From a demographic perspective, the vast majority of those killed by police — nearly 94% — were men. Additionally, about 41% of Americans killed by law enforcement were white, 24% were Black, 18% were Hispanic, and fewer than 2% were Asian or Native American. These circumstantial and demographic statistics vary considerably in across the cities on this list, however.
These are the American cities with the most known police killings.
Why It Matters

Law enforcement is one of the most dangerous jobs in the United States — and due to the nature of the work, police are authorized to use deadly force in certain situations. While most police killings are deemed justifiable, many are accidental or clear cases of abuse of power. Right or wrong, police use of deadly force is far more common than average in certain U.S. cities.
50. Wichita, Kansas
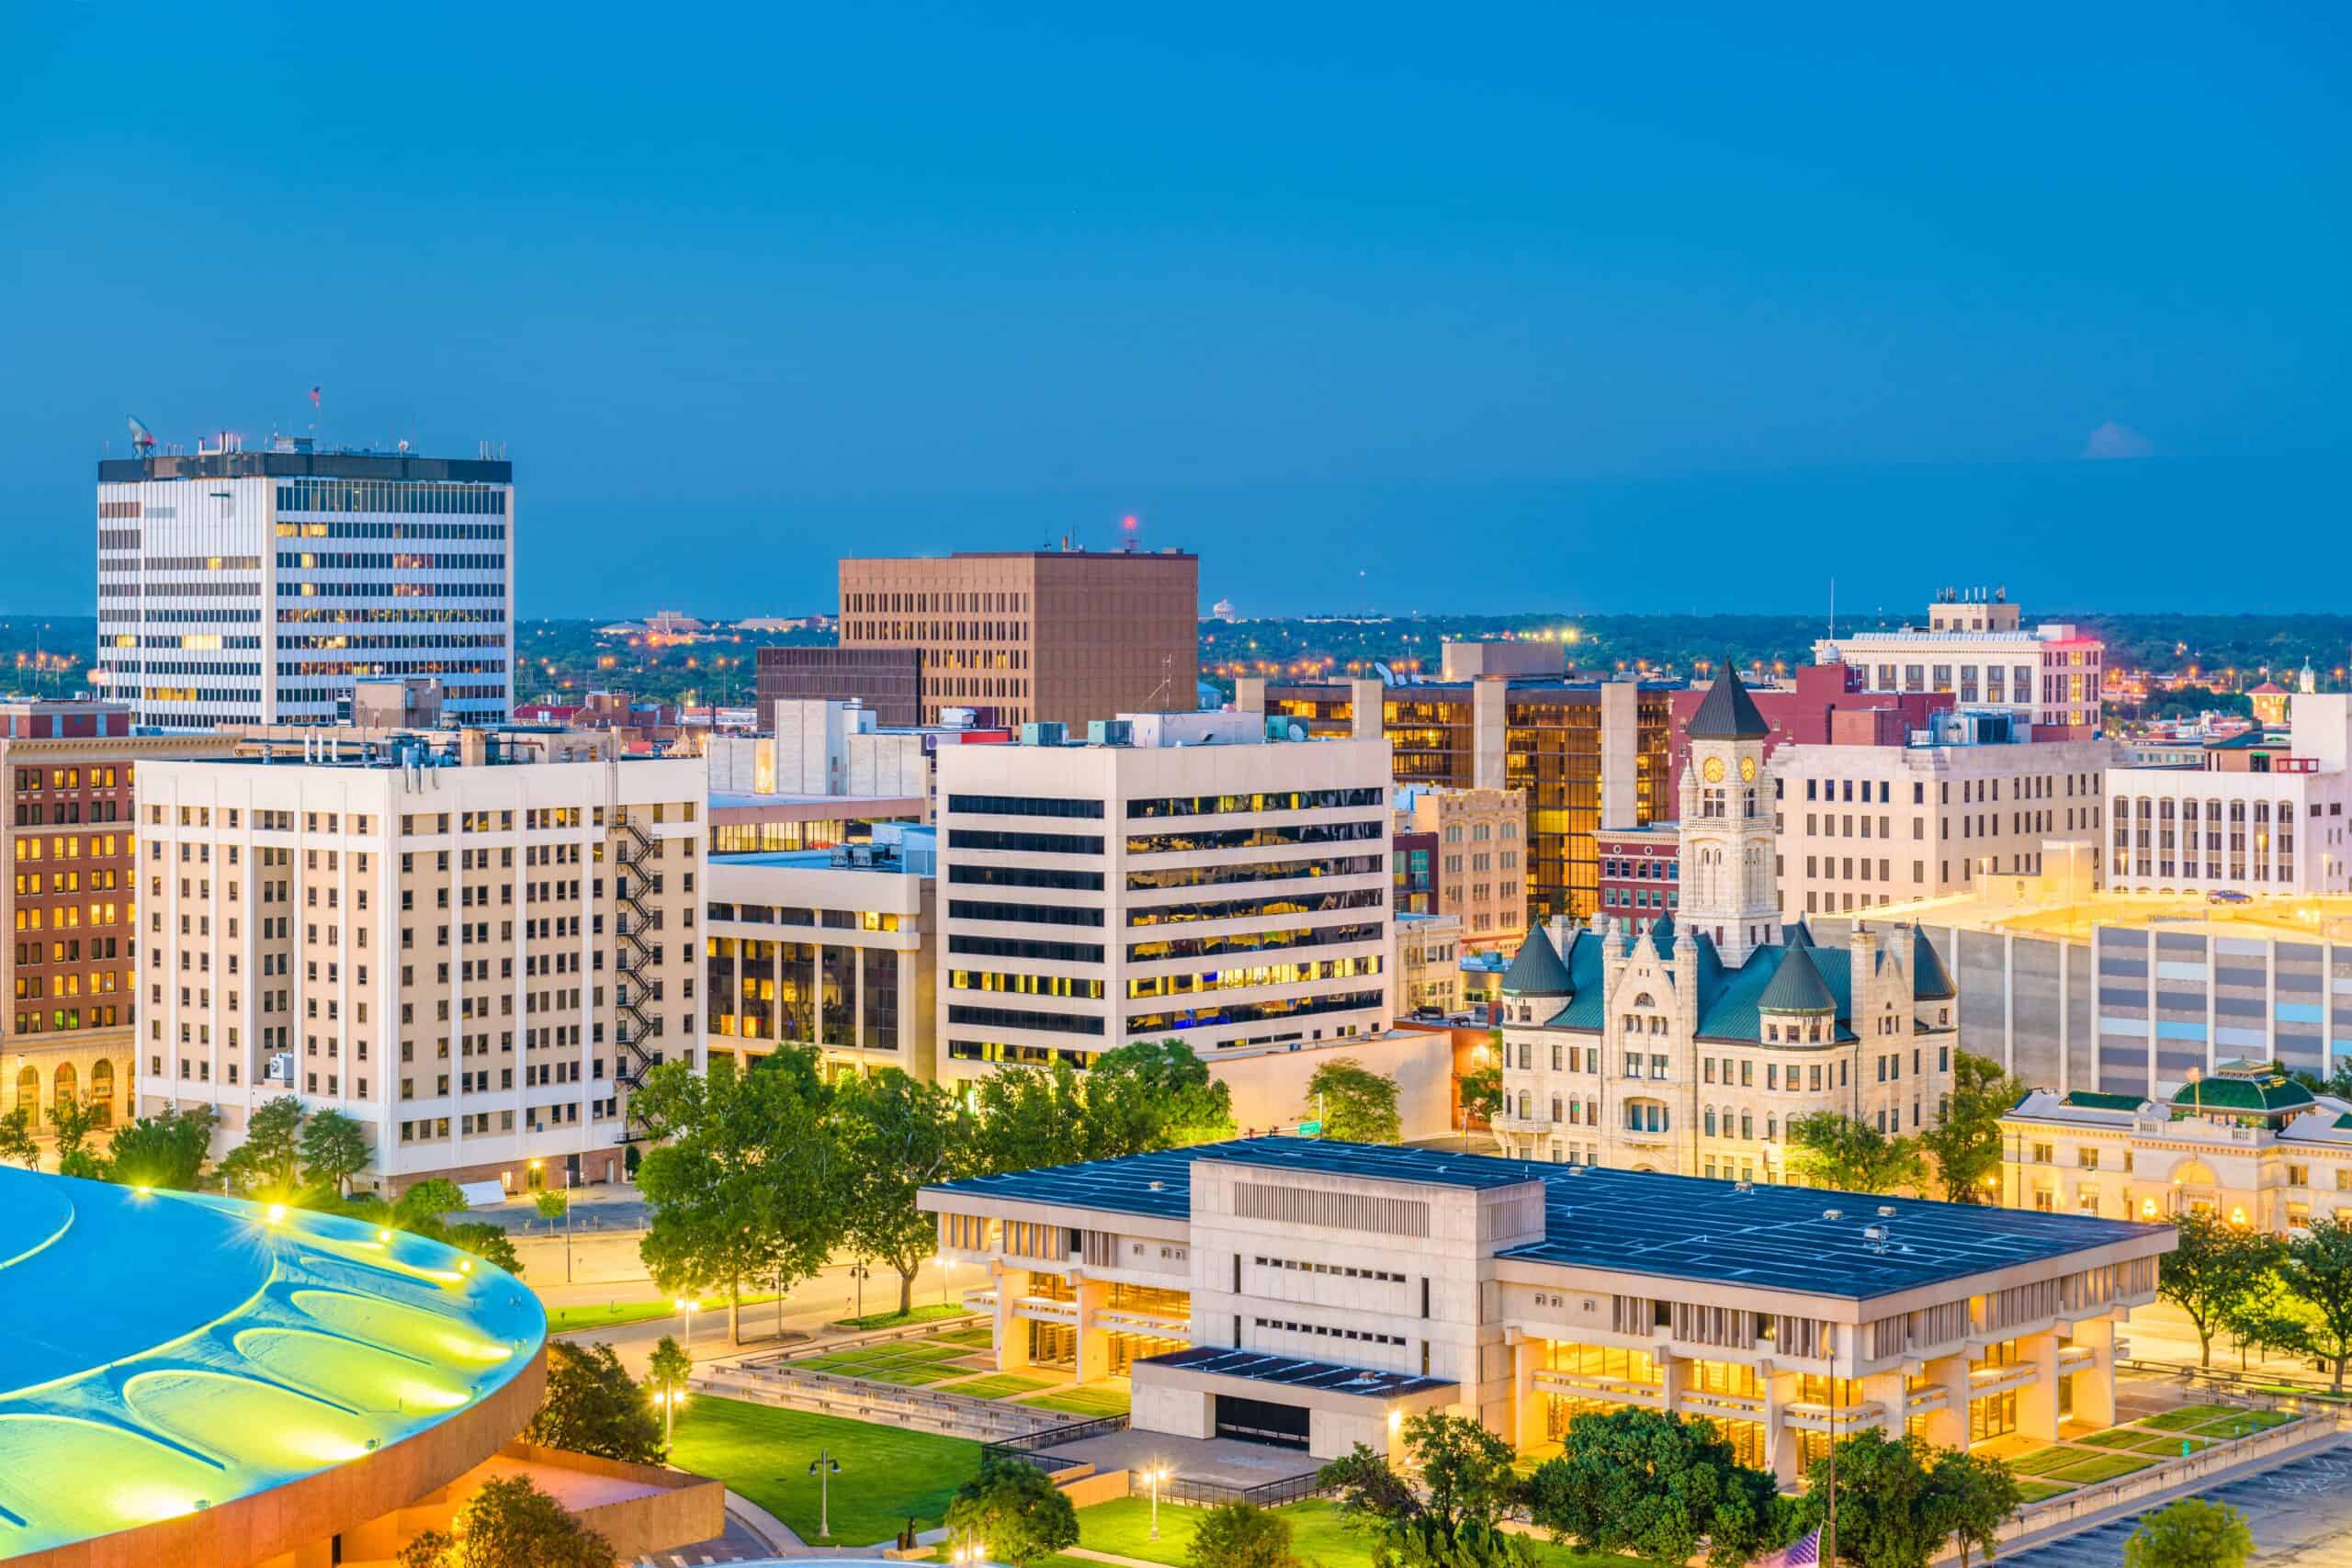
- Documented police killings, Jan. 2020 – Oct. 2024: 3.0 per 100,000 people (12 total)
- Gender of those killed: 100.0% male, 0.0% female
- Race/ethnicity of those killed: 50.0% White, 8.3% Black, 33.3% Hispanic, 0.0% Native American, 0.0% Asian
- Share of those killed with signs of a mental illness: 41.7%
- Share of those killed who were unarmed: 25.0%
- City population: 395,951
49. Indianapolis, Indiana
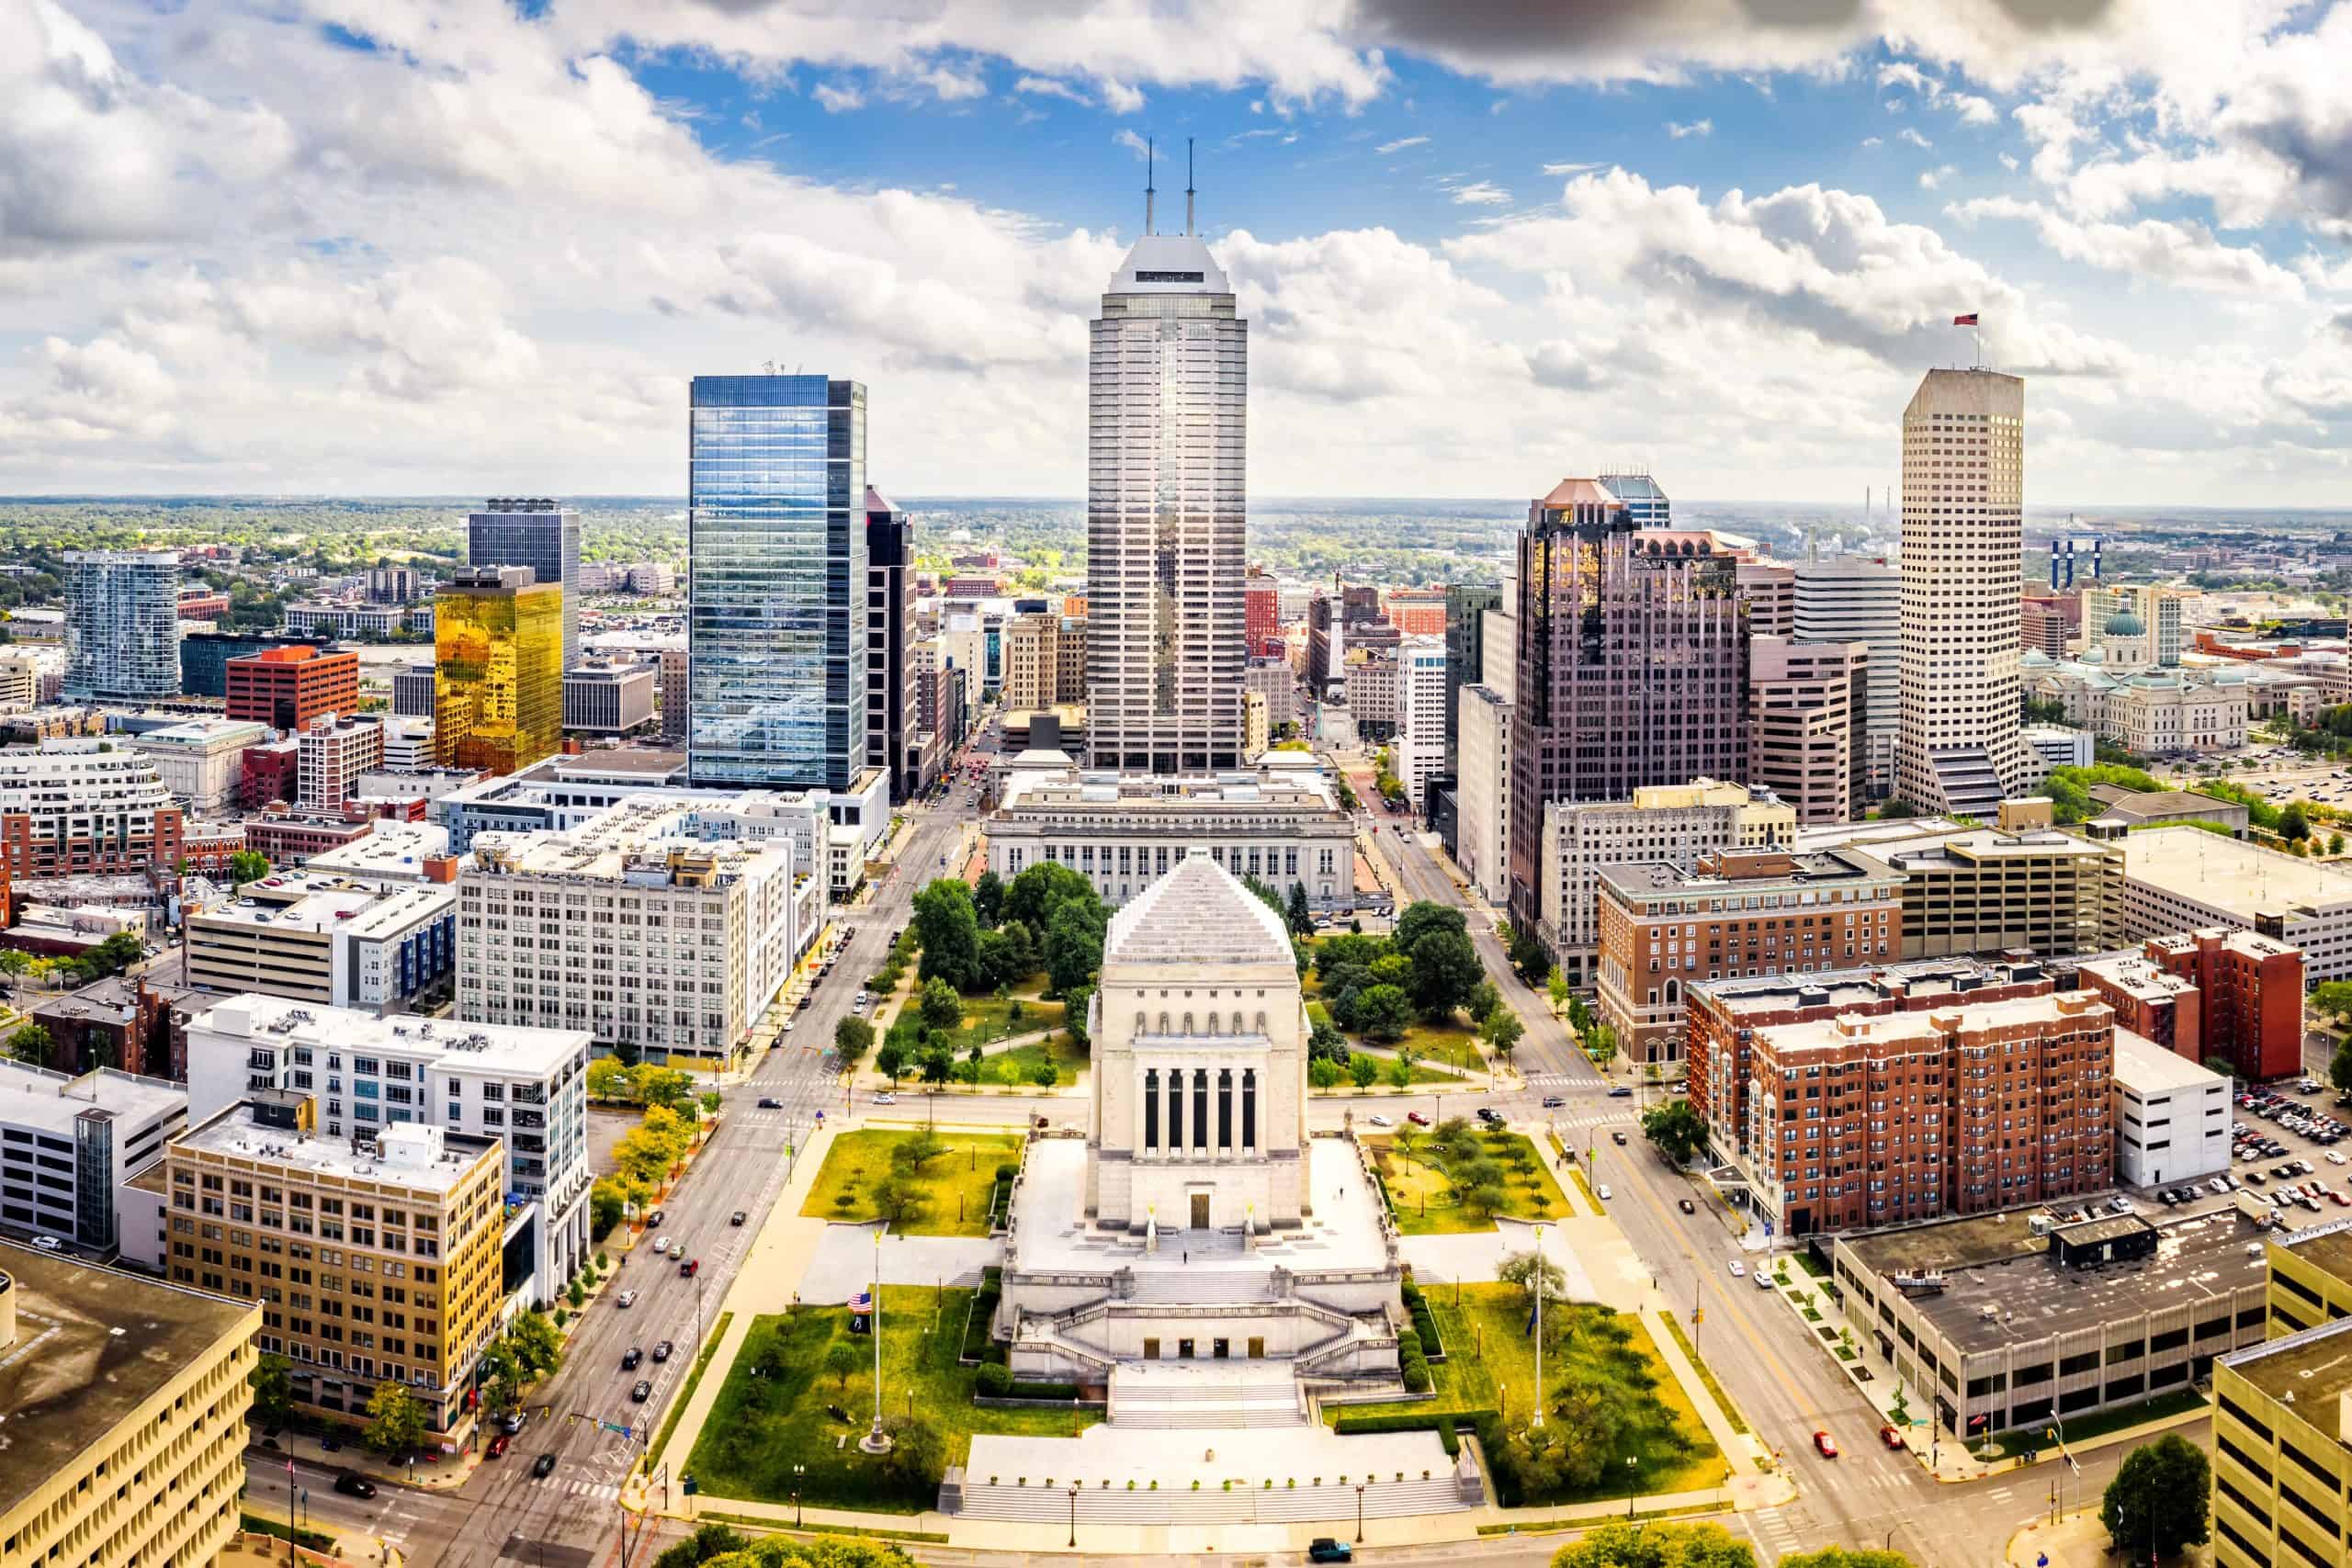
- Documented police killings, Jan. 2020 – Oct. 2024: 3.1 per 100,000 people (27 total)
- Gender of those killed: 96.3% male, 3.7% female
- Race/ethnicity of those killed: 11.1% White, 74.1% Black, 3.7% Hispanic, 0.0% Native American, 0.0% Asian
- Share of those killed with signs of a mental illness: 29.6%
- Share of those killed who were unarmed: 14.8%
- City population: 882,006
48. Oklahoma City, Oklahoma
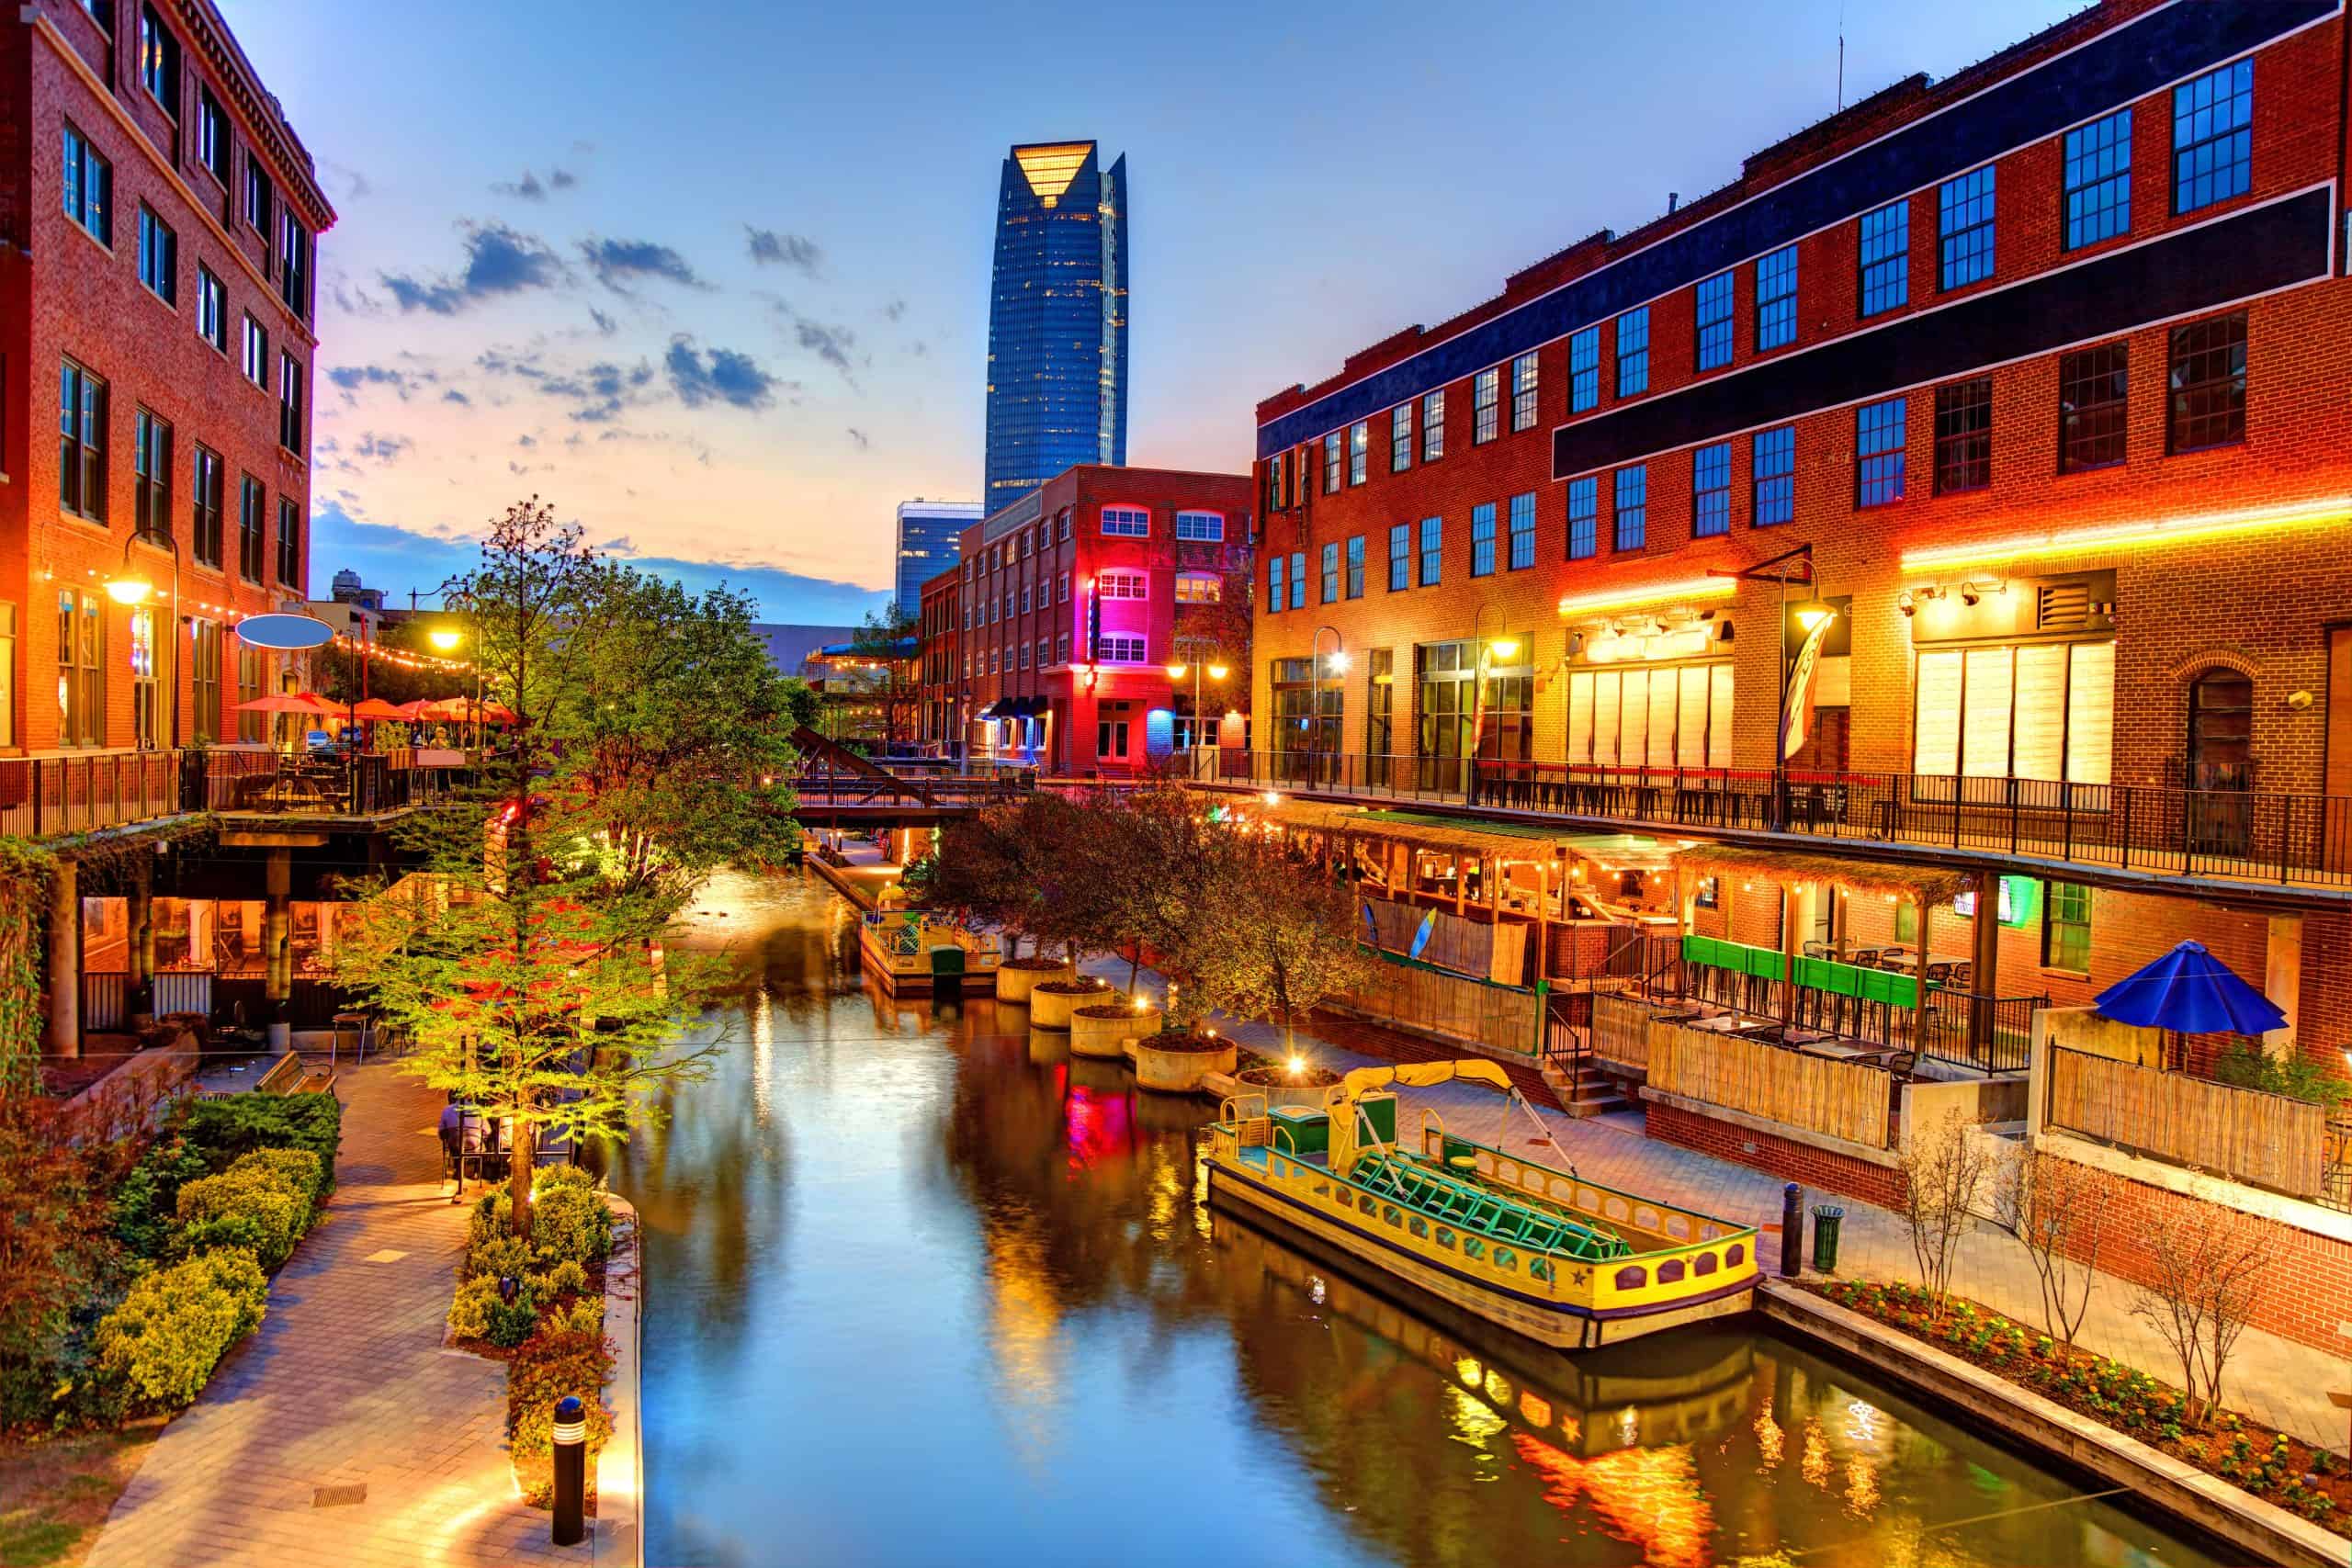
- Documented police killings, Jan. 2020 – Oct. 2024: 3.1 per 100,000 people (21 total)
- Gender of those killed: 85.7% male, 14.3% female
- Race/ethnicity of those killed: 52.4% White, 33.3% Black, 4.8% Hispanic, 4.8% Native American, 0.0% Asian
- Share of those killed with signs of a mental illness: 23.8%
- Share of those killed who were unarmed: 19.0%
- City population: 681,088
47. Stockton, California
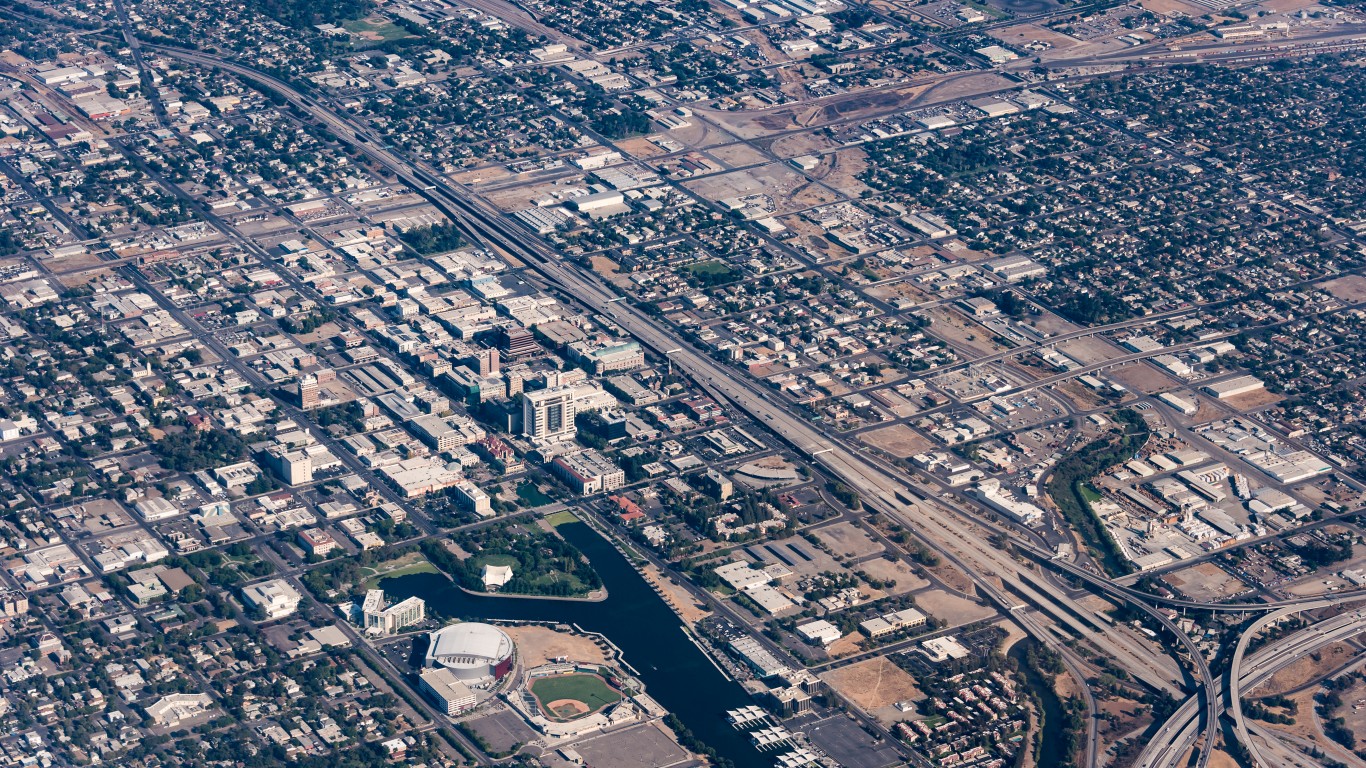
- Documented police killings, Jan. 2020 – Oct. 2024: 3.1 per 100,000 people (10 total)
- Gender of those killed: 90.0% male, 10.0% female
- Race/ethnicity of those killed: 10.0% White, 60.0% Black, 10.0% Hispanic, 0.0% Native American, 0.0% Asian
- Share of those killed with signs of a mental illness: 10.0%
- Share of those killed who were unarmed: 30.0%
- City population: 320,030
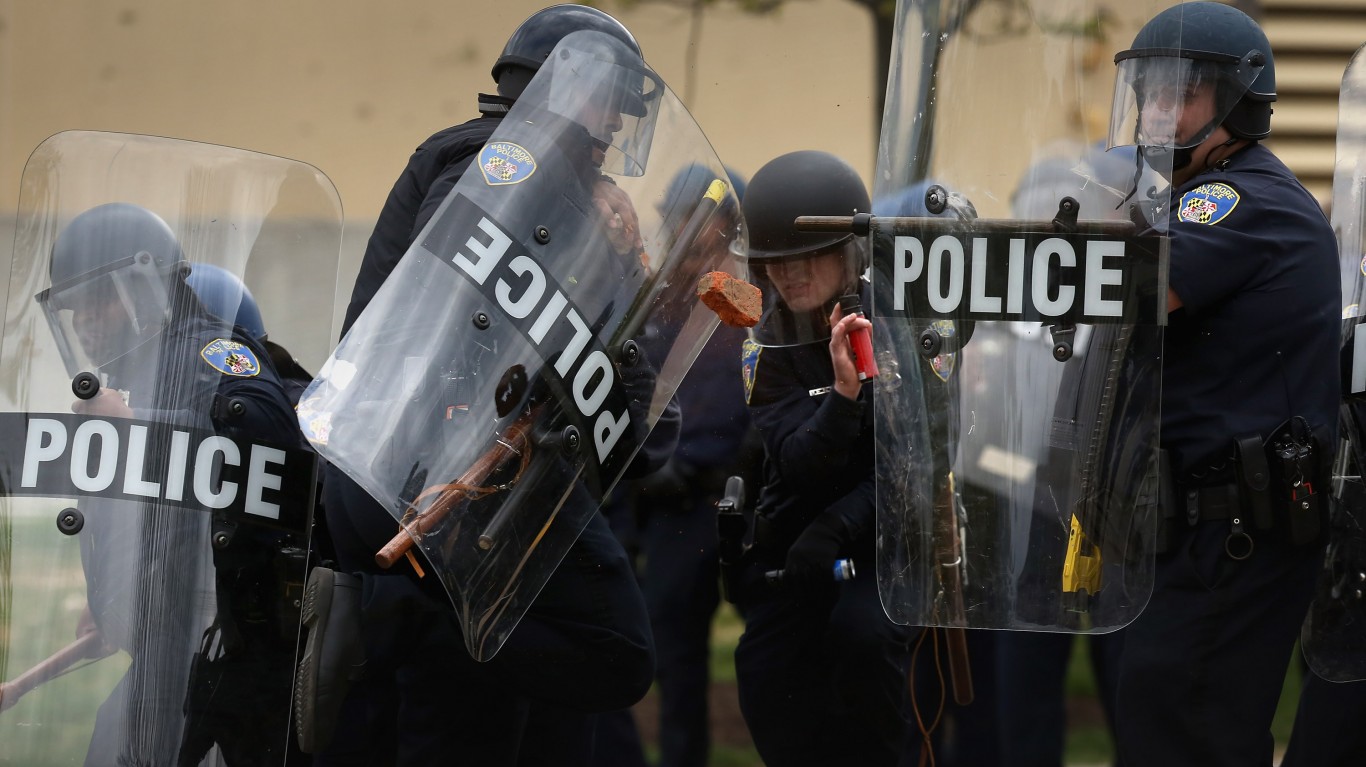
46. Baltimore, Maryland

- Documented police killings, Jan. 2020 – Oct. 2024: 3.3 per 100,000 people (19 total)
- Gender of those killed: 100.0% male, 0.0% female
- Race/ethnicity of those killed: 5.3% White, 84.2% Black, 5.3% Hispanic, 0.0% Native American, 0.0% Asian
- Share of those killed with signs of a mental illness: 26.3%
- Share of those killed who were unarmed: 15.8%
- City population: 584,548
45. Jacksonville, Florida

- Documented police killings, Jan. 2020 – Oct. 2024: 3.3 per 100,000 people (31 total)
- Gender of those killed: 96.8% male, 3.2% female
- Race/ethnicity of those killed: 25.8% White, 58.1% Black, 9.7% Hispanic, 0.0% Native American, 0.0% Asian
- Share of those killed with signs of a mental illness: 22.6%
- Share of those killed who were unarmed: 6.5%
- City population: 950,203
44. Greensboro, North Carolina
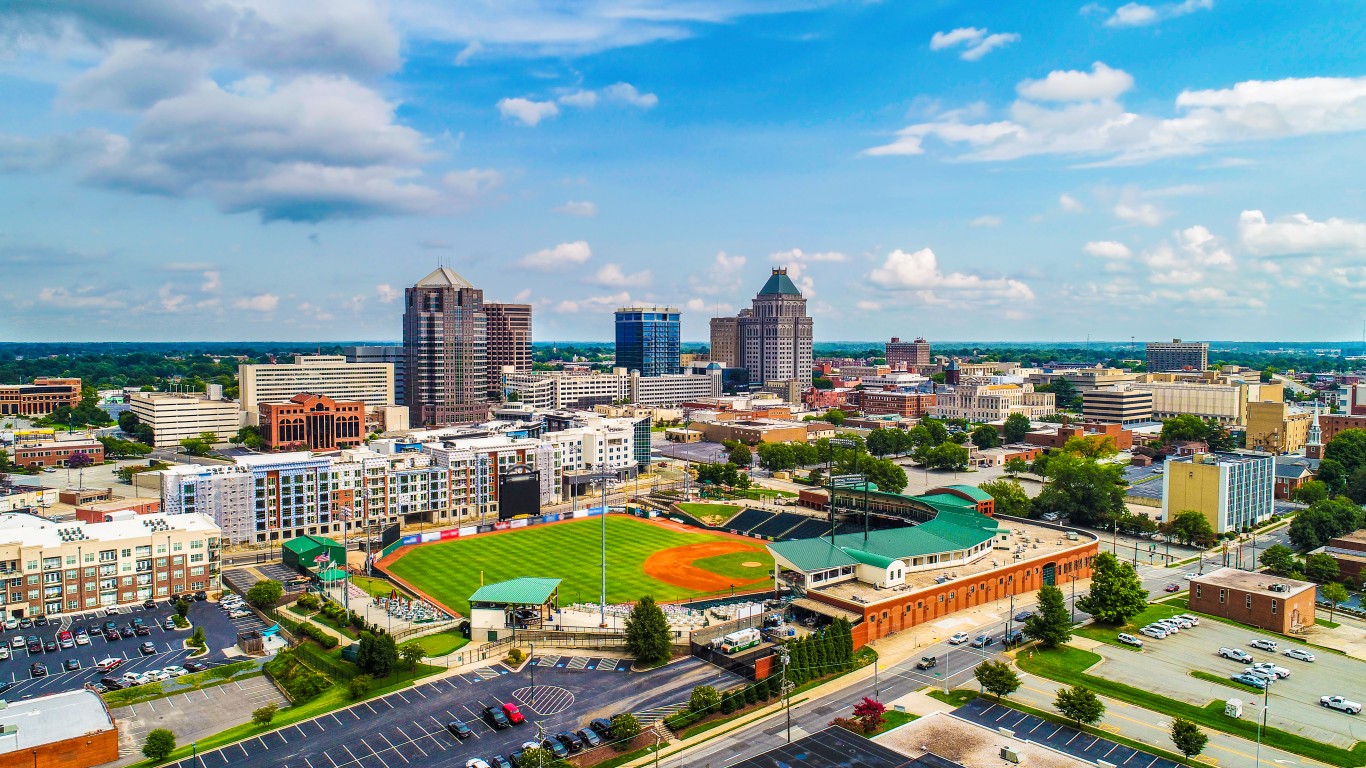
- Documented police killings, Jan. 2020 – Oct. 2024: 3.4 per 100,000 people (10 total)
- Gender of those killed: 100.0% male, 0.0% female
- Race/ethnicity of those killed: 20.0% White, 60.0% Black, 10.0% Hispanic, 0.0% Native American, 0.0% Asian
- Share of those killed with signs of a mental illness: 10.0%
- Share of those killed who were unarmed: 60.0%
- City population: 297,202
43. Sacramento, California

- Documented police killings, Jan. 2020 – Oct. 2024: 3.4 per 100,000 people (18 total)
- Gender of those killed: 94.4% male, 5.6% female
- Race/ethnicity of those killed: 38.9% White, 38.9% Black, 22.2% Hispanic, 0.0% Native American, 0.0% Asian
- Share of those killed with signs of a mental illness: 22.2%
- Share of those killed who were unarmed: 27.8%
- City population: 523,600
42. Chandler, Arizona
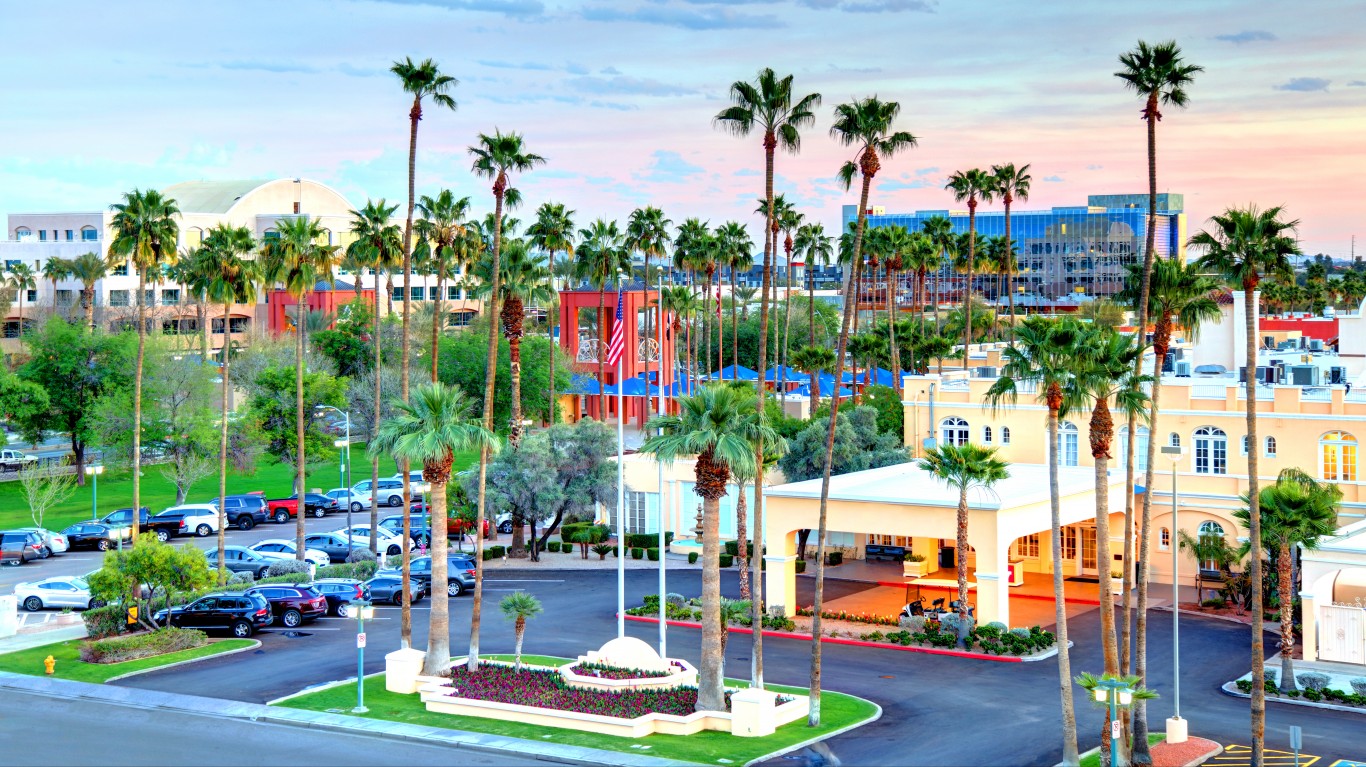
- Documented police killings, Jan. 2020 – Oct. 2024: 3.6 per 100,000 people (10 total)
- Gender of those killed: 90.0% male, 10.0% female
- Race/ethnicity of those killed: 50.0% White, 0.0% Black, 40.0% Hispanic, 0.0% Native American, 0.0% Asian
- Share of those killed with signs of a mental illness: 30.0%
- Share of those killed who were unarmed: 20.0%
- City population: 275,618
41. Memphis, Tennessee

- Documented police killings, Jan. 2020 – Oct. 2024: 3.7 per 100,000 people (23 total)
- Gender of those killed: 82.6% male, 17.4% female
- Race/ethnicity of those killed: 8.7% White, 78.3% Black, 0.0% Hispanic, 0.0% Native American, 0.0% Asian
- Share of those killed with signs of a mental illness: 8.7%
- Share of those killed who were unarmed: 34.8%
- City population: 630,027
40. Fresno, California

- Documented police killings, Jan. 2020 – Oct. 2024: 3.7 per 100,000 people (20 total)
- Gender of those killed: 100.0% male, 0.0% female
- Race/ethnicity of those killed: 15.0% White, 10.0% Black, 70.0% Hispanic, 0.0% Native American, 5.0% Asian
- Share of those killed with signs of a mental illness: 15.0%
- Share of those killed who were unarmed: 20.0%
- City population: 541,528
39. Kansas CIty, Missouri

- Documented police killings, Jan. 2020 – Oct. 2024: 3.8 per 100,000 people (19 total)
- Gender of those killed: 94.7% male, 5.3% female
- Race/ethnicity of those killed: 21.1% White, 57.9% Black, 0.0% Hispanic, 0.0% Native American, 0.0% Asian
- Share of those killed with signs of a mental illness: 10.5%
- Share of those killed who were unarmed: 5.3%
- City population: 505,958
38. Phoenix, Arizona
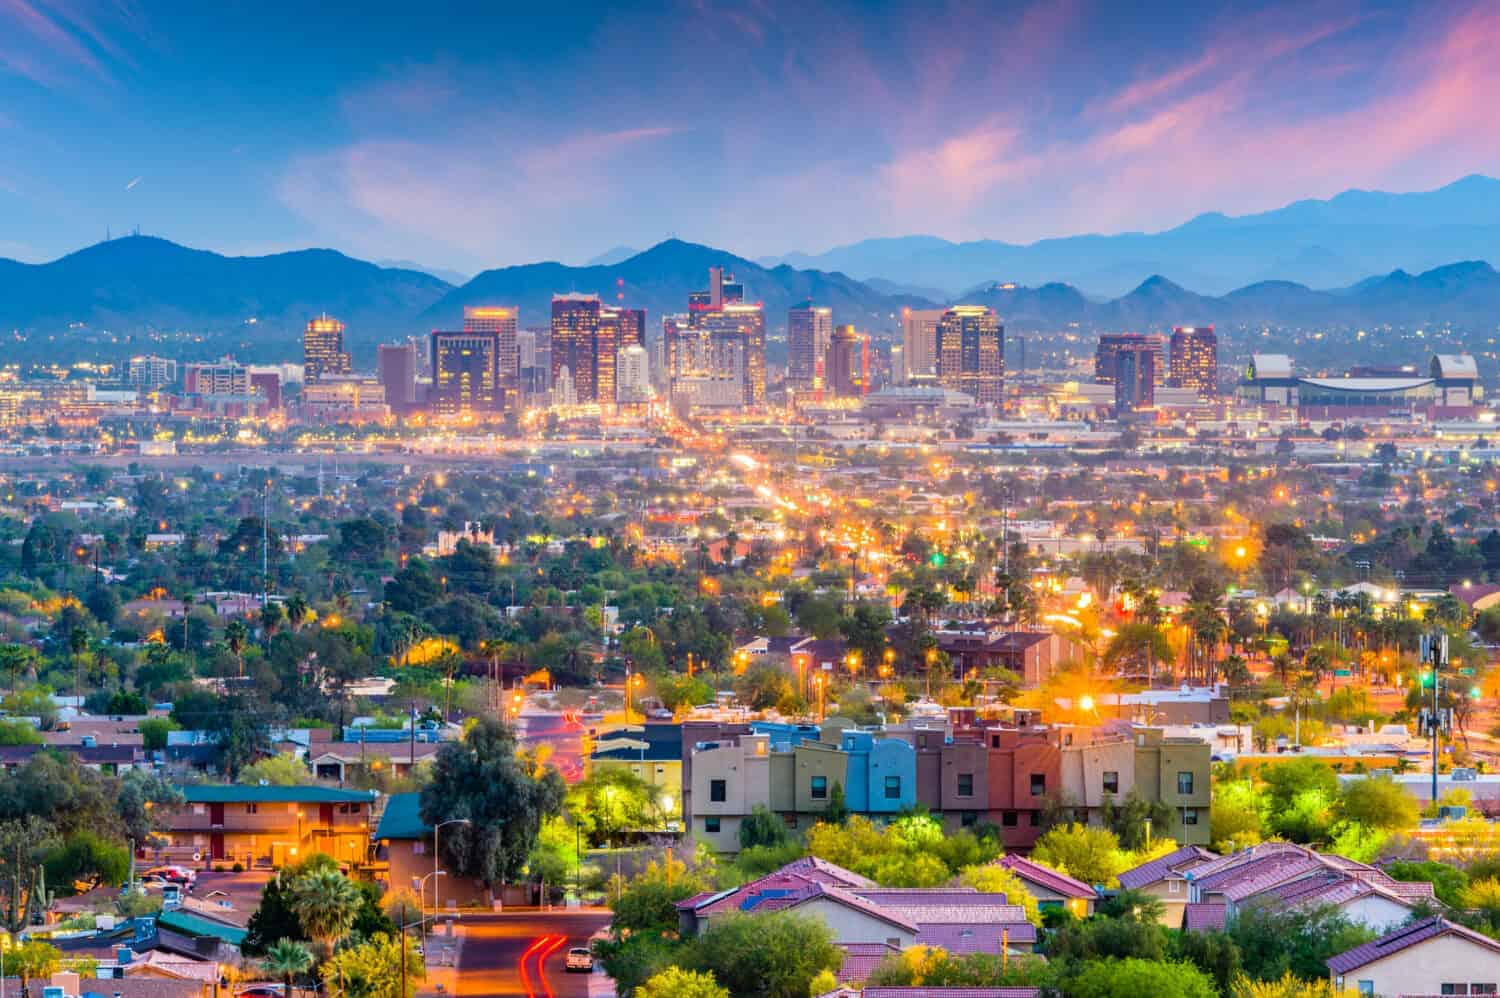
- Documented police killings, Jan. 2020 – Oct. 2024: 3.9 per 100,000 people (63 total)
- Gender of those killed: 93.7% male, 6.3% female
- Race/ethnicity of those killed: 28.6% White, 23.8% Black, 41.3% Hispanic, 3.2% Native American, 0.0% Asian
- Share of those killed with signs of a mental illness: 17.5%
- Share of those killed who were unarmed: 19.0%
- City population: 1,609,456
37. Denver, Colorado
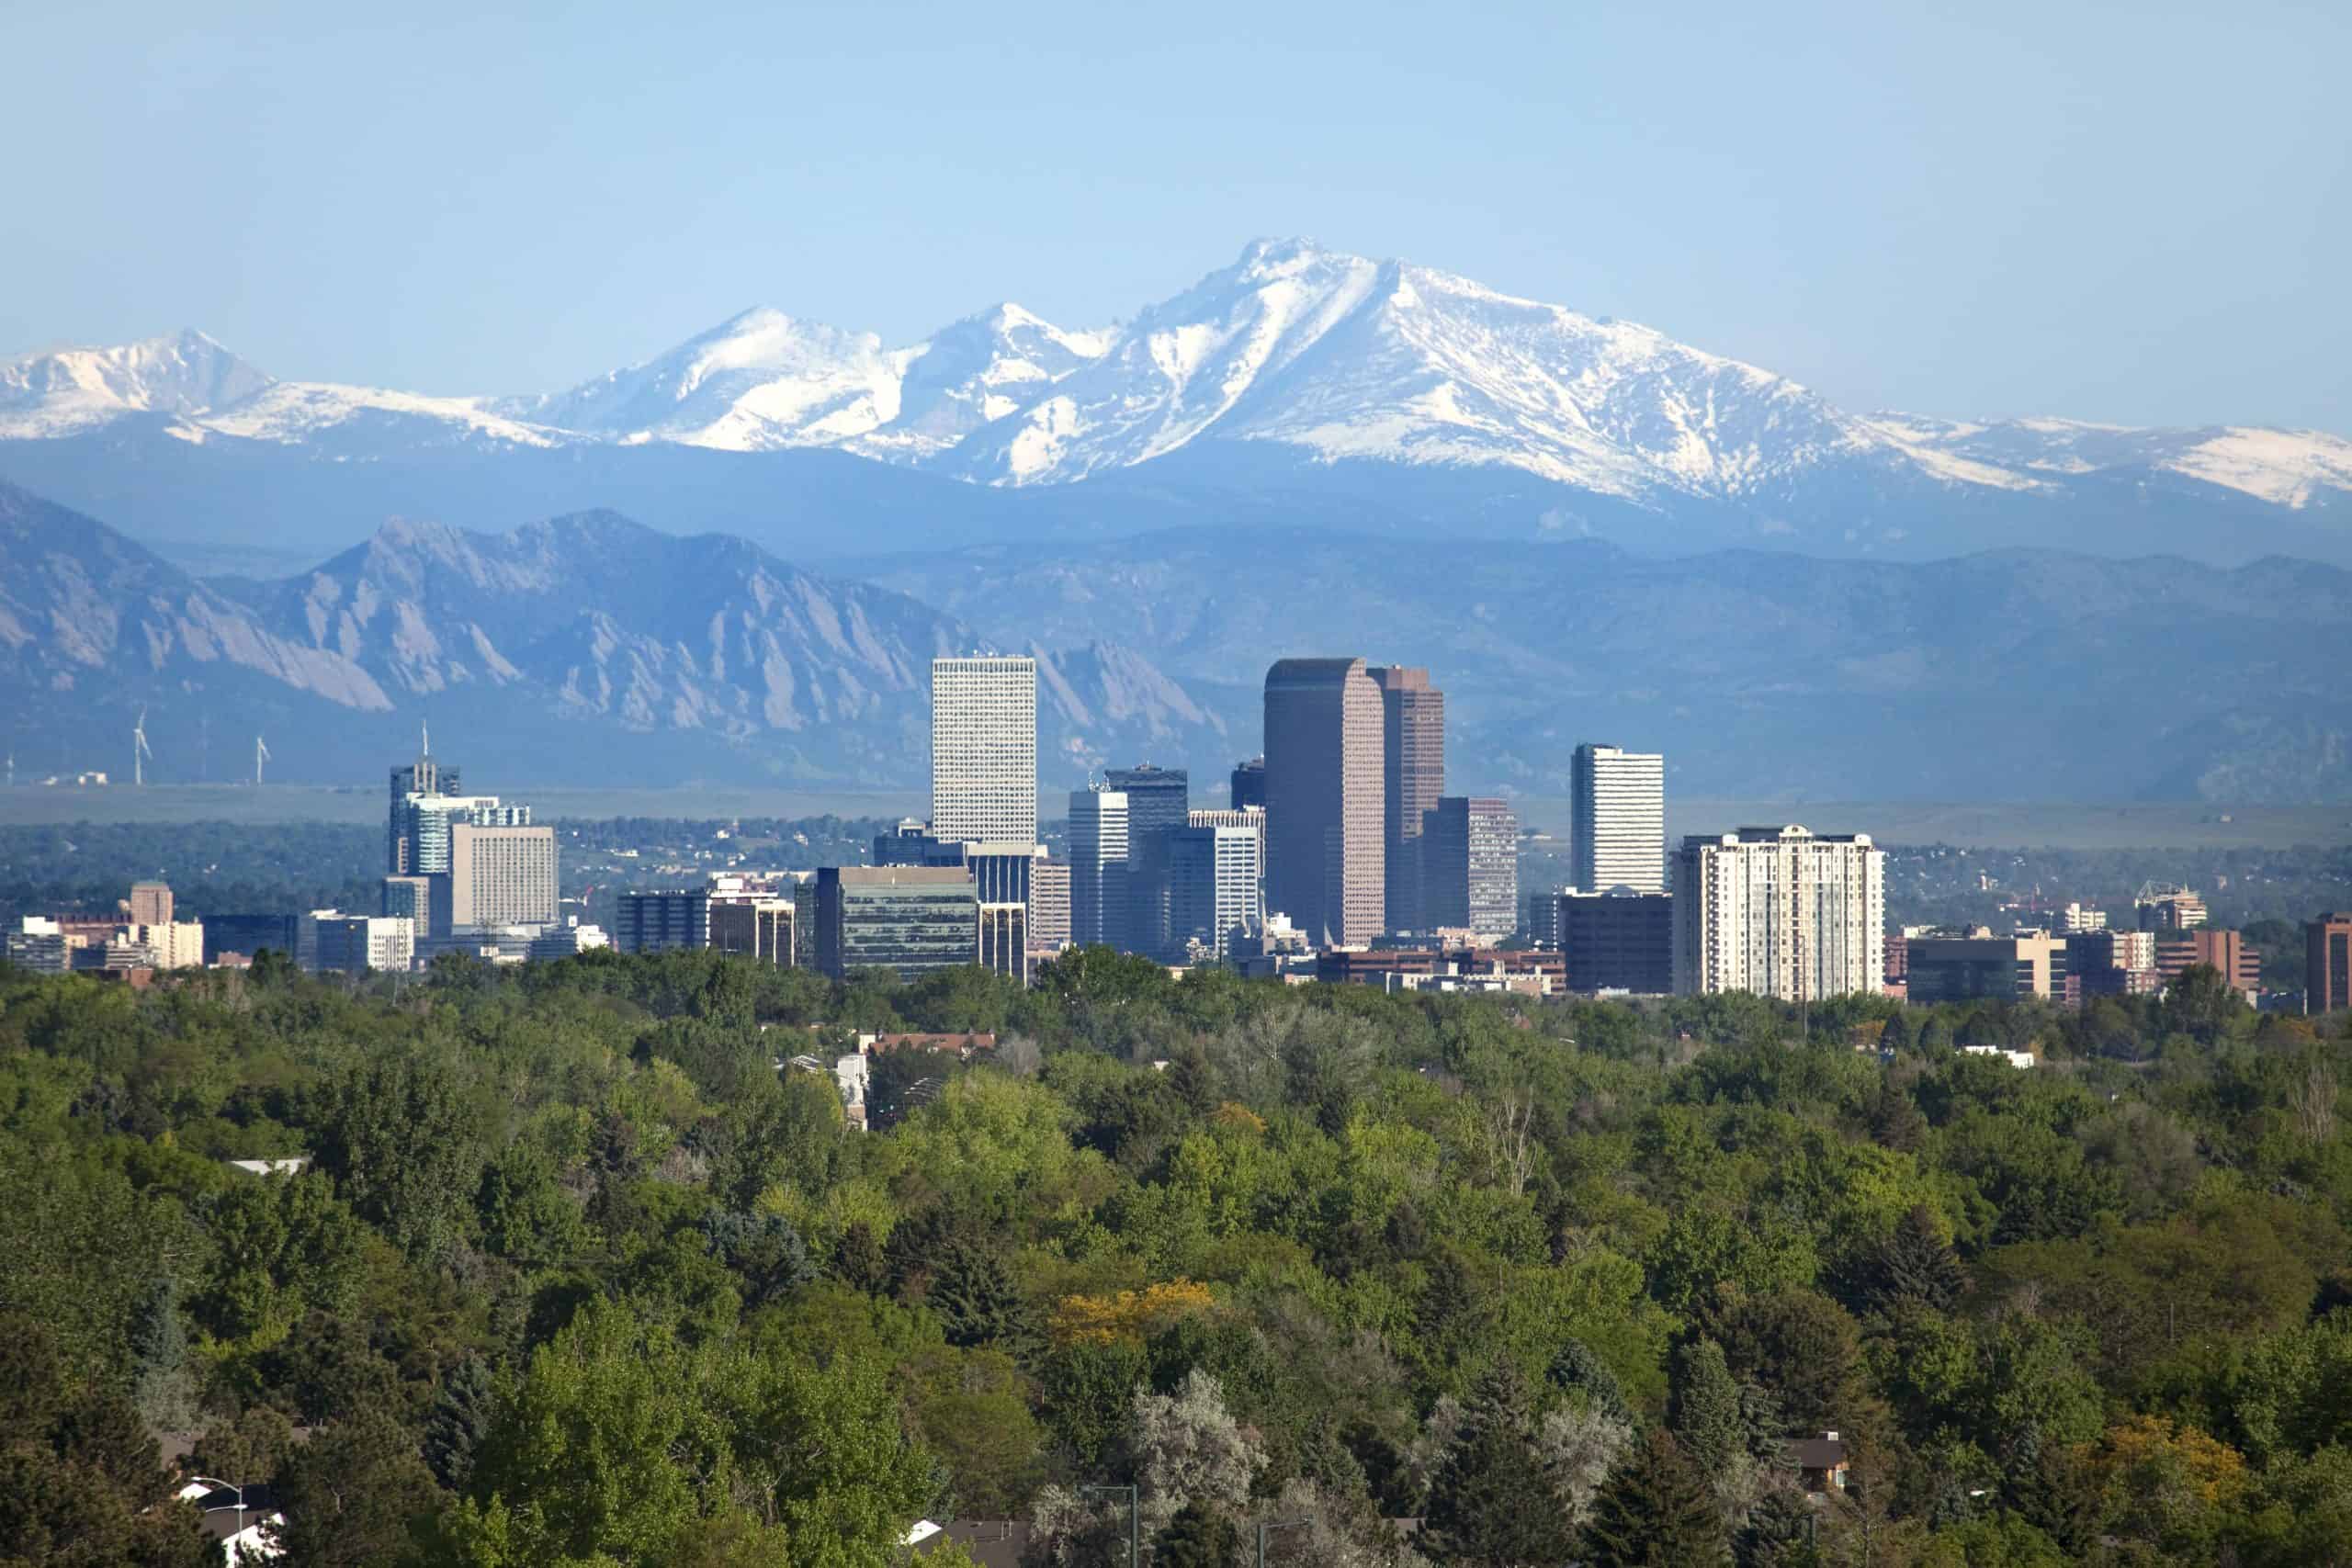
- Documented police killings, Jan. 2020 – Oct. 2024: 3.9 per 100,000 people (28 total)
- Gender of those killed: 92.9% male, 3.6% female
- Race/ethnicity of those killed: 10.7% White, 25.0% Black, 35.7% Hispanic, 3.6% Native American, 0.0% Asian
- Share of those killed with signs of a mental illness: 7.1%
- Share of those killed who were unarmed: 14.3%
- City population: 710,800
36. Houston, Texas
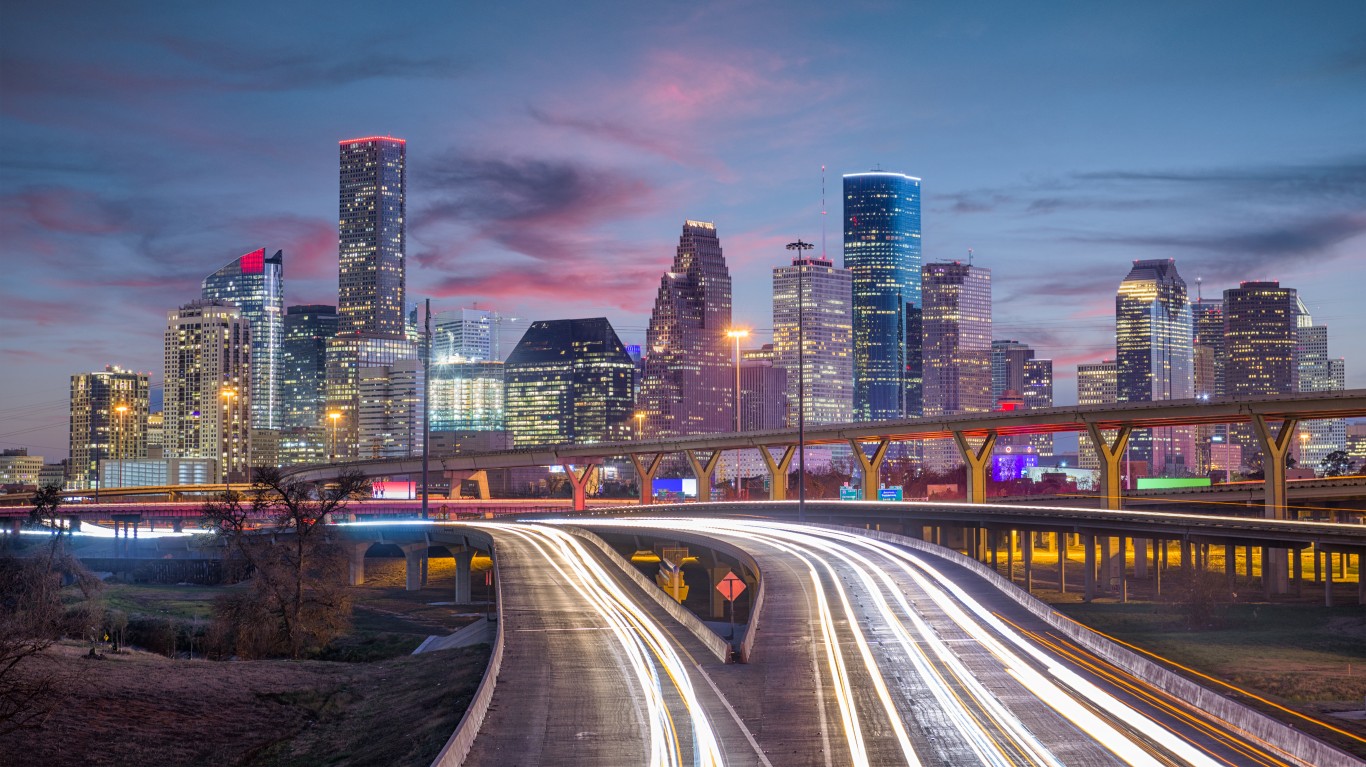
- Documented police killings, Jan. 2020 – Oct. 2024: 4.1 per 100,000 people (93 total)
- Gender of those killed: 95.7% male, 4.3% female
- Race/ethnicity of those killed: 6.5% White, 45.2% Black, 33.3% Hispanic, 0.0% Native American, 2.2% Asian
- Share of those killed with signs of a mental illness: 15.1%
- Share of those killed who were unarmed: 19.4%
- City population: 2,296,253
35. Detroit, Michigan

- Documented police killings, Jan. 2020 – Oct. 2024: 4.1 per 100,000 people (26 total)
- Gender of those killed: 92.3% male, 7.7% female
- Race/ethnicity of those killed: 19.2% White, 65.4% Black, 0.0% Hispanic, 0.0% Native American, 0.0% Asian
- Share of those killed with signs of a mental illness: 23.1%
- Share of those killed who were unarmed: 11.5%
- City population: 636,787
34. North Las Vegas, Nevada
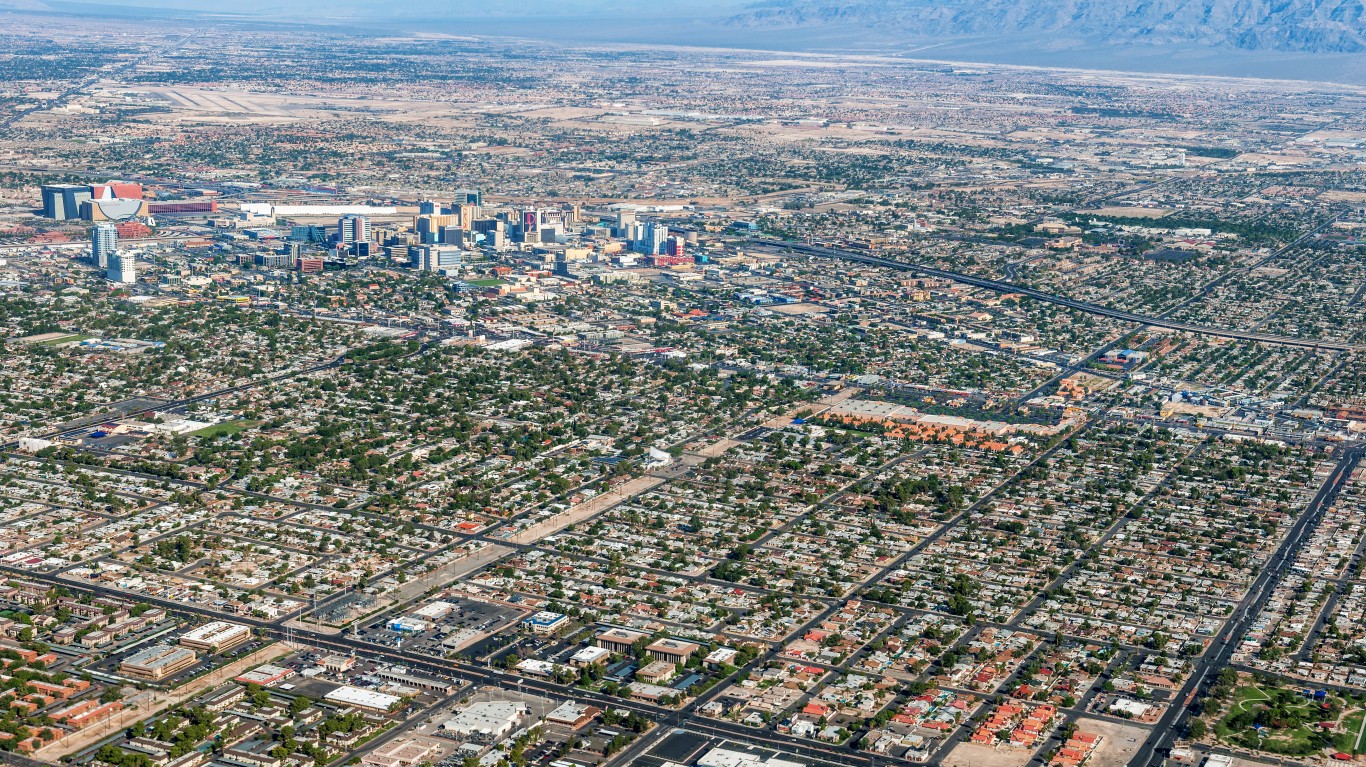
- Documented police killings, Jan. 2020 – Oct. 2024: 4.2 per 100,000 people (11 total)
- Gender of those killed: 90.9% male, 9.1% female
- Race/ethnicity of those killed: 36.4% White, 36.4% Black, 9.1% Hispanic, 0.0% Native American, 0.0% Asian
- Share of those killed with signs of a mental illness: 0.0%
- Share of those killed who were unarmed: 9.1%
- City population: 264,022
33. Colorado Springs, Colorado
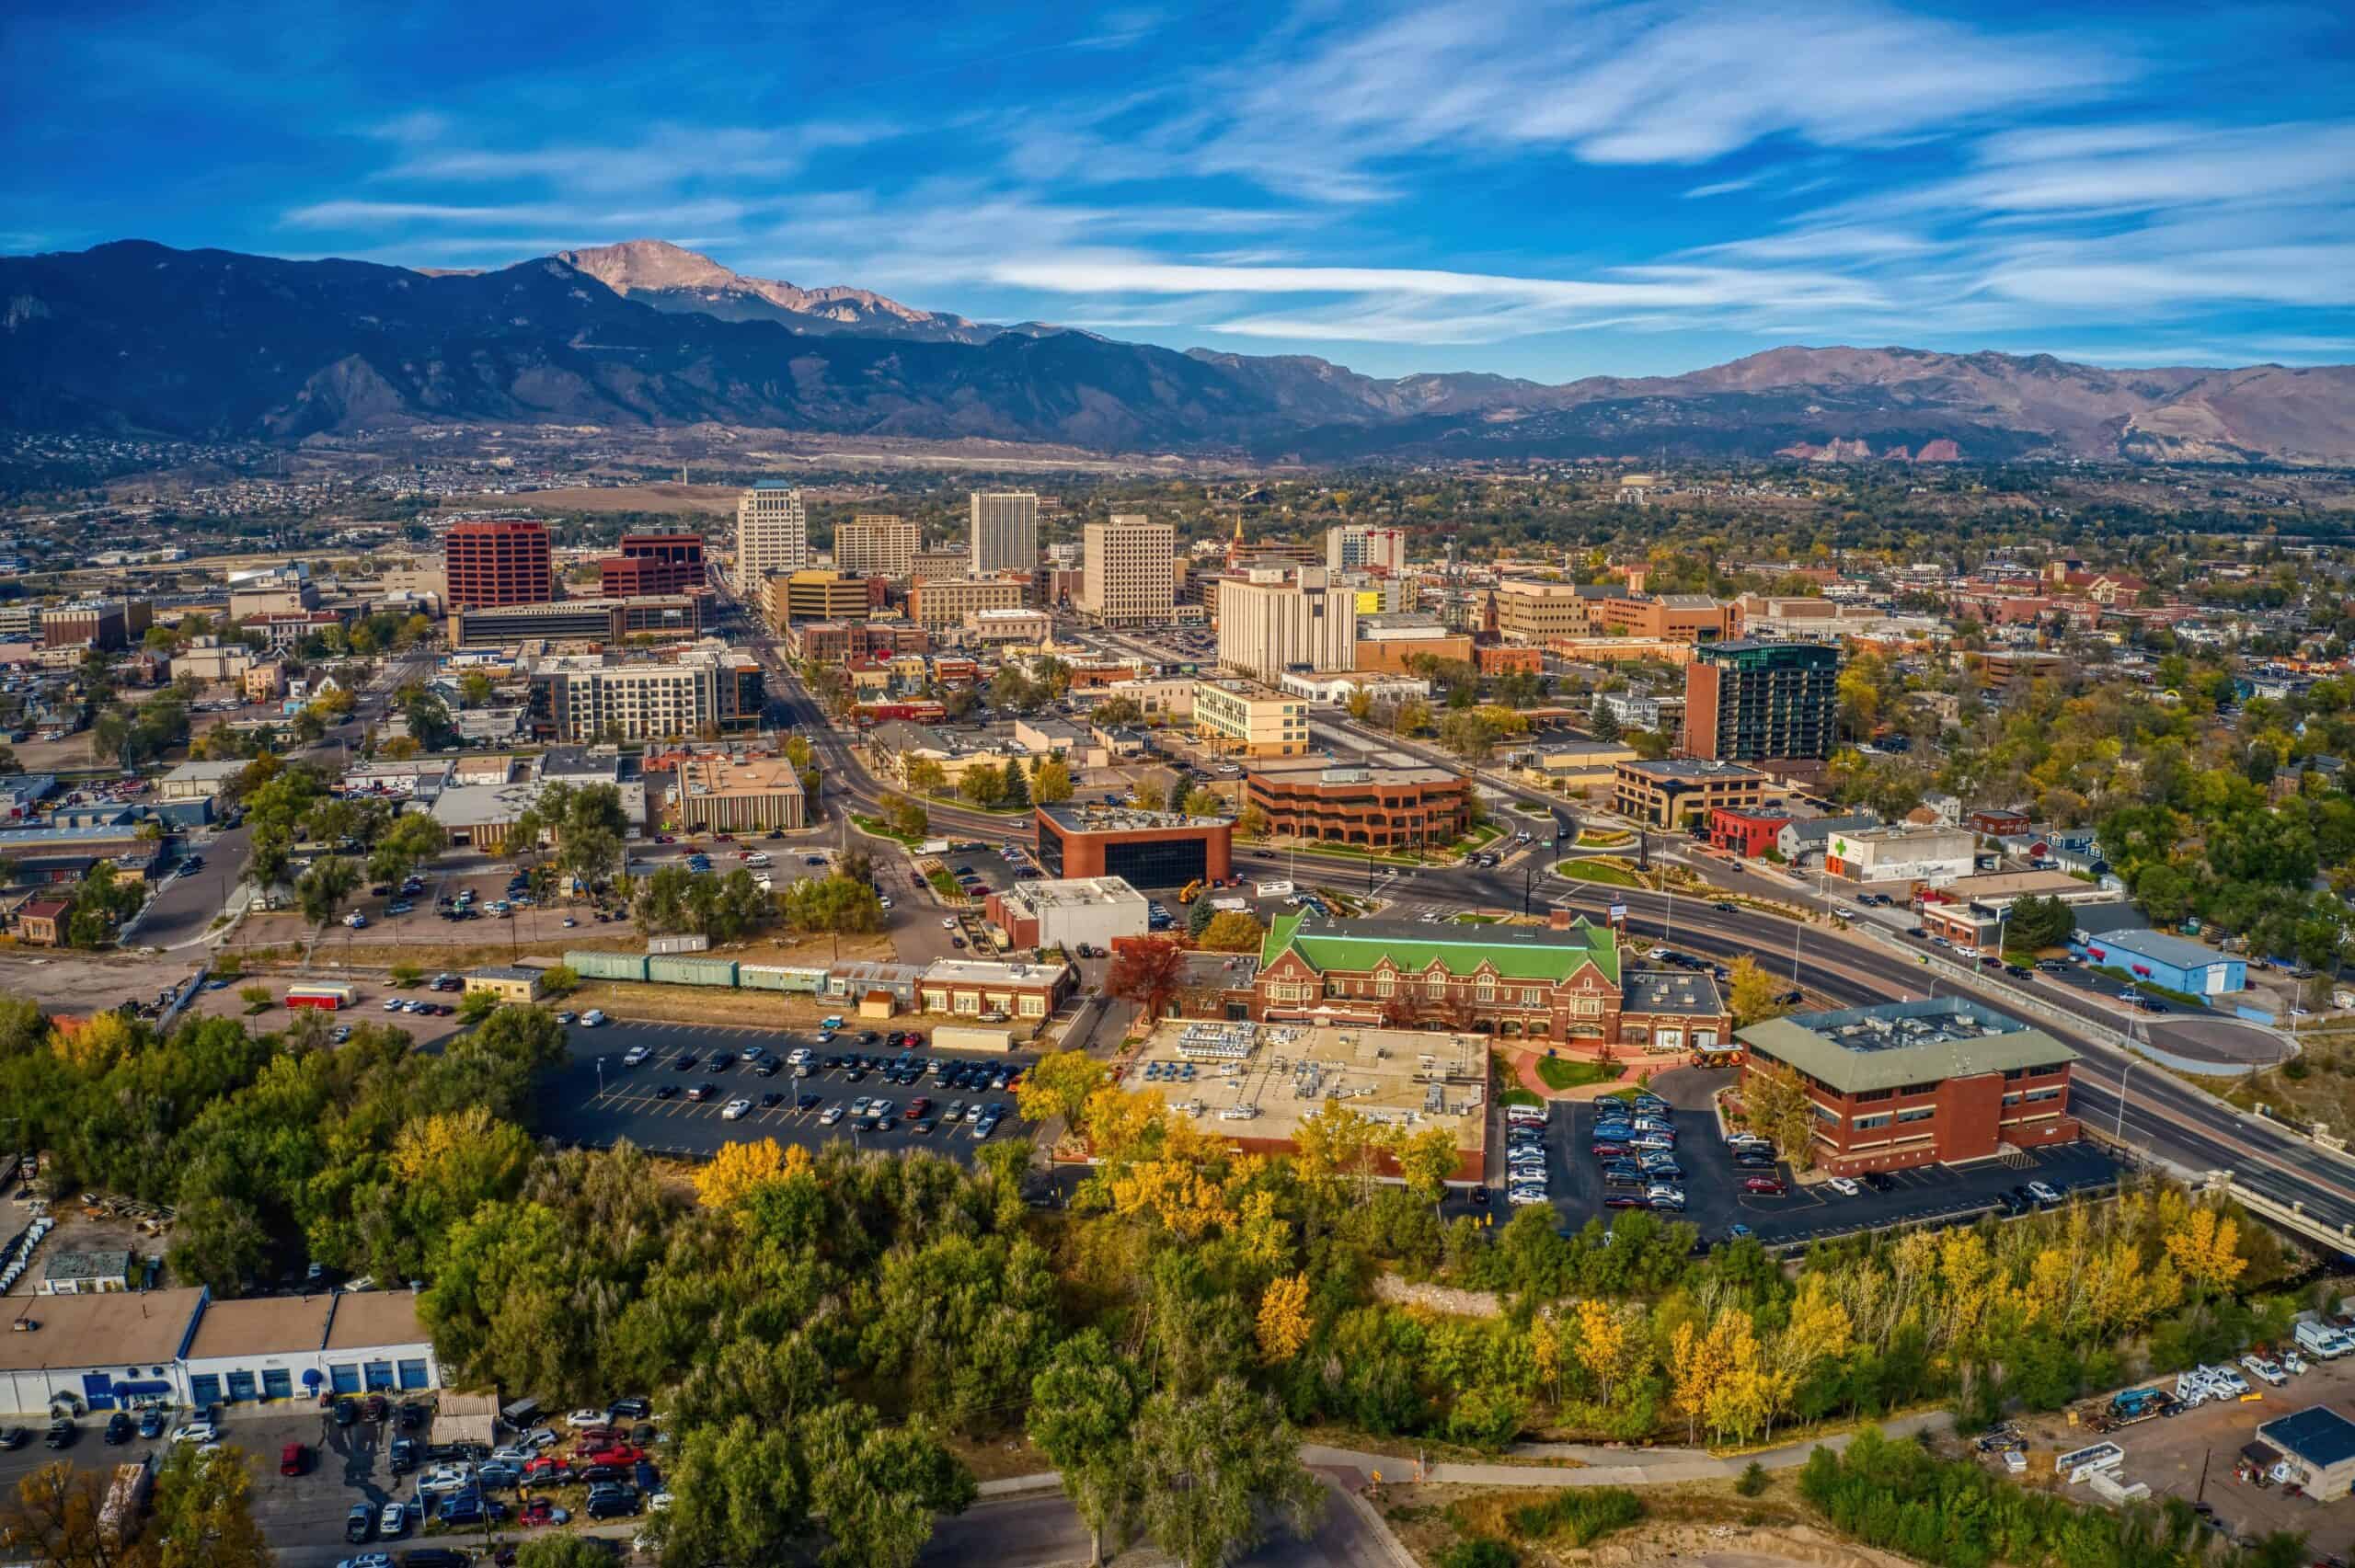
- Documented police killings, Jan. 2020 – Oct. 2024: 4.2 per 100,000 people (20 total)
- Gender of those killed: 100.0% male, 0.0% female
- Race/ethnicity of those killed: 45.0% White, 25.0% Black, 15.0% Hispanic, 0.0% Native American, 0.0% Asian
- Share of those killed with signs of a mental illness: 25.0%
- Share of those killed who were unarmed: 15.0%
- City population: 479,612
32. Mesa, Arizona
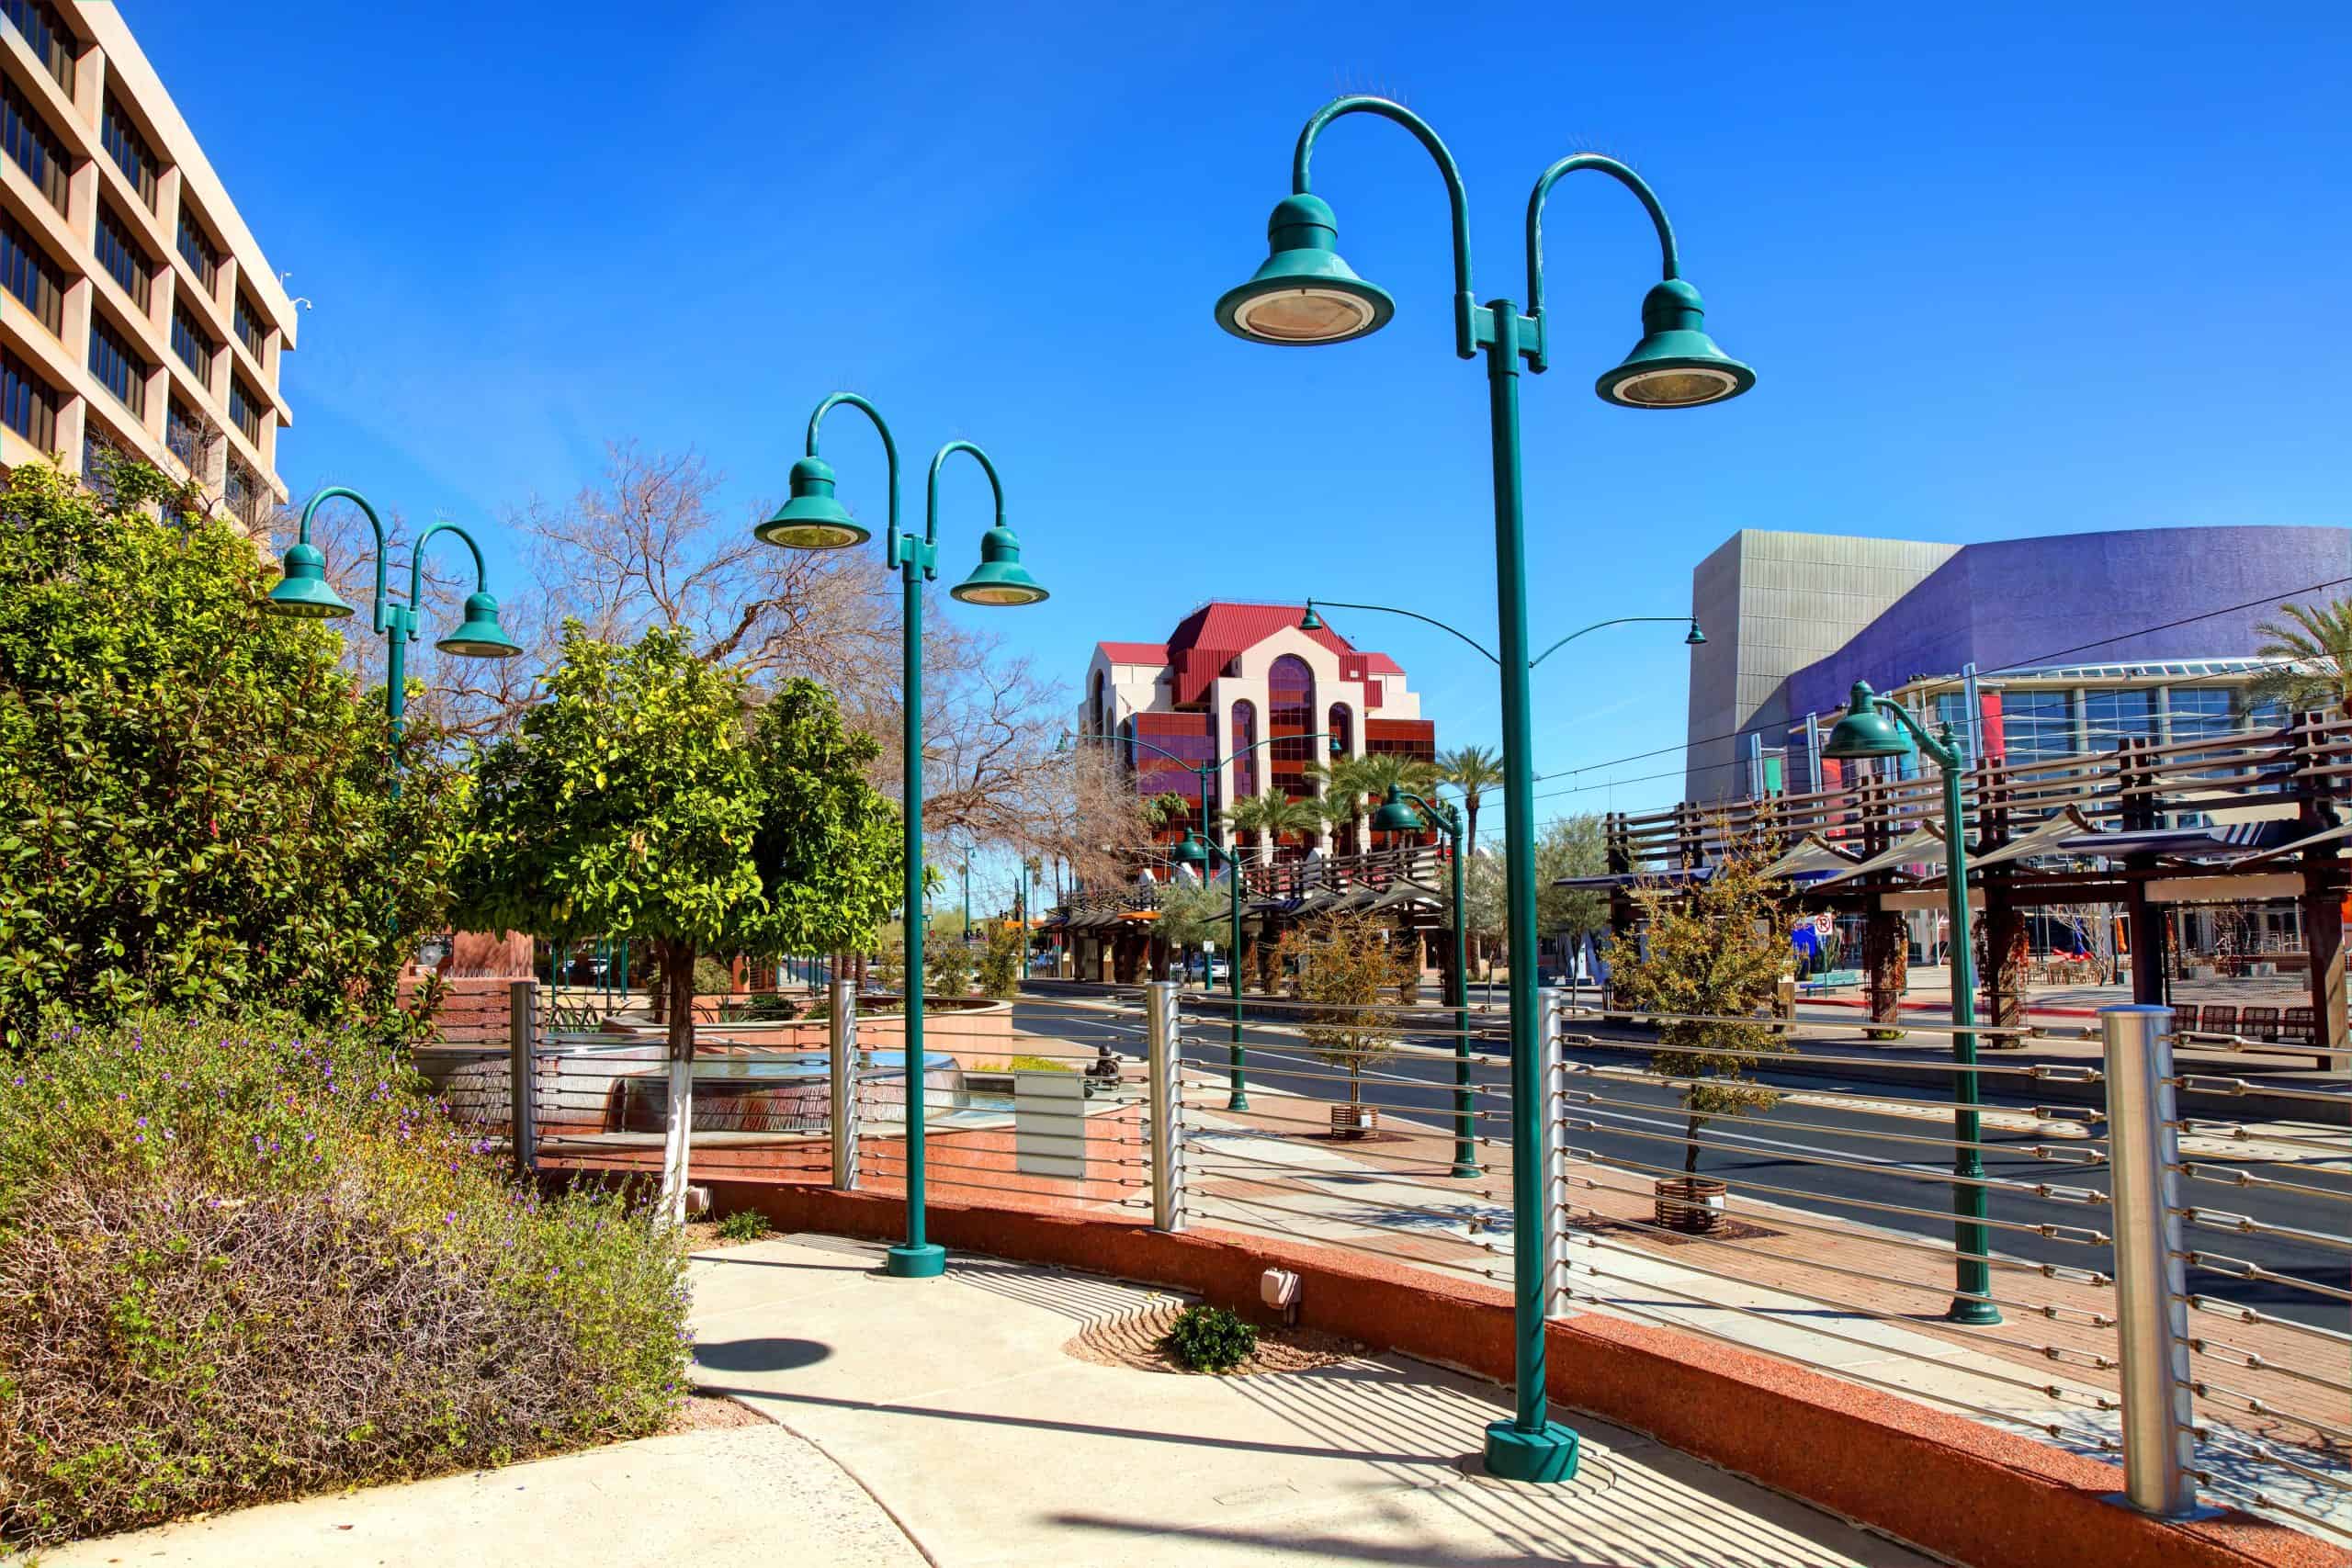
- Documented police killings, Jan. 2020 – Oct. 2024: 4.2 per 100,000 people (21 total)
- Gender of those killed: 90.5% male, 9.5% female
- Race/ethnicity of those killed: 33.3% White, 4.8% Black, 28.6% Hispanic, 0.0% Native American, 0.0% Asian
- Share of those killed with signs of a mental illness: 14.3%
- Share of those killed who were unarmed: 23.8%
- City population: 503,390
31. Lubbock, Texas
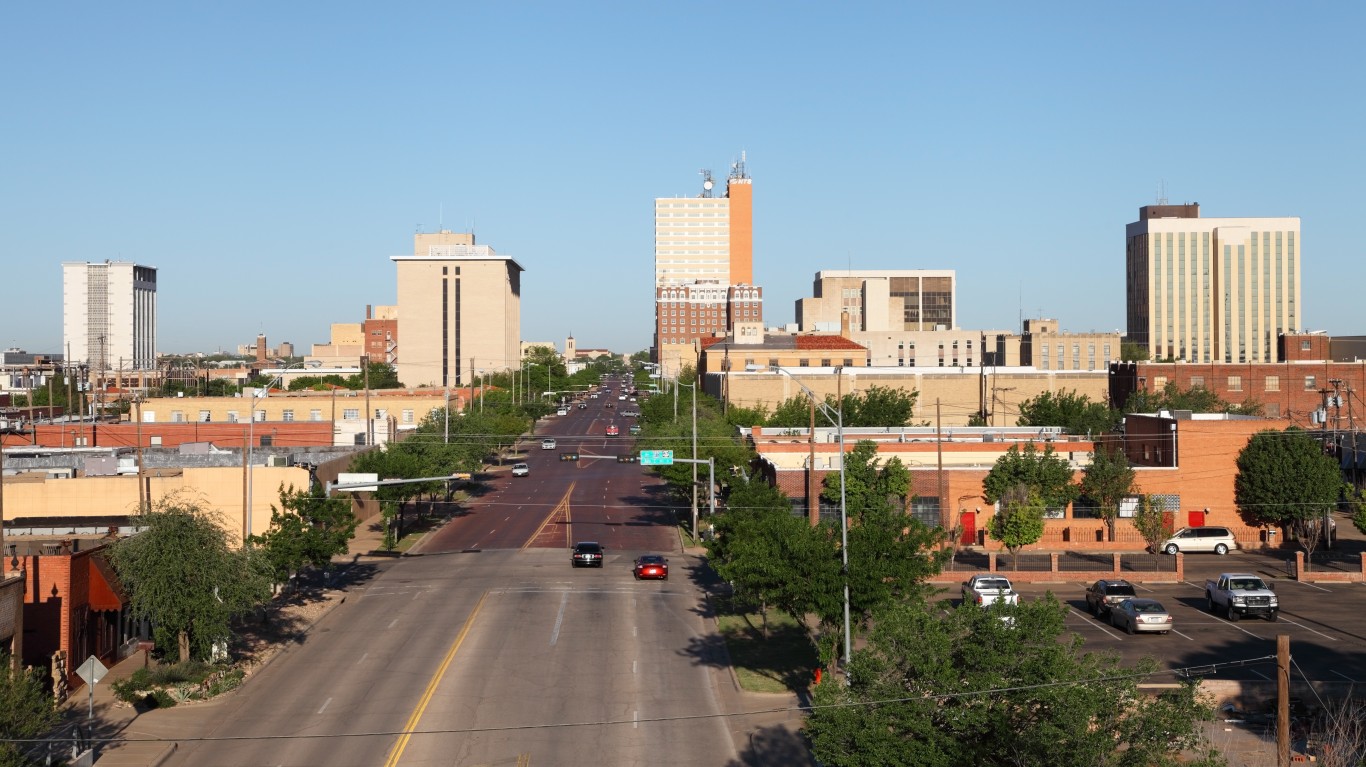
- Documented police killings, Jan. 2020 – Oct. 2024: 4.3 per 100,000 people (11 total)
- Gender of those killed: 90.9% male, 9.1% female
- Race/ethnicity of those killed: 27.3% White, 9.1% Black, 54.5% Hispanic, 0.0% Native American, 0.0% Asian
- Share of those killed with signs of a mental illness: 18.2%
- Share of those killed who were unarmed: 0.0%
- City population: 258,190
30. Aurora, Colorado
- Documented police killings, Jan. 2020 – Oct. 2024: 4.4 per 100,000 people (17 total)
- Gender of those killed: 94.1% male, 5.9% female
- Race/ethnicity of those killed: 23.5% White, 35.3% Black, 29.4% Hispanic, 5.9% Native American, 0.0% Asian
- Share of those killed with signs of a mental illness: 11.8%
- Share of those killed who were unarmed: 23.5%
- City population: 387,349
29. San Antonio, Texas
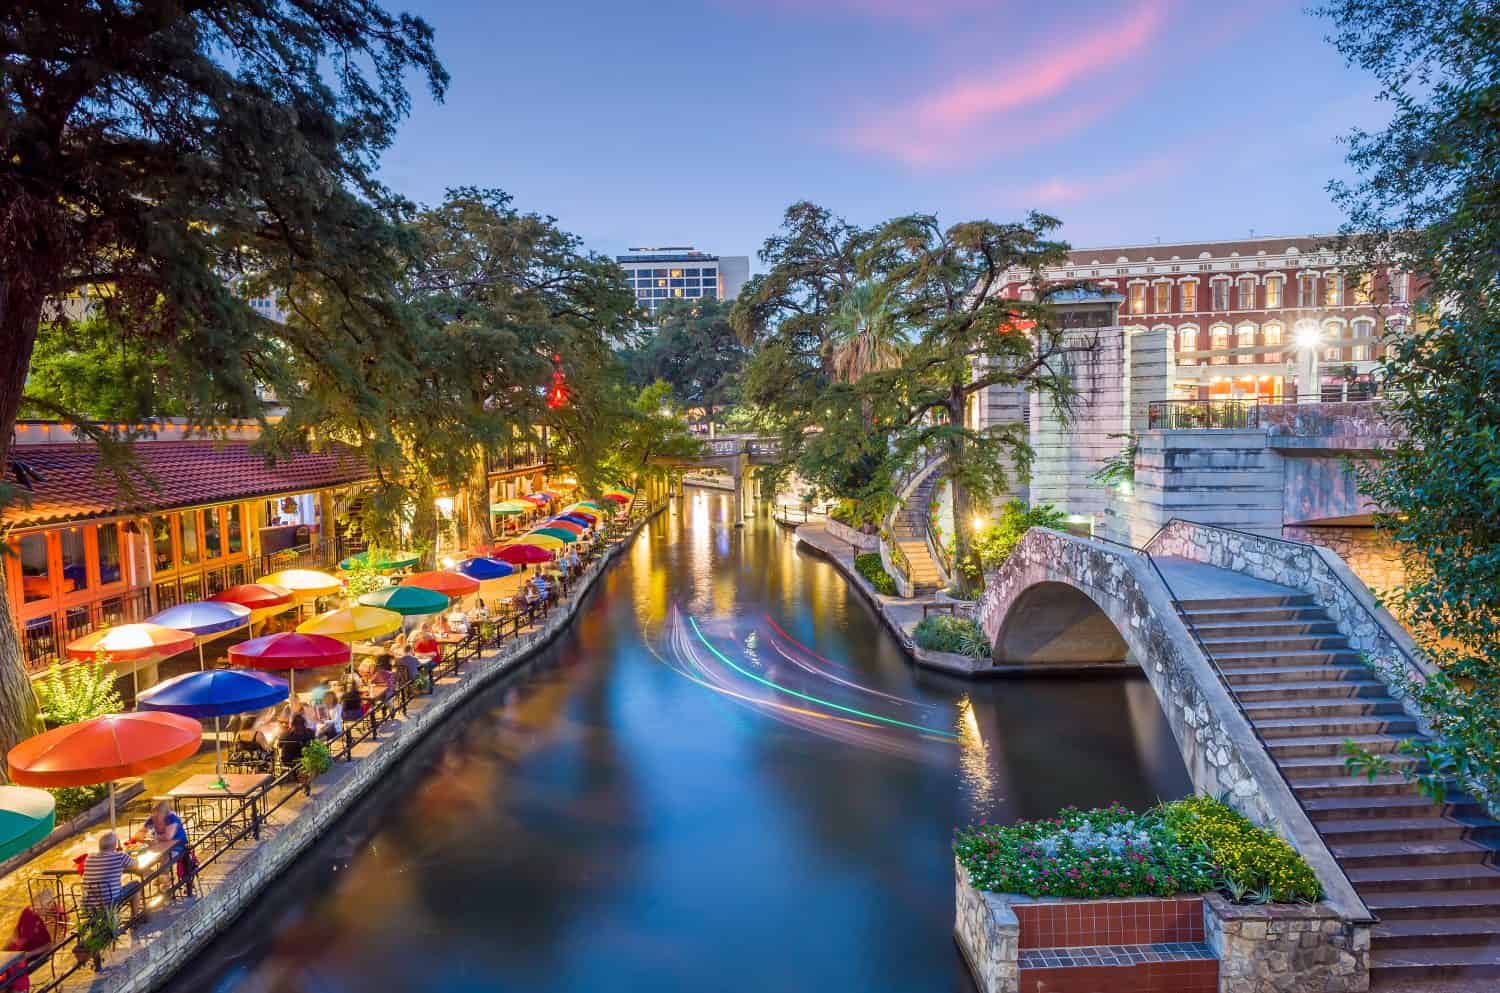
- Documented police killings, Jan. 2020 – Oct. 2024: 4.5 per 100,000 people (65 total)
- Gender of those killed: 93.8% male, 6.2% female
- Race/ethnicity of those killed: 13.8% White, 10.8% Black, 69.2% Hispanic, 0.0% Native American, 3.1% Asian
- Share of those killed with signs of a mental illness: 10.8%
- Share of those killed who were unarmed: 12.3%
- City population: 1,445,662
28. Boise, Idaho

- Documented police killings, Jan. 2020 – Oct. 2024: 4.7 per 100,000 people (11 total)
- Gender of those killed: 100.0% male, 0.0% female
- Race/ethnicity of those killed: 63.6% White, 0.0% Black, 9.1% Hispanic, 0.0% Native American, 0.0% Asian
- Share of those killed with signs of a mental illness: 36.4%
- Share of those killed who were unarmed: 9.1%
- City population: 234,192
27. Fontana, California

- Documented police killings, Jan. 2020 – Oct. 2024: 4.8 per 100,000 people (10 total)
- Gender of those killed: 100.0% male, 0.0% female
- Race/ethnicity of those killed: 10.0% White, 20.0% Black, 50.0% Hispanic, 0.0% Native American, 0.0% Asian
- Share of those killed with signs of a mental illness: 20.0%
- Share of those killed who were unarmed: 30.0%
- City population: 209,279
26. Fayetteville, North Carolina
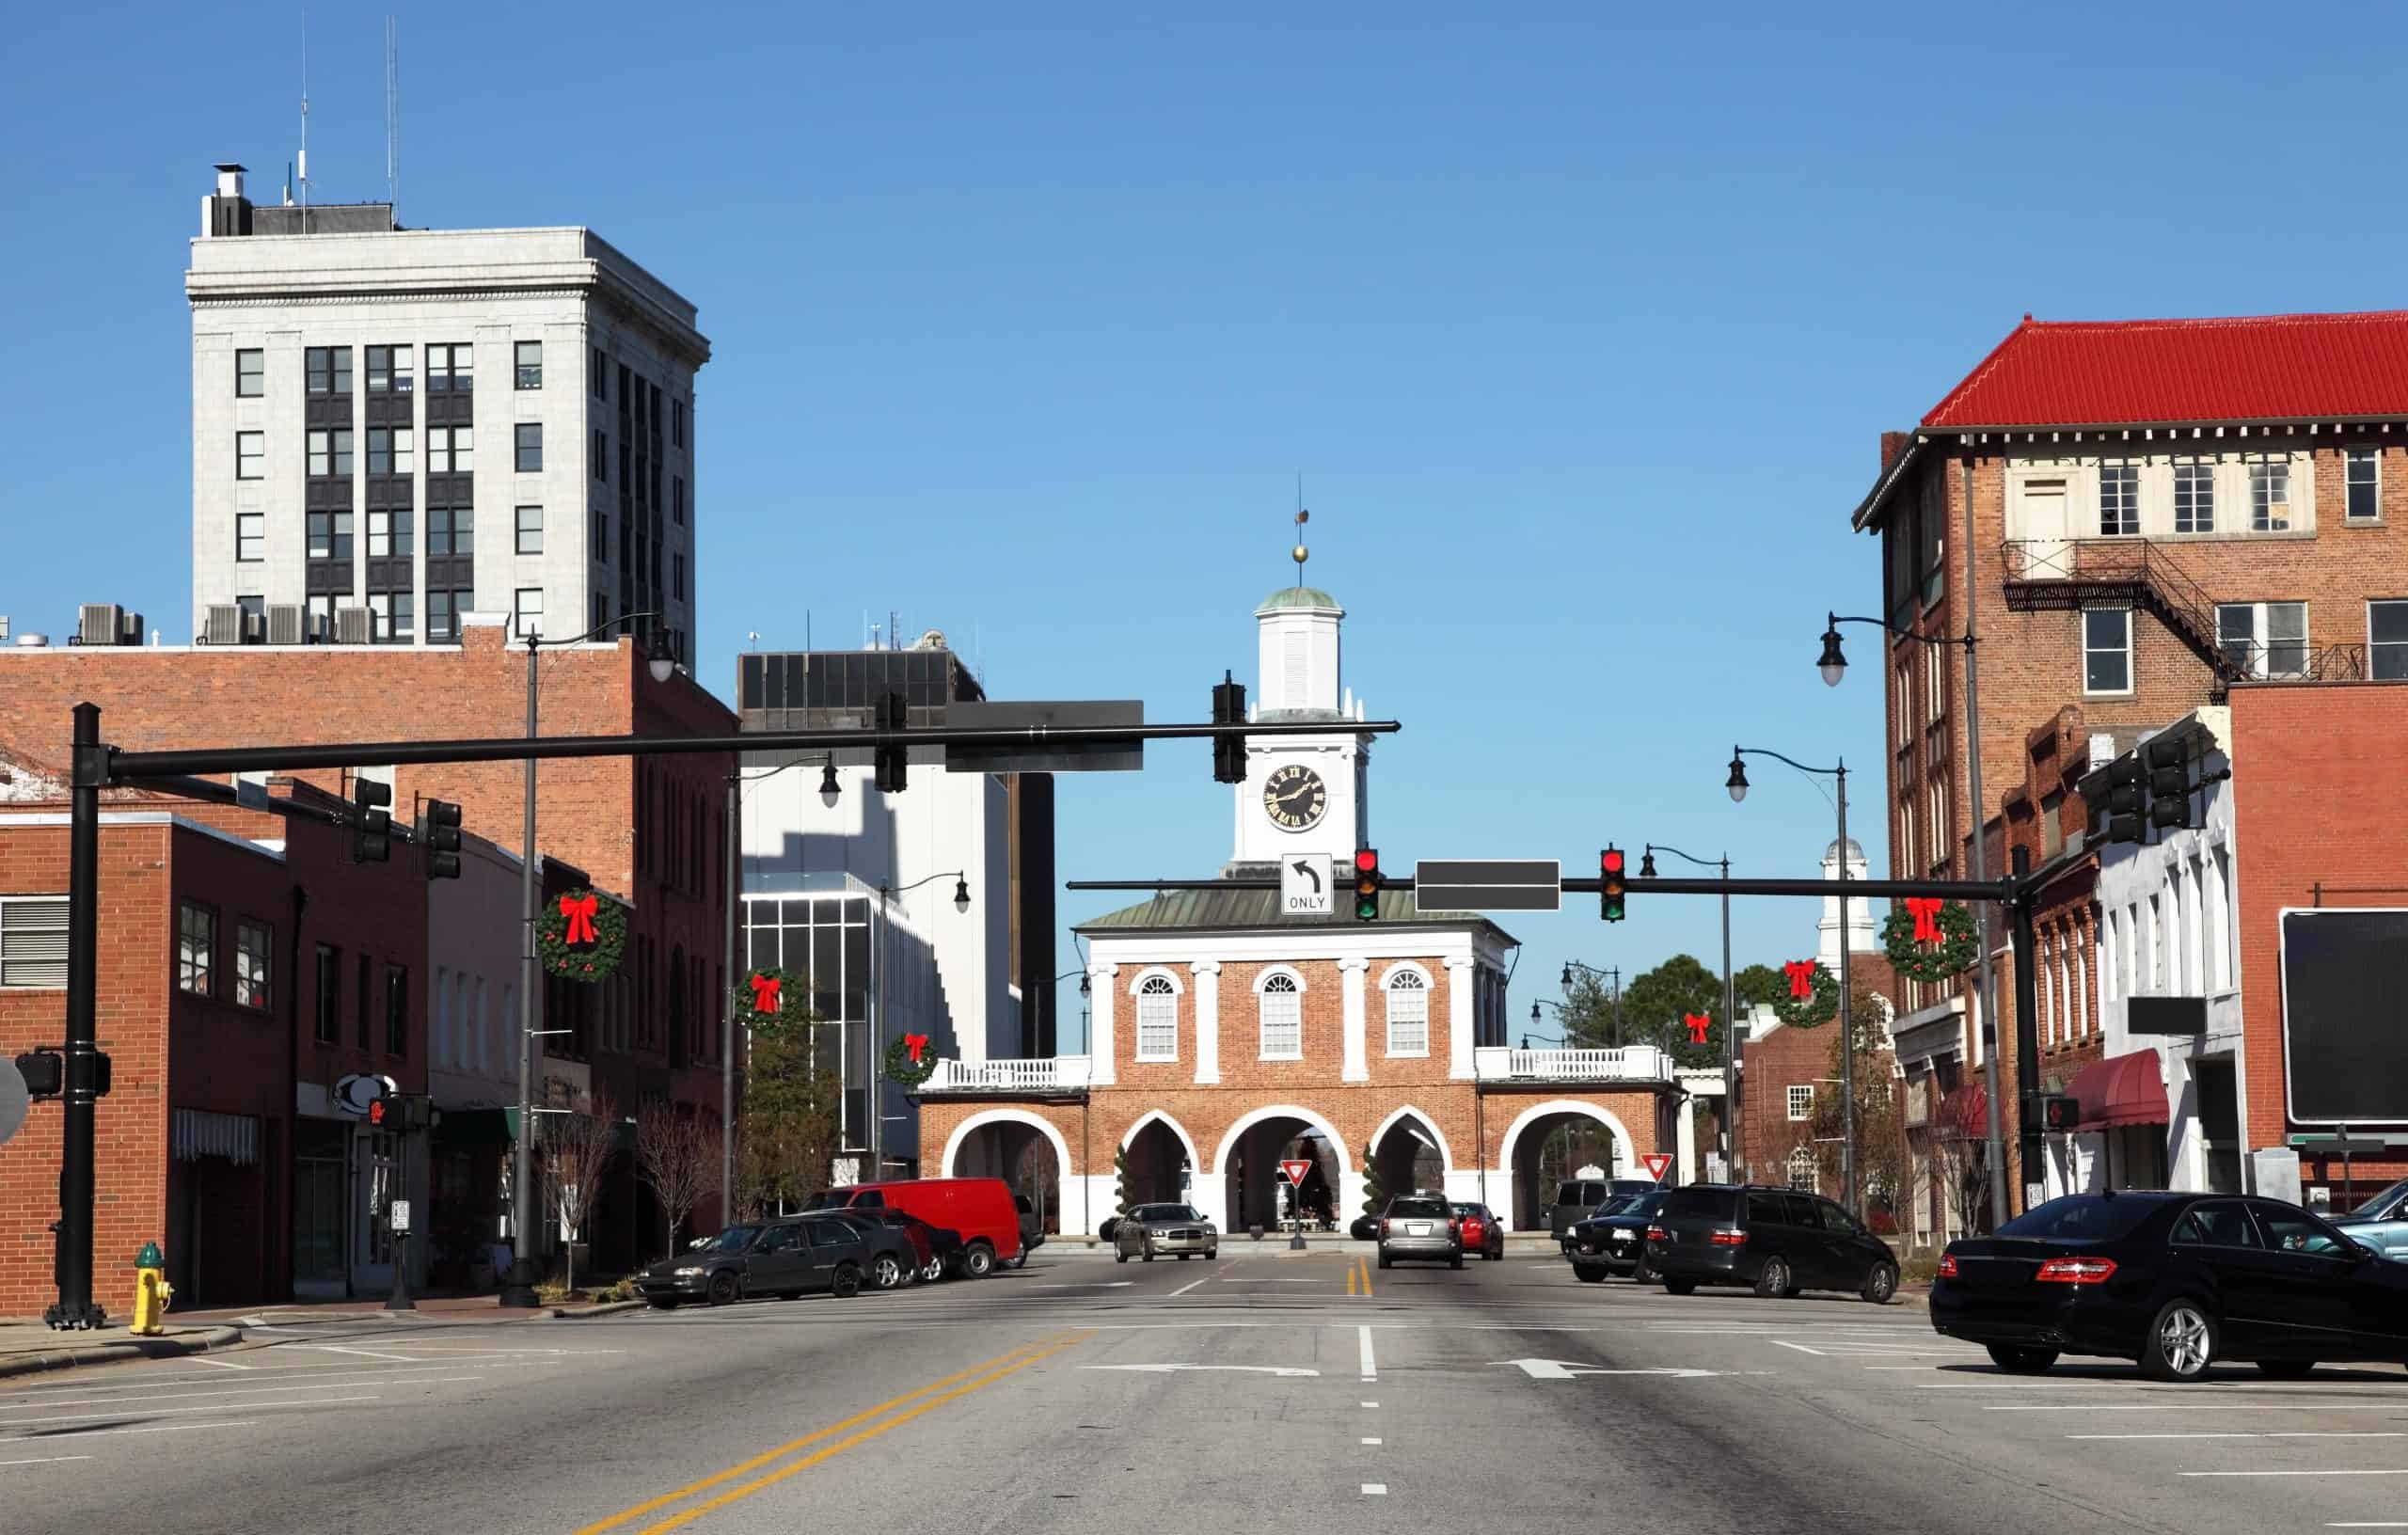
- Documented police killings, Jan. 2020 – Oct. 2024: 4.8 per 100,000 people (10 total)
- Gender of those killed: 70.0% male, 30.0% female
- Race/ethnicity of those killed: 40.0% White, 50.0% Black, 10.0% Hispanic, 0.0% Native American, 0.0% Asian
- Share of those killed with signs of a mental illness: 30.0%
- Share of those killed who were unarmed: 40.0%
- City population: 208,697
25. Little Rock, Arkansas

- Documented police killings, Jan. 2020 – Oct. 2024: 4.9 per 100,000 people (10 total)
- Gender of those killed: 100.0% male, 0.0% female
- Race/ethnicity of those killed: 40.0% White, 60.0% Black, 0.0% Hispanic, 0.0% Native American, 0.0% Asian
- Share of those killed with signs of a mental illness: 30.0%
- Share of those killed who were unarmed: 20.0%
- City population: 202,218
24. Tacoma, Washington
- Documented police killings, Jan. 2020 – Oct. 2024: 5.0 per 100,000 people (11 total)
- Gender of those killed: 90.9% male, 9.1% female
- Race/ethnicity of those killed: 45.5% White, 27.3% Black, 9.1% Hispanic, 0.0% Native American, 0.0% Asian
- Share of those killed with signs of a mental illness: 36.4%
- Share of those killed who were unarmed: 9.1%
- City population: 219,234
23. Tulsa, Oklahoma

- Documented police killings, Jan. 2020 – Oct. 2024: 5.1 per 100,000 people (21 total)
- Gender of those killed: 95.2% male, 4.8% female
- Race/ethnicity of those killed: 47.6% White, 14.3% Black, 28.6% Hispanic, 4.8% Native American, 0.0% Asian
- Share of those killed with signs of a mental illness: 28.6%
- Share of those killed who were unarmed: 4.8%
- City population: 411,938
22. Tucson, Arizona
- Documented police killings, Jan. 2020 – Oct. 2024: 5.2 per 100,000 people (28 total)
- Gender of those killed: 100.0% male, 0.0% female
- Race/ethnicity of those killed: 25.0% White, 21.4% Black, 39.3% Hispanic, 0.0% Native American, 0.0% Asian
- Share of those killed with signs of a mental illness: 21.4%
- Share of those killed who were unarmed: 7.1%
- City population: 541,033
21. St. Louis, Missouri

- Documented police killings, Jan. 2020 – Oct. 2024: 5.4 per 100,000 people (16 total)
- Gender of those killed: 87.5% male, 12.5% female
- Race/ethnicity of those killed: 12.5% White, 43.8% Black, 6.3% Hispanic, 0.0% Native American, 0.0% Asian
- Share of those killed with signs of a mental illness: 18.8%
- Share of those killed who were unarmed: 18.8%
- City population: 298,018
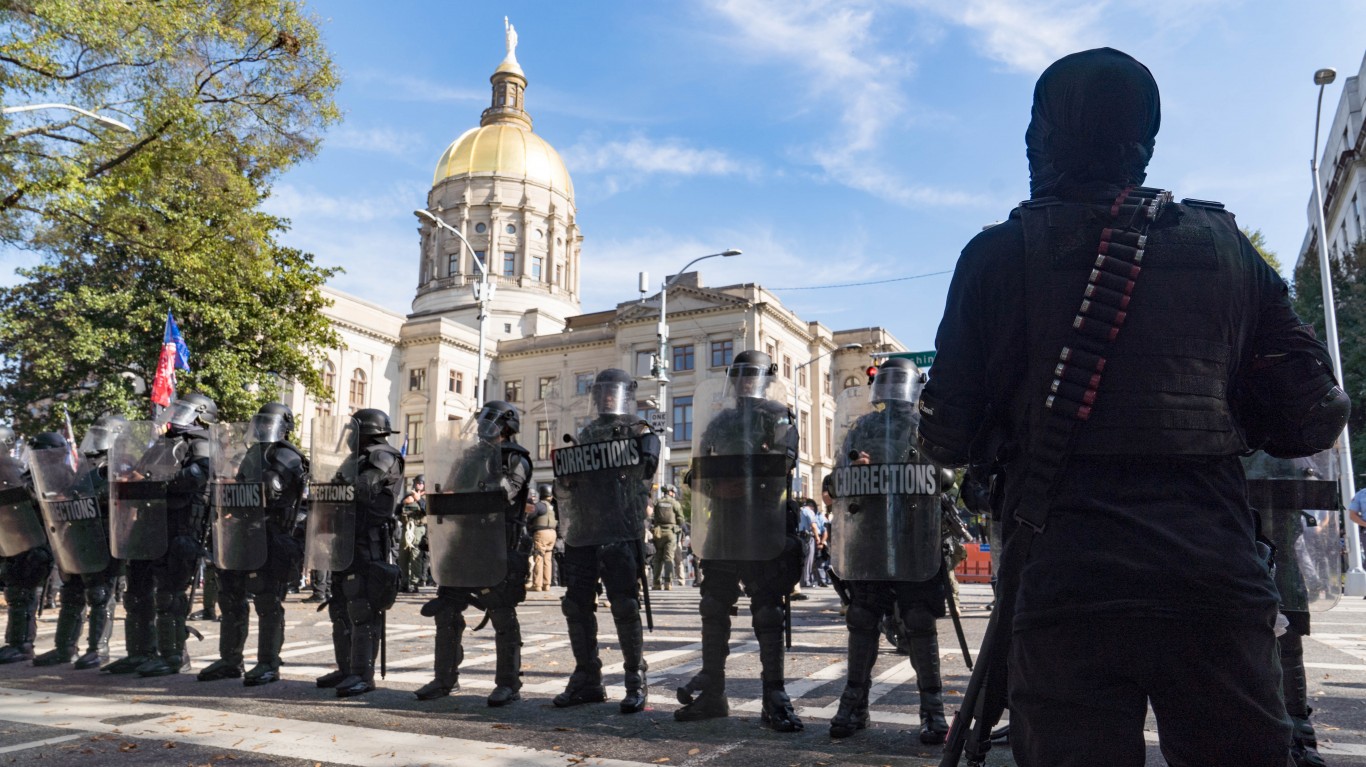
20. Atlanta, Georgia
- Documented police killings, Jan. 2020 – Oct. 2024: 5.7 per 100,000 people (28 total)
- Gender of those killed: 96.4% male, 0.0% female
- Race/ethnicity of those killed: 3.6% White, 82.1% Black, 7.1% Hispanic, 0.0% Native American, 0.0% Asian
- Share of those killed with signs of a mental illness: 3.6%
- Share of those killed who were unarmed: 21.4%
- City population: 494,838
19. Corpus Christi, Texas
- Documented police killings, Jan. 2020 – Oct. 2024: 5.7 per 100,000 people (18 total)
- Gender of those killed: 94.4% male, 5.6% female
- Race/ethnicity of those killed: 22.2% White, 16.7% Black, 44.4% Hispanic, 0.0% Native American, 5.6% Asian
- Share of those killed with signs of a mental illness: 5.6%
- Share of those killed who were unarmed: 11.1%
- City population: 317,804
18. Knoxville, Tennessee
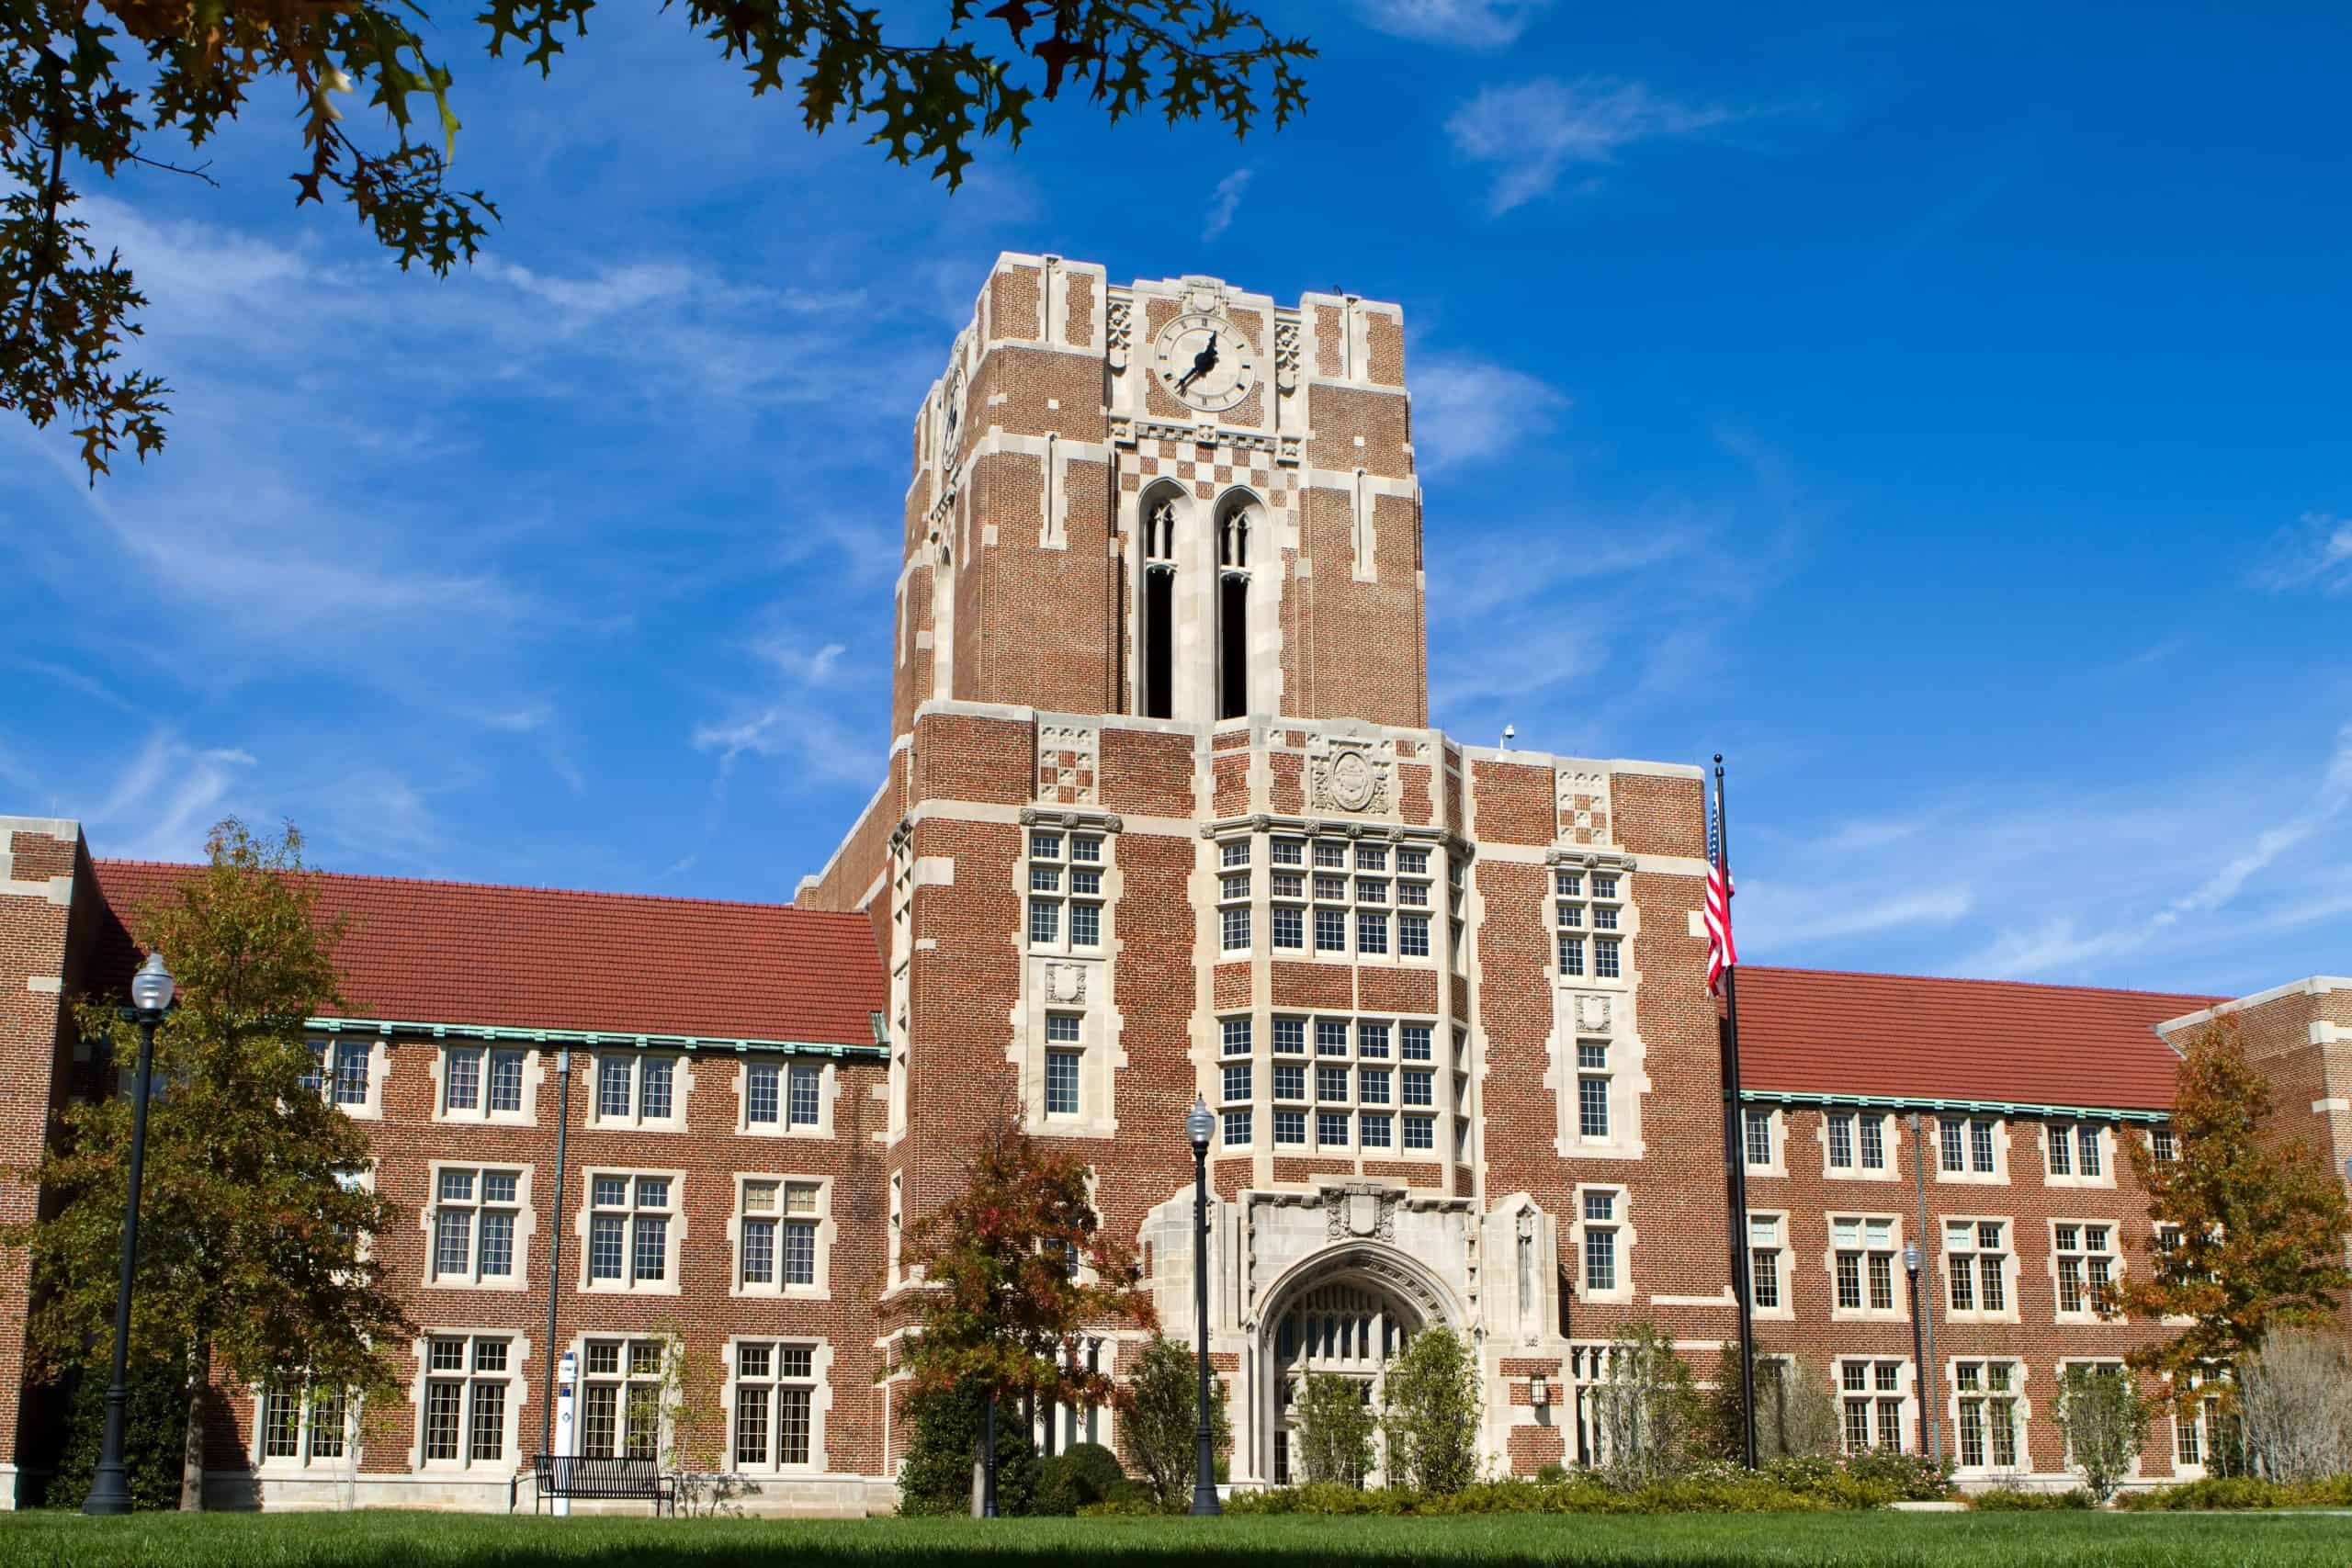
- Documented police killings, Jan. 2020 – Oct. 2024: 5.7 per 100,000 people (11 total)
- Gender of those killed: 90.9% male, 9.1% female
- Race/ethnicity of those killed: 36.4% White, 45.5% Black, 18.2% Hispanic, 0.0% Native American, 0.0% Asian
- Share of those killed with signs of a mental illness: 36.4%
- Share of those killed who were unarmed: 18.2%
- City population: 191,857
17. Miami, Florida

- Documented police killings, Jan. 2020 – Oct. 2024: 5.9 per 100,000 people (26 total)
- Gender of those killed: 92.3% male, 7.7% female
- Race/ethnicity of those killed: 11.5% White, 23.1% Black, 50.0% Hispanic, 0.0% Native American, 0.0% Asian
- Share of those killed with signs of a mental illness: 19.2%
- Share of those killed who were unarmed: 15.4%
- City population: 443,665
16. Shreveport, Louisiana

- Documented police killings, Jan. 2020 – Oct. 2024: 6.4 per 100,000 people (12 total)
- Gender of those killed: 100.0% male, 0.0% female
- Race/ethnicity of those killed: 25.0% White, 58.3% Black, 8.3% Hispanic, 0.0% Native American, 0.0% Asian
- Share of those killed with signs of a mental illness: 8.3%
- Share of those killed who were unarmed: 33.3%
- City population: 186,183
15. Orlando, Florida
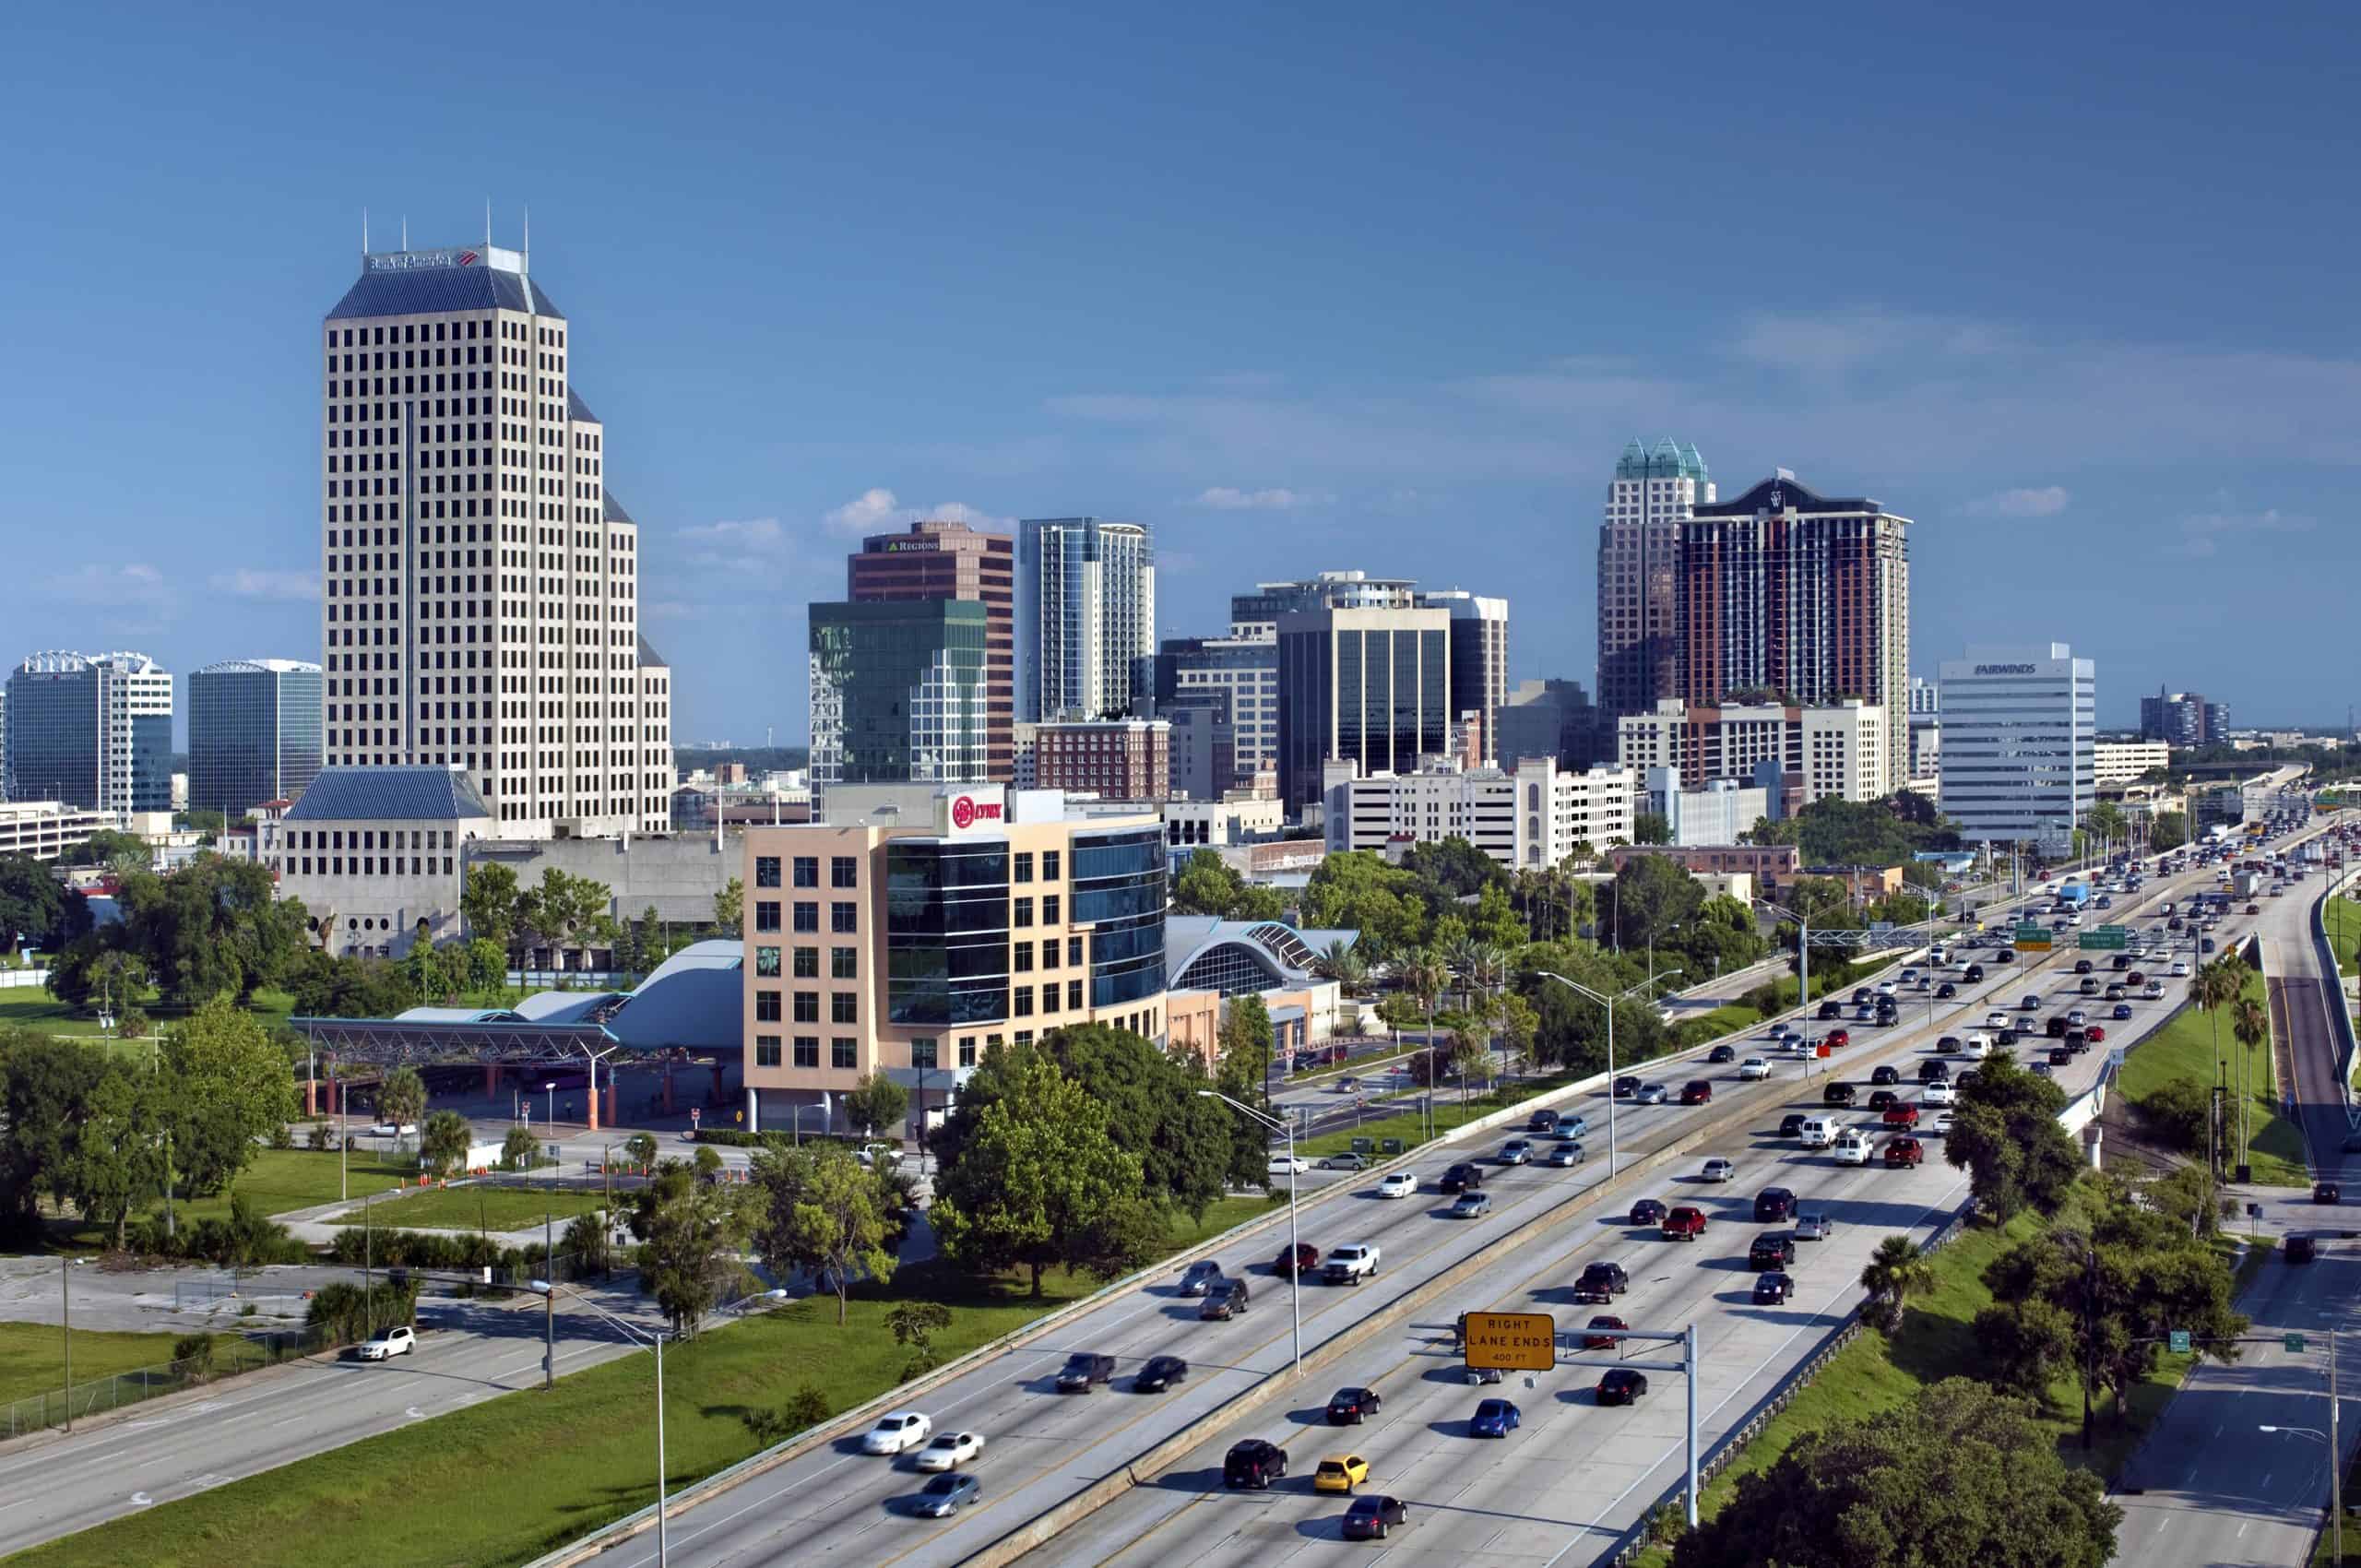
- Documented police killings, Jan. 2020 – Oct. 2024: 6.5 per 100,000 people (20 total)
- Gender of those killed: 90.0% male, 10.0% female
- Race/ethnicity of those killed: 30.0% White, 45.0% Black, 10.0% Hispanic, 0.0% Native American, 0.0% Asian
- Share of those killed with signs of a mental illness: 30.0%
- Share of those killed who were unarmed: 15.0%
- City population: 307,738
14. Spokane, Washington

- Documented police killings, Jan. 2020 – Oct. 2024: 6.6 per 100,000 people (15 total)
- Gender of those killed: 93.3% male, 6.7% female
- Race/ethnicity of those killed: 66.7% White, 6.7% Black, 6.7% Hispanic, 0.0% Native American, 0.0% Asian
- Share of those killed with signs of a mental illness: 13.3%
- Share of those killed who were unarmed: 6.7%
- City population: 227,922
13. Bakersfield, California

- Documented police killings, Jan. 2020 – Oct. 2024: 6.7 per 100,000 people (27 total)
- Gender of those killed: 100.0% male, 0.0% female
- Race/ethnicity of those killed: 11.1% White, 0.0% Black, 74.1% Hispanic, 0.0% Native American, 3.7% Asian
- Share of those killed with signs of a mental illness: 14.8%
- Share of those killed who were unarmed: 22.2%
- City population: 404,321
12. Salem, Oregon
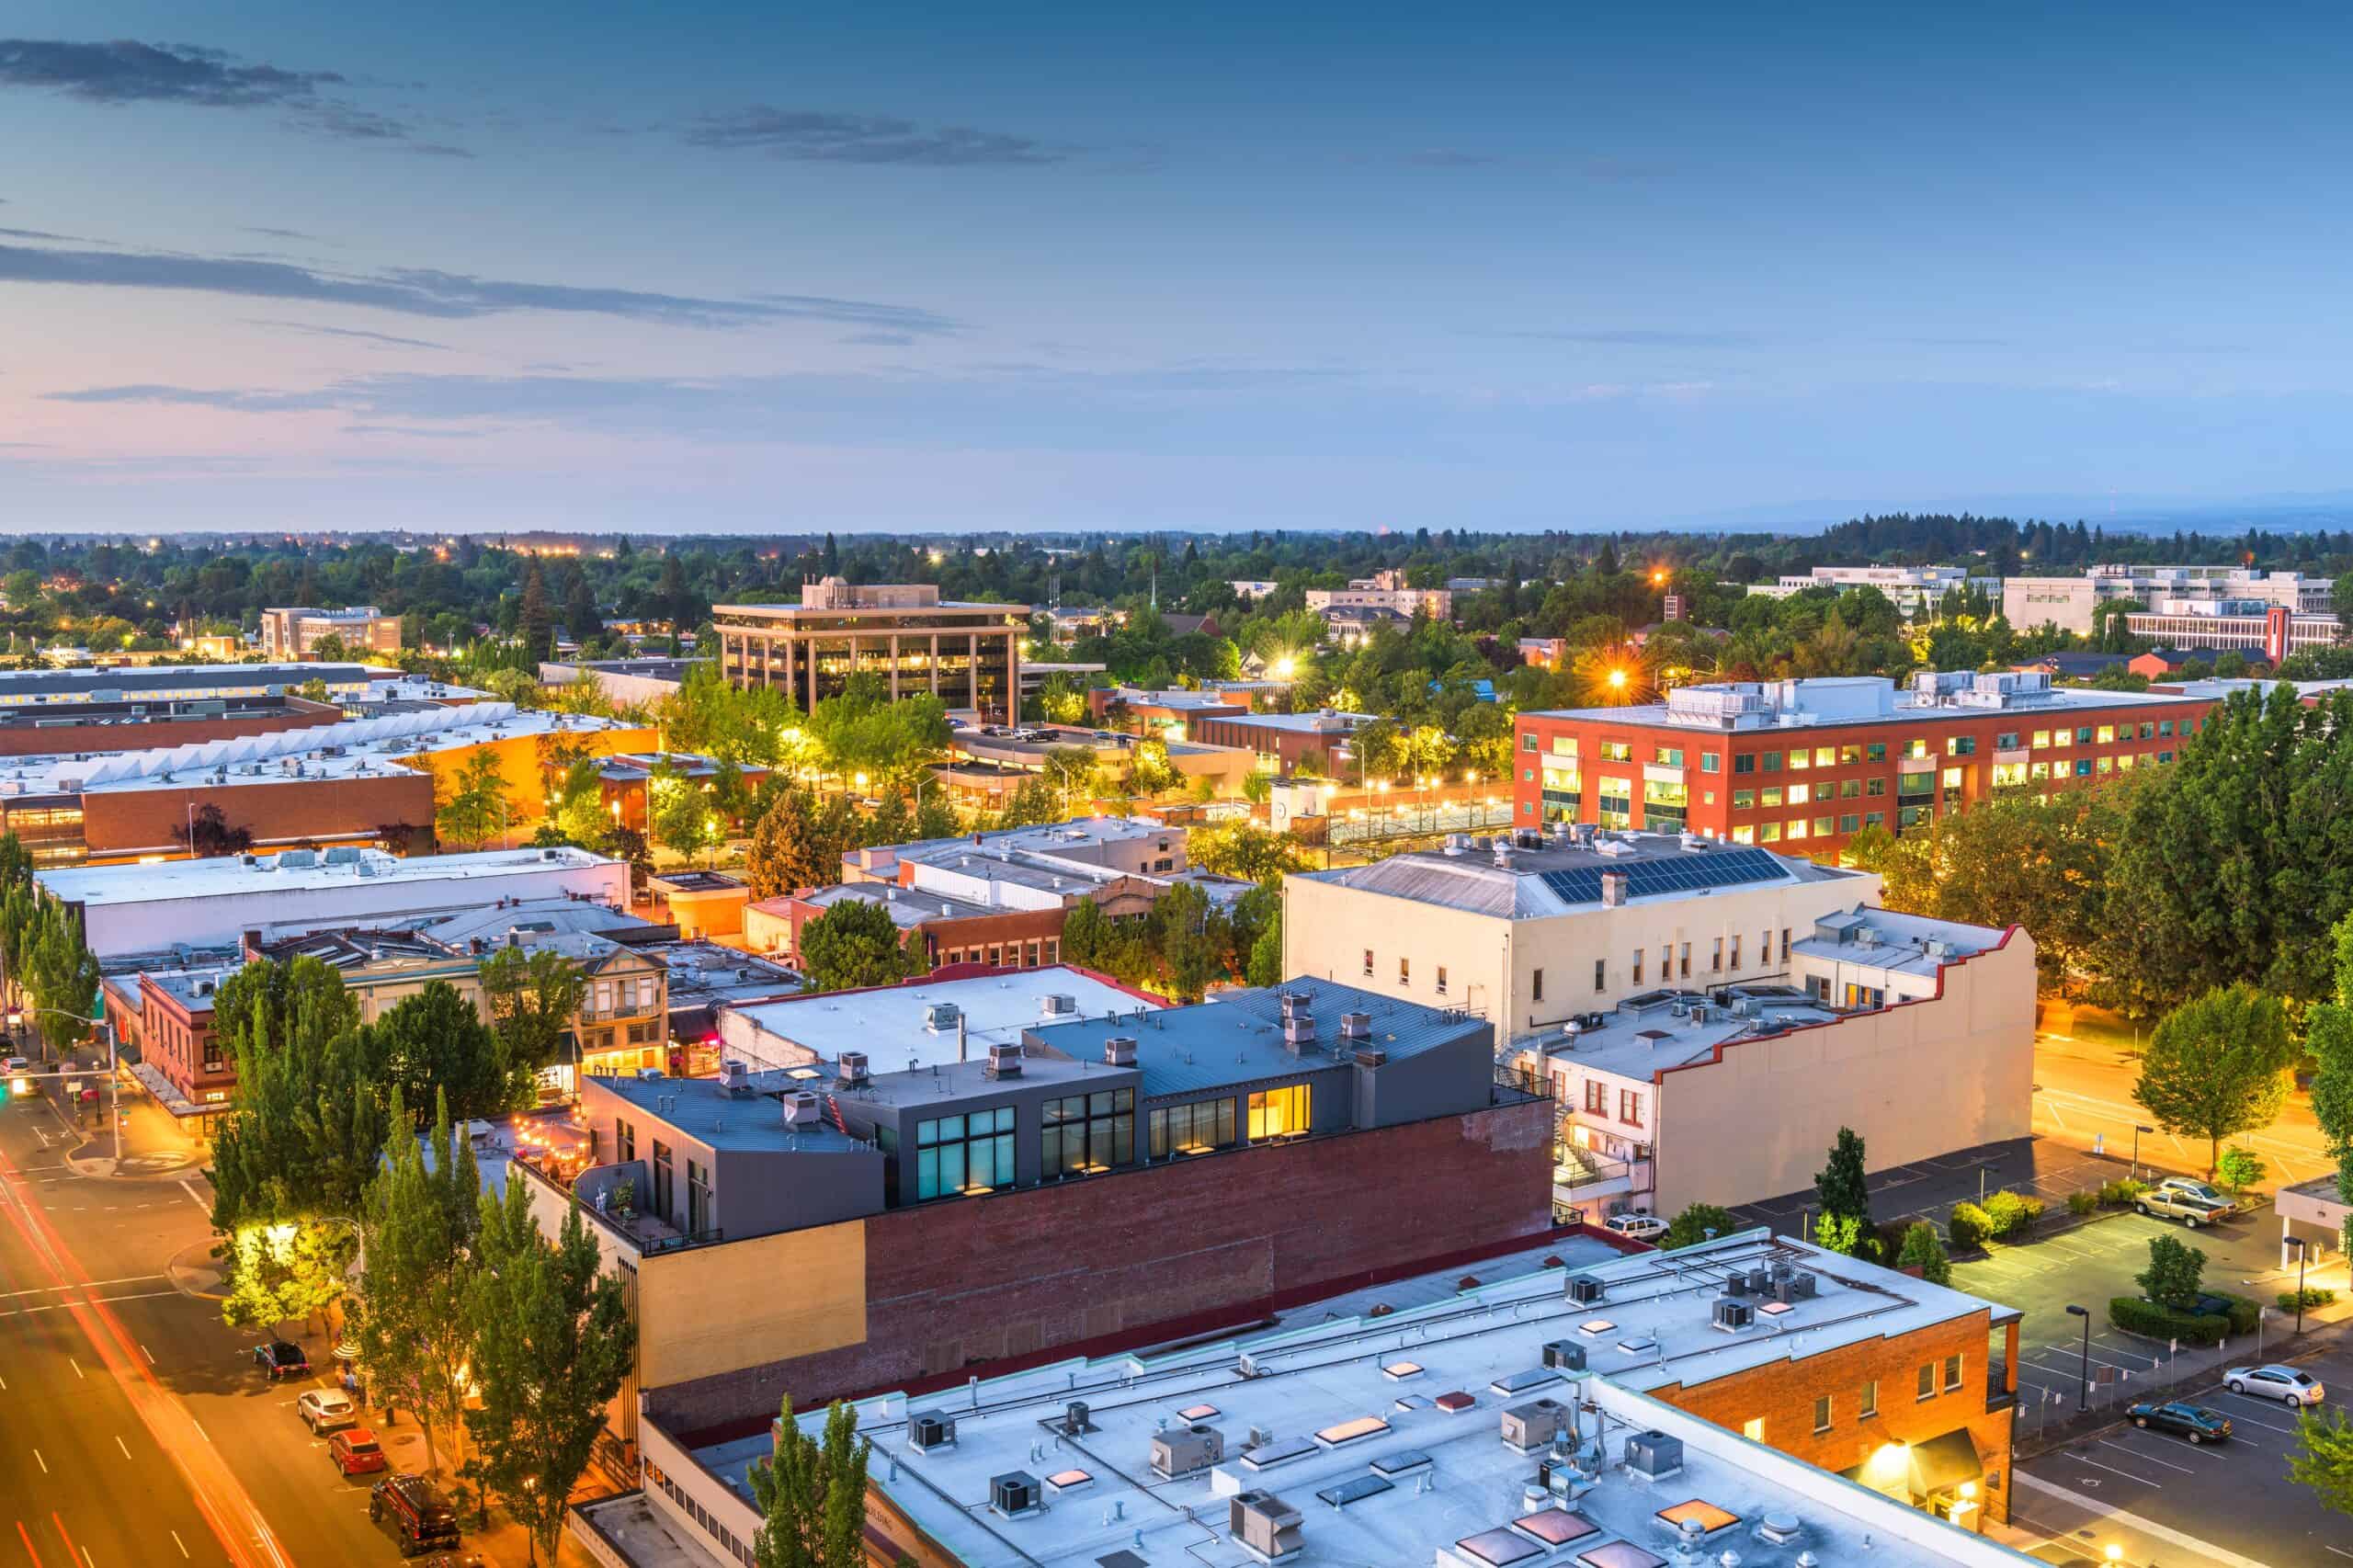
- Documented police killings, Jan. 2020 – Oct. 2024: 6.8 per 100,000 people (12 total)
- Gender of those killed: 91.7% male, 8.3% female
- Race/ethnicity of those killed: 58.3% White, 0.0% Black, 41.7% Hispanic, 0.0% Native American, 0.0% Asian
- Share of those killed with signs of a mental illness: 33.3%
- Share of those killed who were unarmed: 8.3%
- City population: 175,754
11. Las Vegas, Nevada
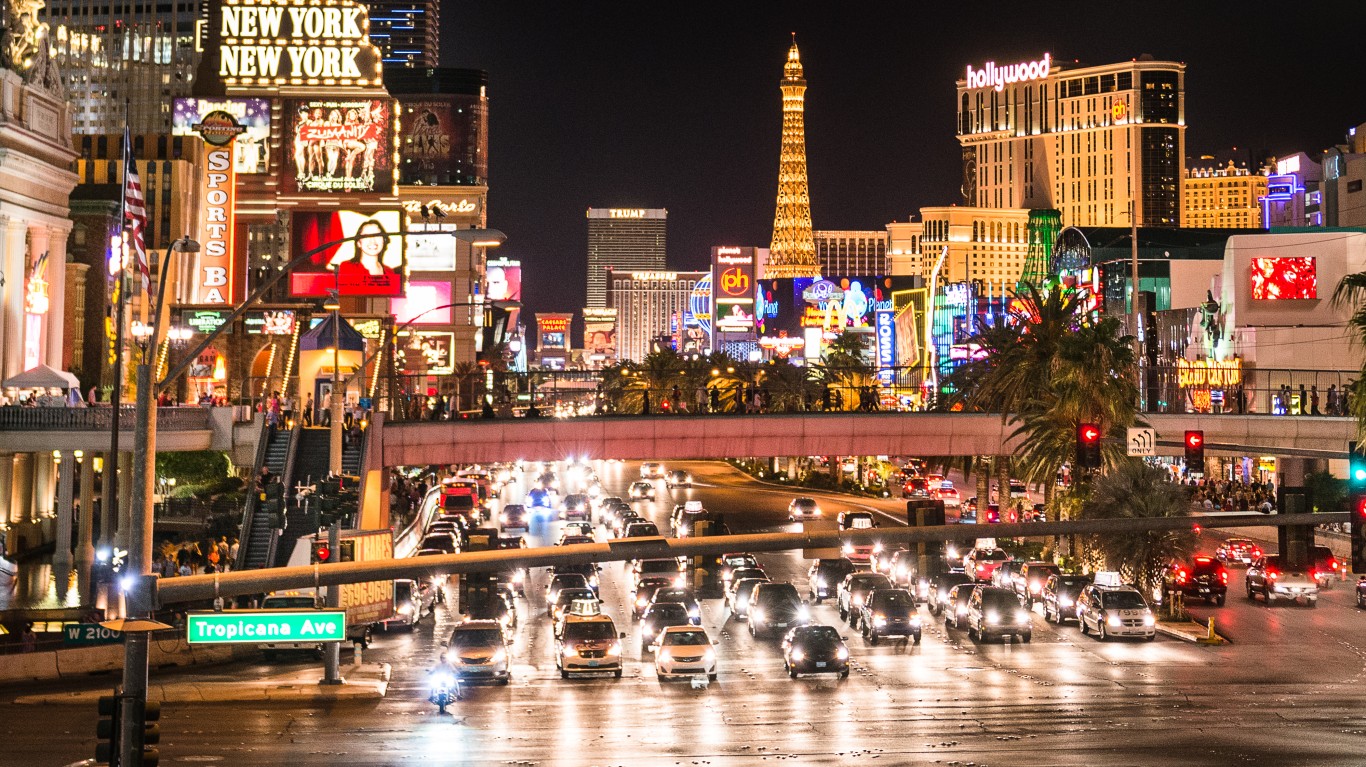
- Documented police killings, Jan. 2020 – Oct. 2024: 7.0 per 100,000 people (45 total)
- Gender of those killed: 95.6% male, 4.4% female
- Race/ethnicity of those killed: 44.4% White, 20.0% Black, 28.9% Hispanic, 0.0% Native American, 0.0% Asian
- Share of those killed with signs of a mental illness: 22.2%
- Share of those killed who were unarmed: 11.1%
- City population: 644,835
10. Jackson, Mississippi
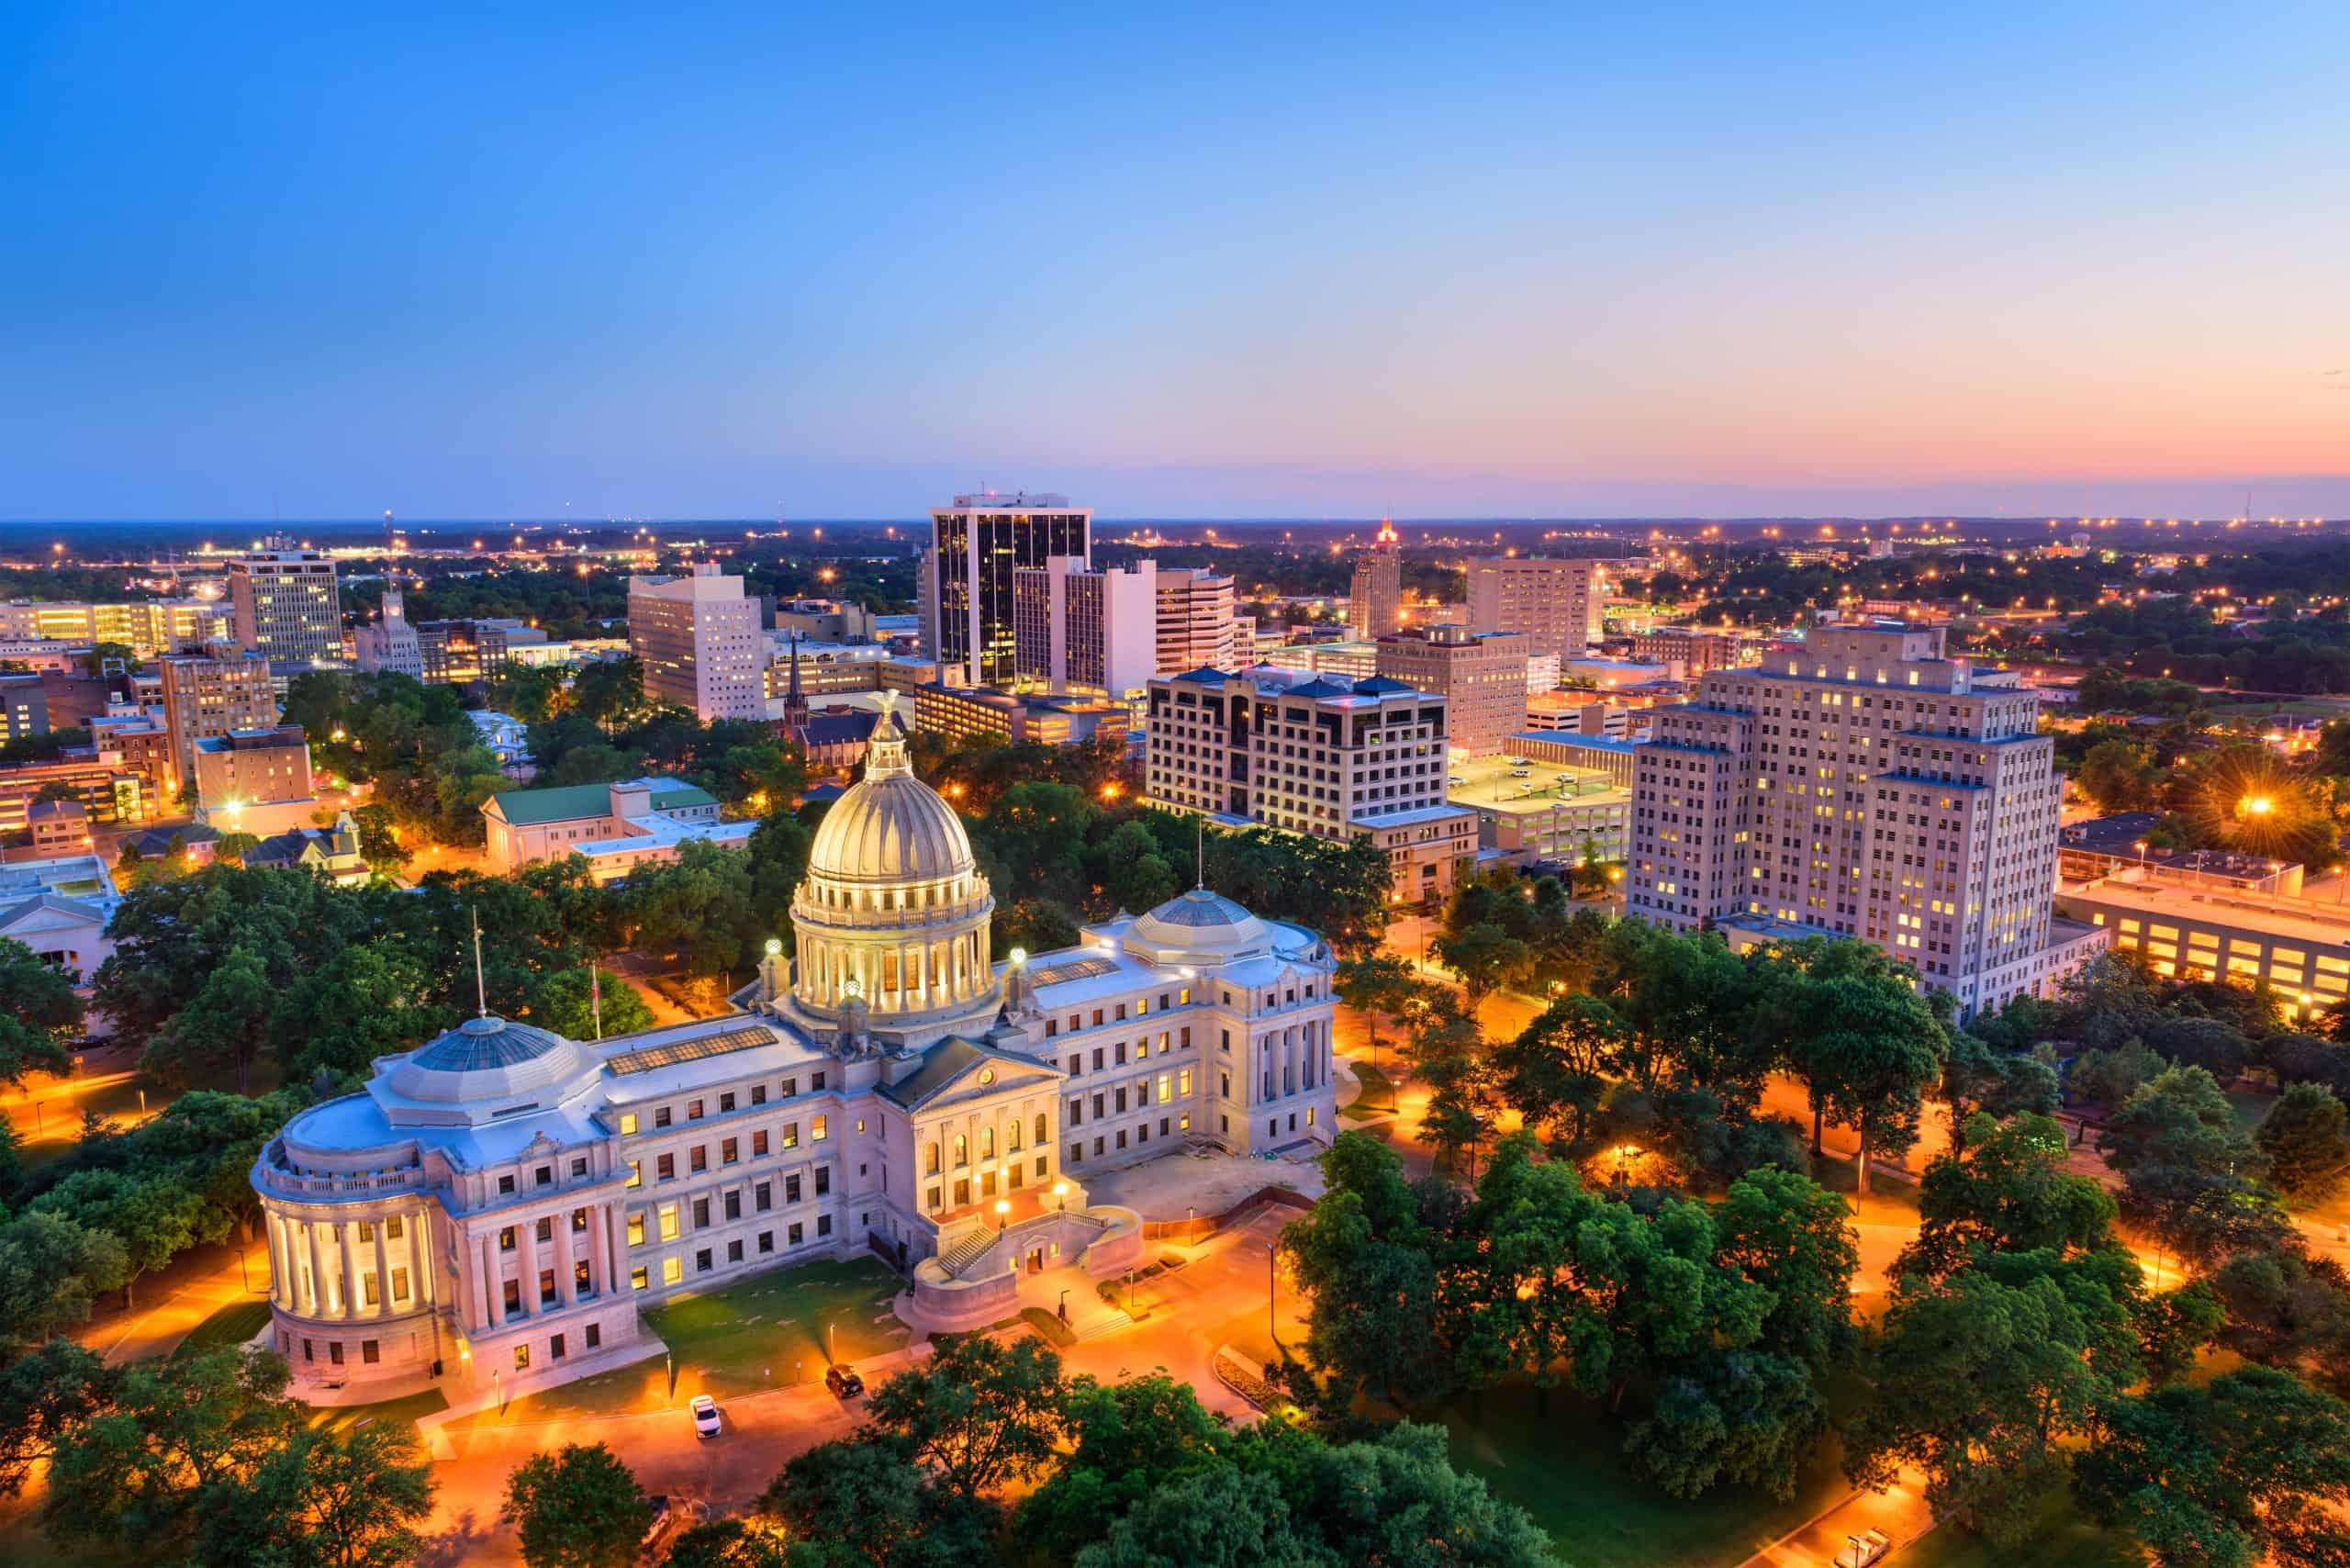
- Documented police killings, Jan. 2020 – Oct. 2024: 7.2 per 100,000 people (11 total)
- Gender of those killed: 100.0% male, 0.0% female
- Race/ethnicity of those killed: 0.0% White, 72.7% Black, 0.0% Hispanic, 0.0% Native American, 0.0% Asian
- Share of those killed with signs of a mental illness: 9.1%
- Share of those killed who were unarmed: 36.4%
- City population: 153,271
9. Victorville, California

- Documented police killings, Jan. 2020 – Oct. 2024: 7.4 per 100,000 people (10 total)
- Gender of those killed: 90.0% male, 10.0% female
- Race/ethnicity of those killed: 20.0% White, 0.0% Black, 50.0% Hispanic, 0.0% Native American, 0.0% Asian
- Share of those killed with signs of a mental illness: 20.0%
- Share of those killed who were unarmed: 20.0%
- City population: 134,417
8. Salt Lake City, Utah
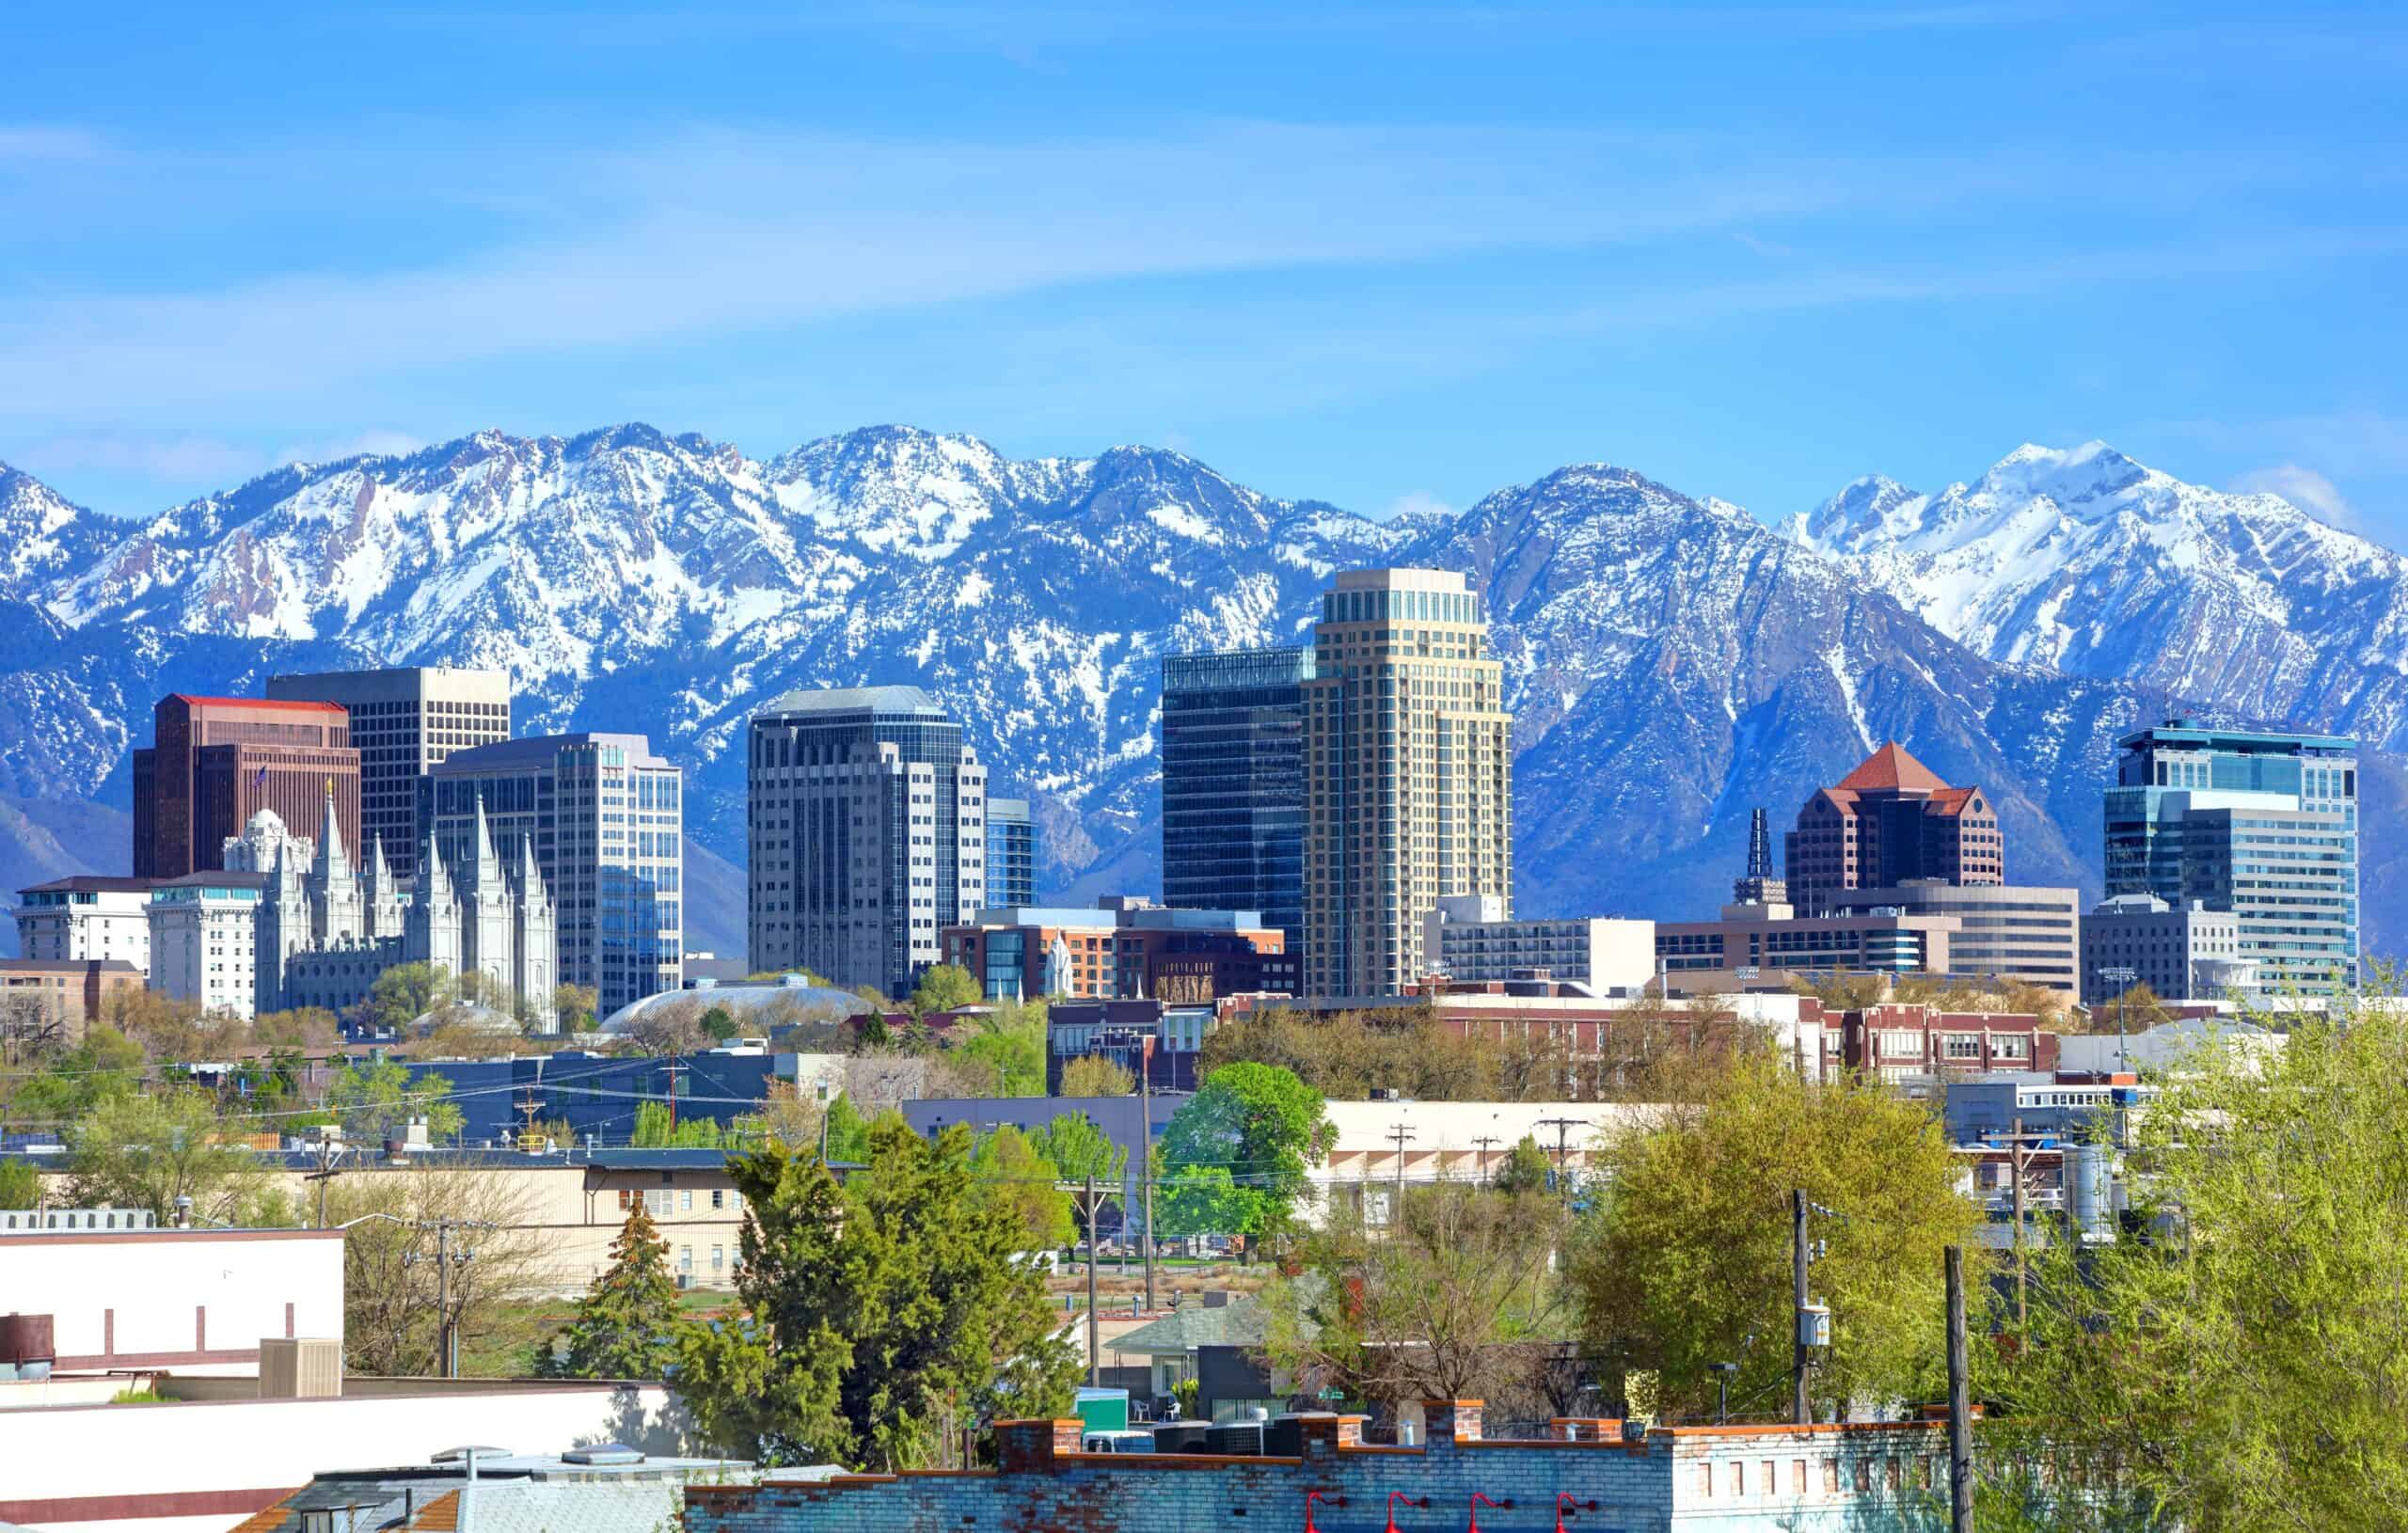
- Documented police killings, Jan. 2020 – Oct. 2024: 7.5 per 100,000 people (15 total)
- Gender of those killed: 93.3% male, 6.7% female
- Race/ethnicity of those killed: 60.0% White, 13.3% Black, 13.3% Hispanic, 0.0% Native American, 0.0% Asian
- Share of those killed with signs of a mental illness: 33.3%
- Share of those killed who were unarmed: 13.3%
- City population: 201,269
7. Savannah, Georgia

- Documented police killings, Jan. 2020 – Oct. 2024: 7.5 per 100,000 people (11 total)
- Gender of those killed: 100.0% male, 0.0% female
- Race/ethnicity of those killed: 27.3% White, 36.4% Black, 0.0% Hispanic, 0.0% Native American, 0.0% Asian
- Share of those killed with signs of a mental illness: 18.2%
- Share of those killed who were unarmed: 9.1%
- City population: 147,583
6. Amarillo, Texas
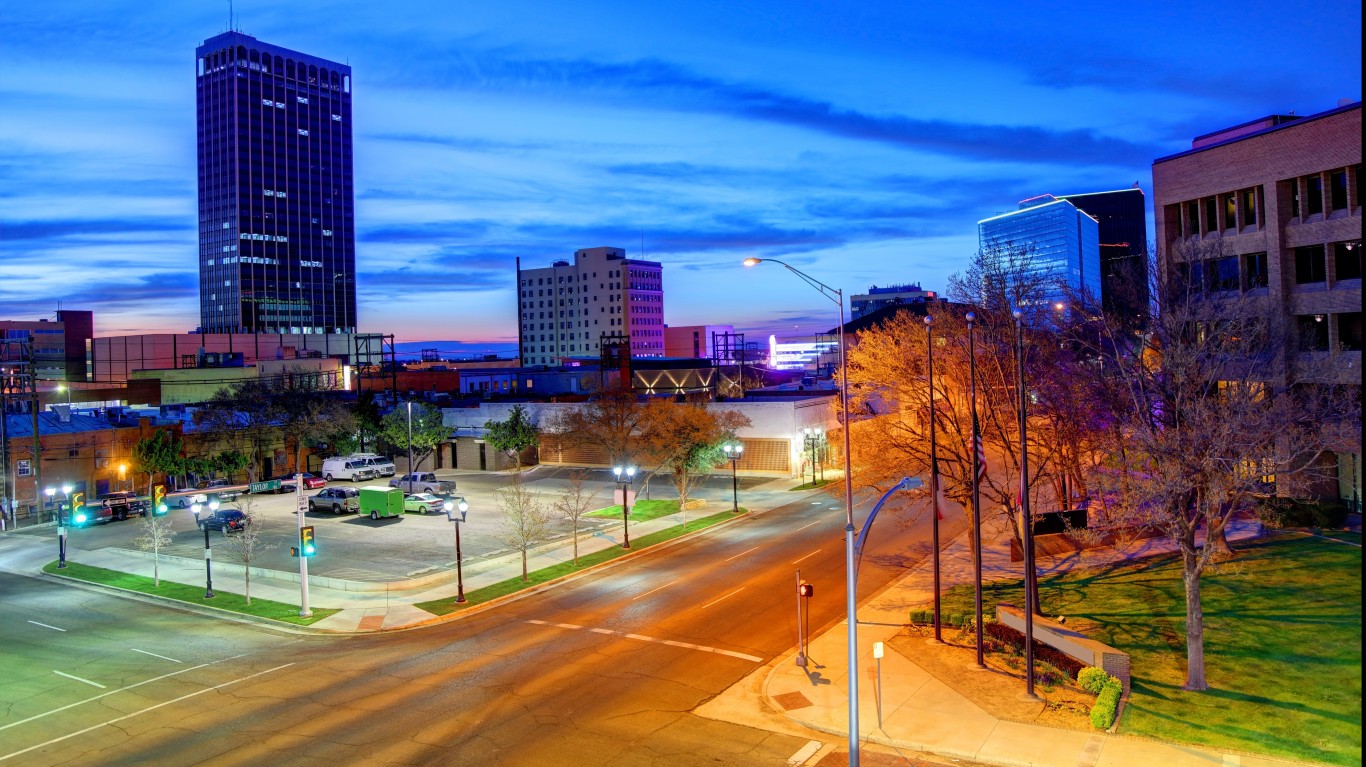
- Documented police killings, Jan. 2020 – Oct. 2024: 7.5 per 100,000 people (15 total)
- Gender of those killed: 93.3% male, 6.7% female
- Race/ethnicity of those killed: 33.3% White, 0.0% Black, 66.7% Hispanic, 0.0% Native American, 0.0% Asian
- Share of those killed with signs of a mental illness: 13.3%
- Share of those killed who were unarmed: 26.7%
- City population: 200,360
5. San Bernardino, California
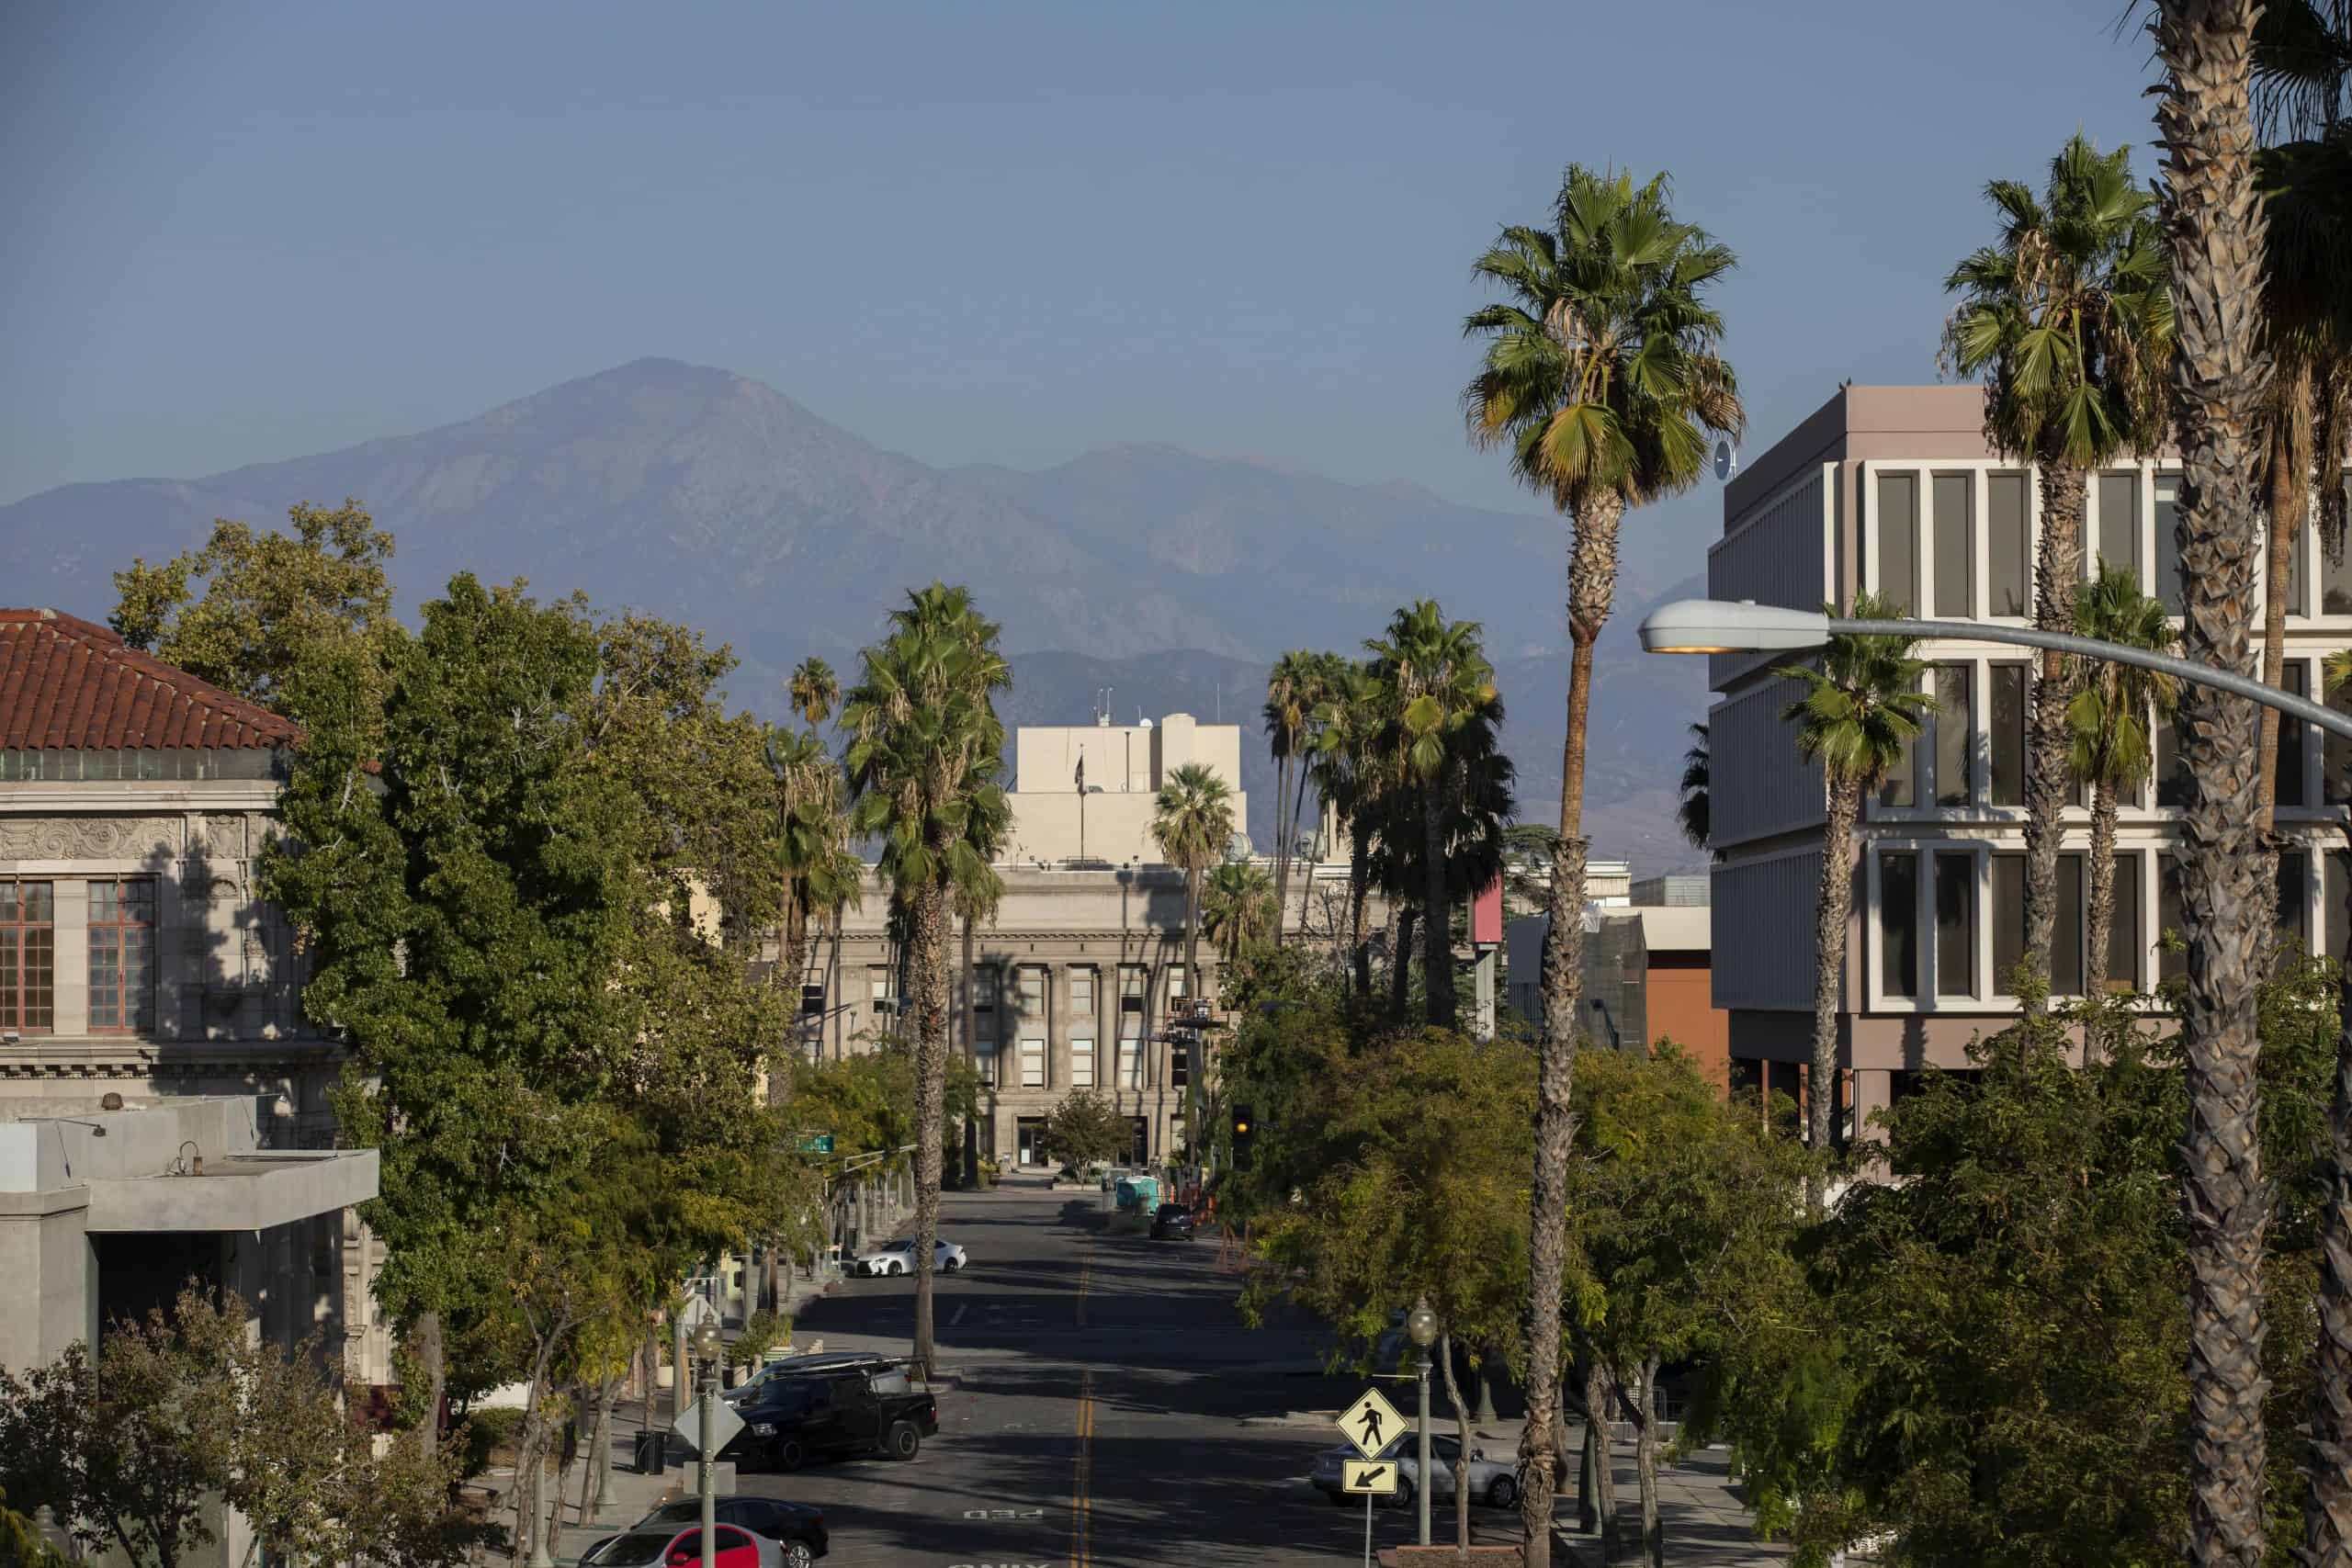
- Documented police killings, Jan. 2020 – Oct. 2024: 7.7 per 100,000 people (17 total)
- Gender of those killed: 94.1% male, 5.9% female
- Race/ethnicity of those killed: 17.6% White, 35.3% Black, 35.3% Hispanic, 0.0% Native American, 0.0% Asian
- Share of those killed with signs of a mental illness: 0.0%
- Share of those killed who were unarmed: 5.9%
- City population: 221,041
4. Albuquerque, New Mexico
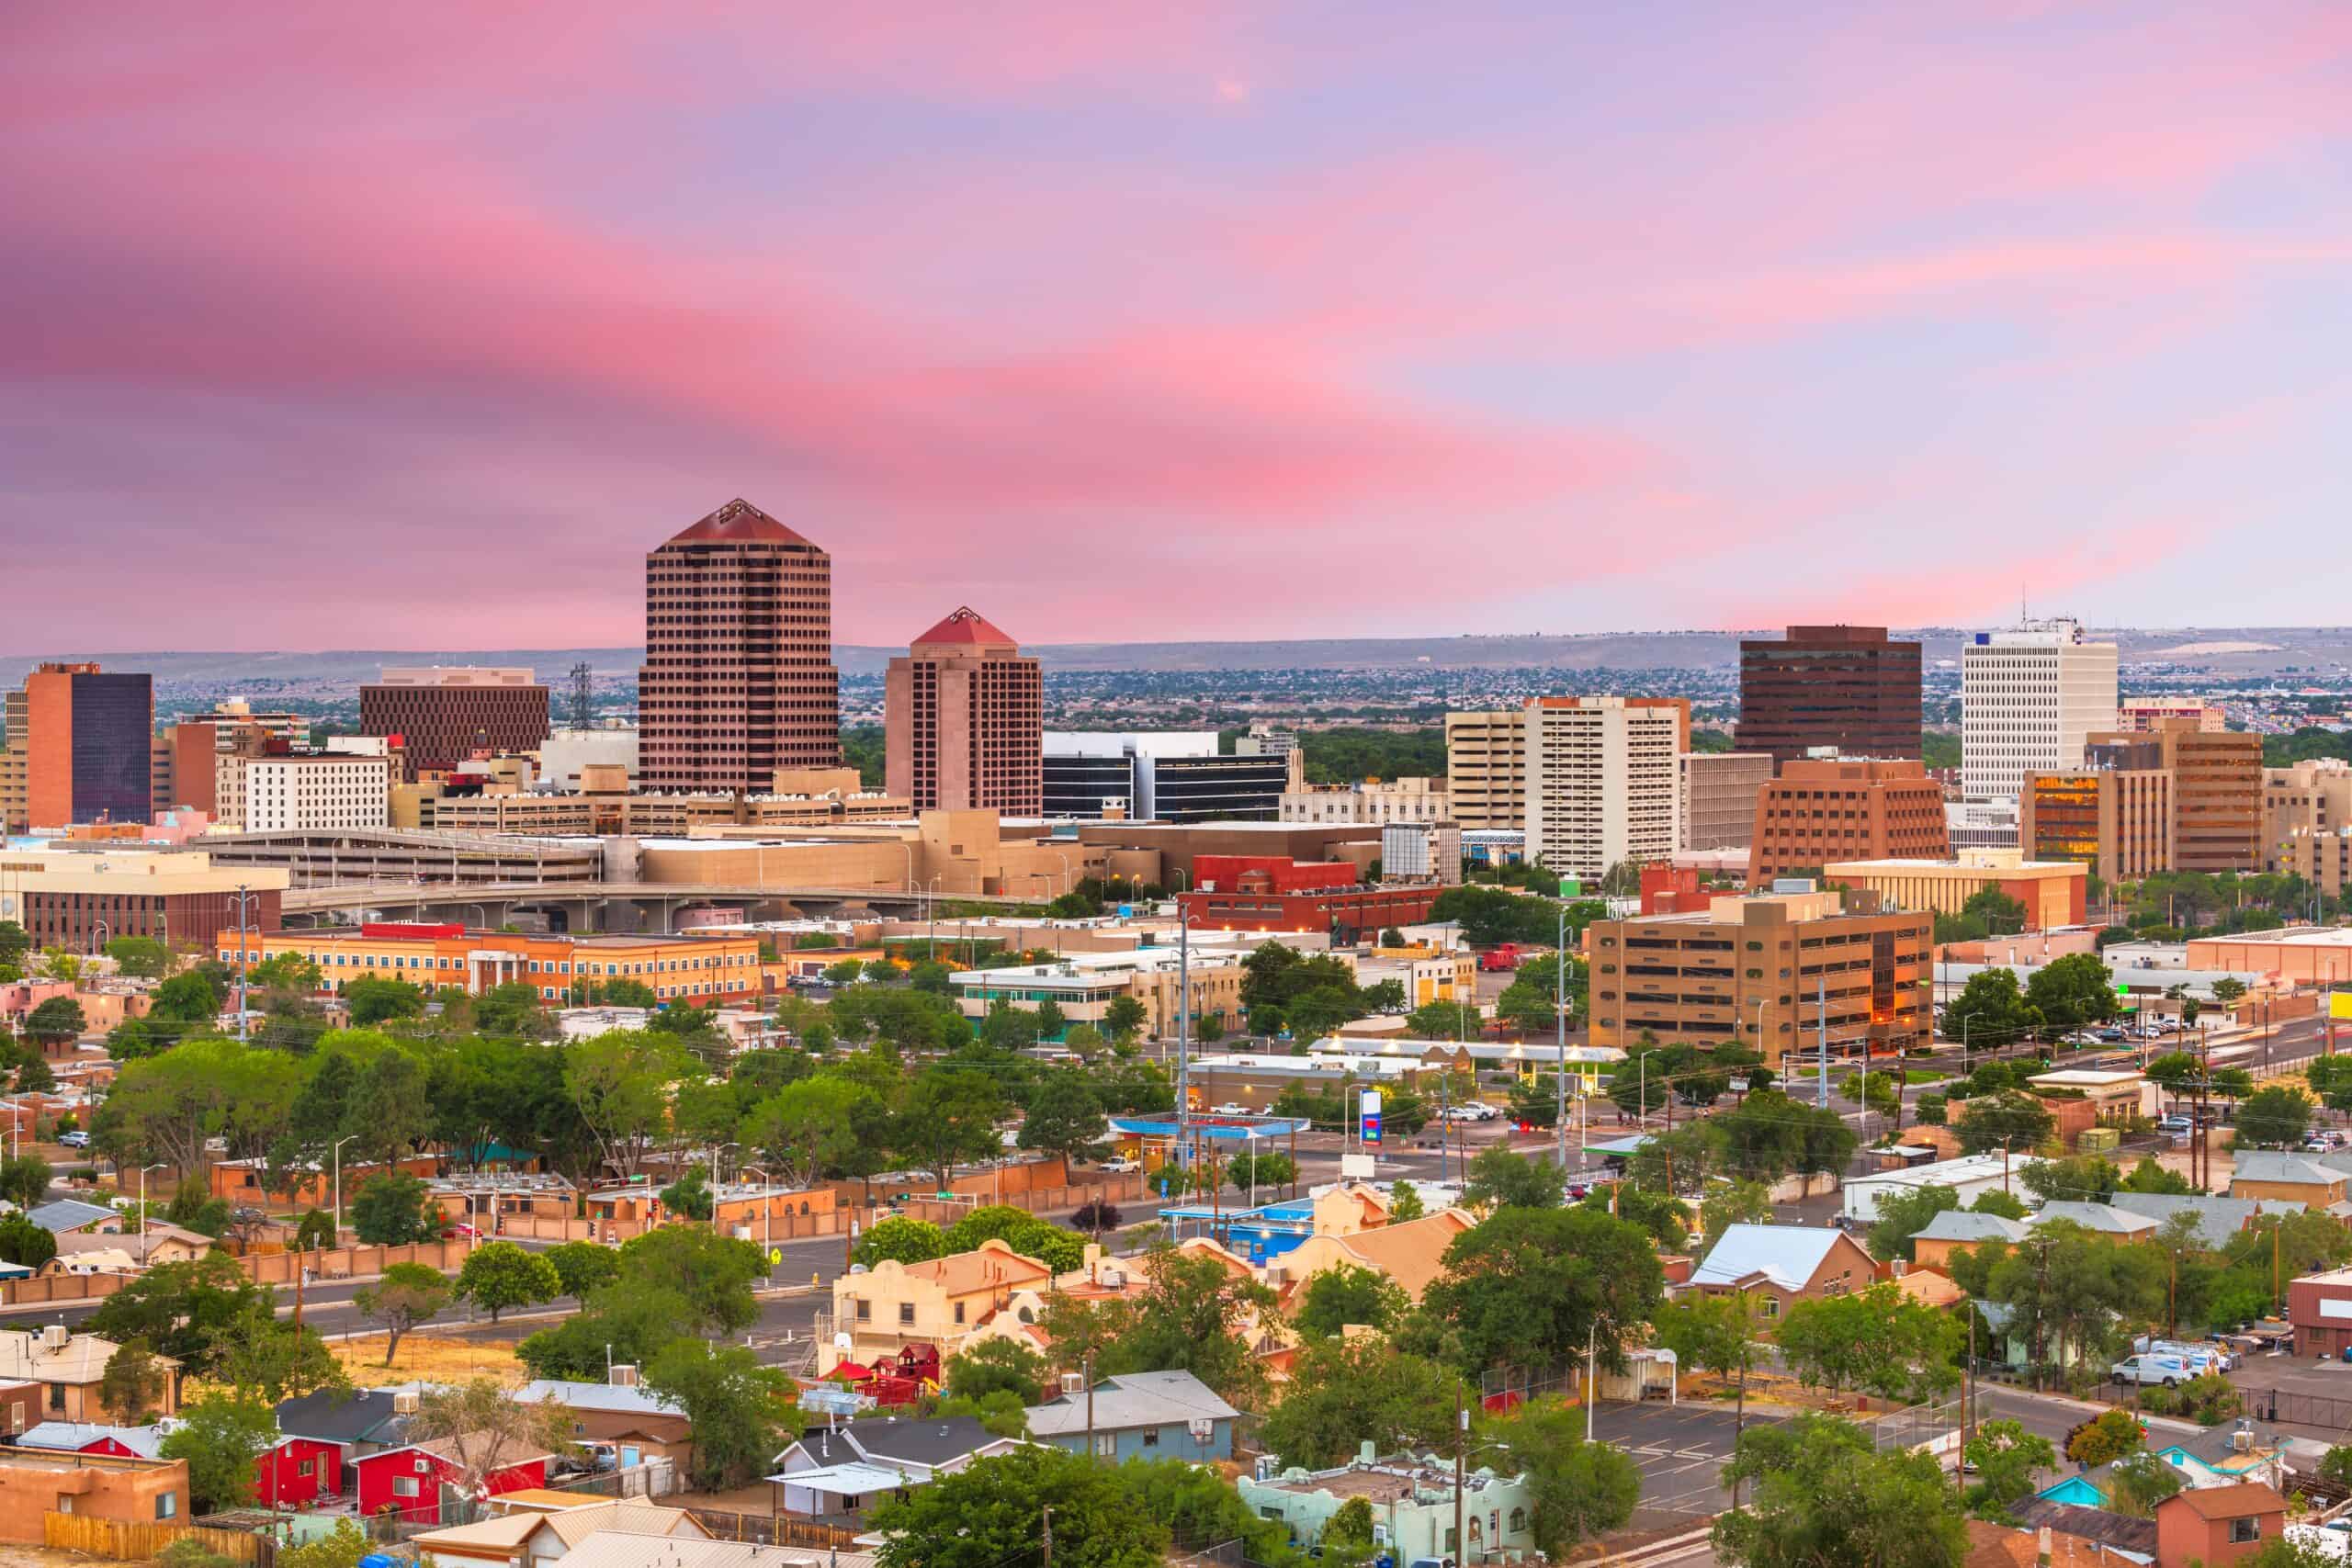
- Documented police killings, Jan. 2020 – Oct. 2024: 8.0 per 100,000 people (45 total)
- Gender of those killed: 97.8% male, 2.2% female
- Race/ethnicity of those killed: 24.4% White, 11.1% Black, 46.7% Hispanic, 8.9% Native American, 0.0% Asian
- Share of those killed with signs of a mental illness: 33.3%
- Share of those killed who were unarmed: 20.0%
- City population: 562,551
3. Evansville, Indiana
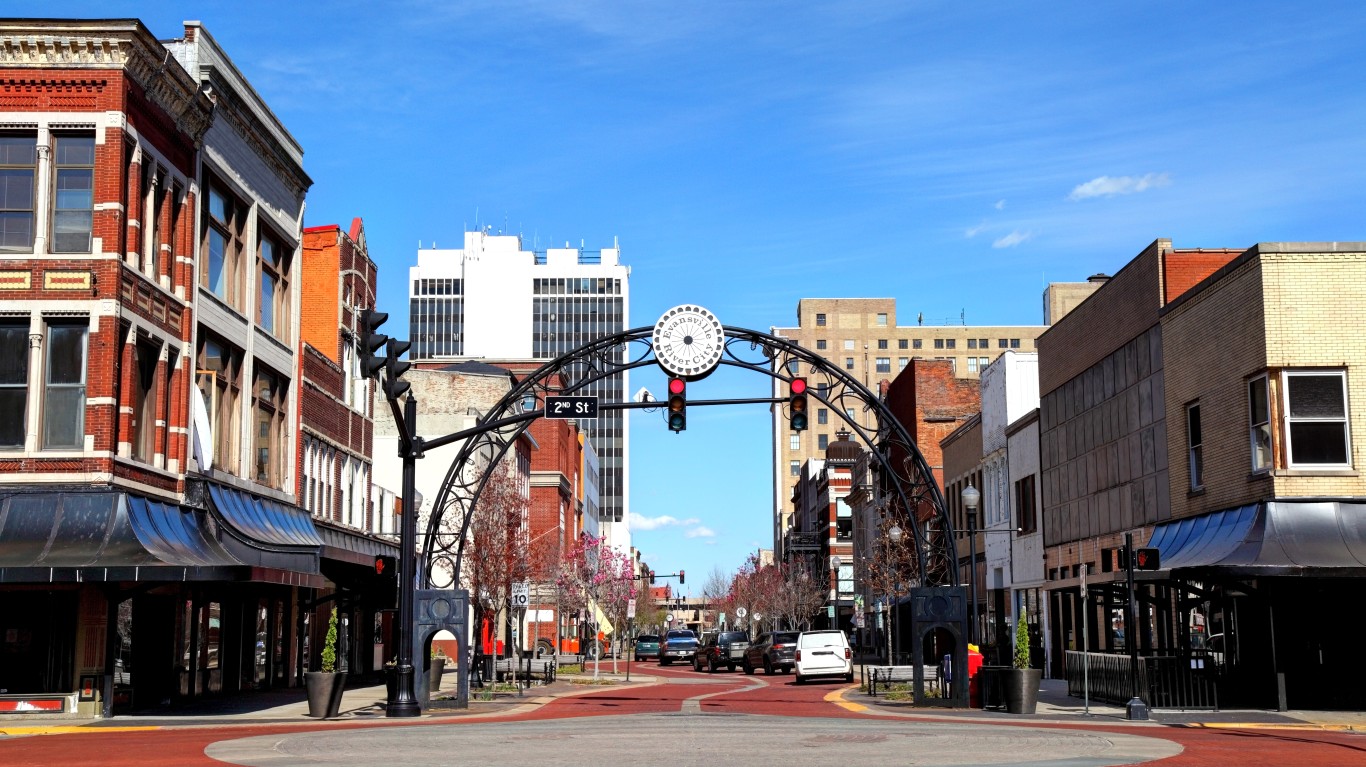
- Documented police killings, Jan. 2020 – Oct. 2024: 10.3 per 100,000 people (12 total)
- Gender of those killed: 91.7% male, 8.3% female
- Race/ethnicity of those killed: 50.0% White, 25.0% Black, 16.7% Hispanic, 0.0% Native American, 0.0% Asian
- Share of those killed with signs of a mental illness: 33.3%
- Share of those killed who were unarmed: 33.3%
- City population: 116,906
2. Las Cruces, New Mexico
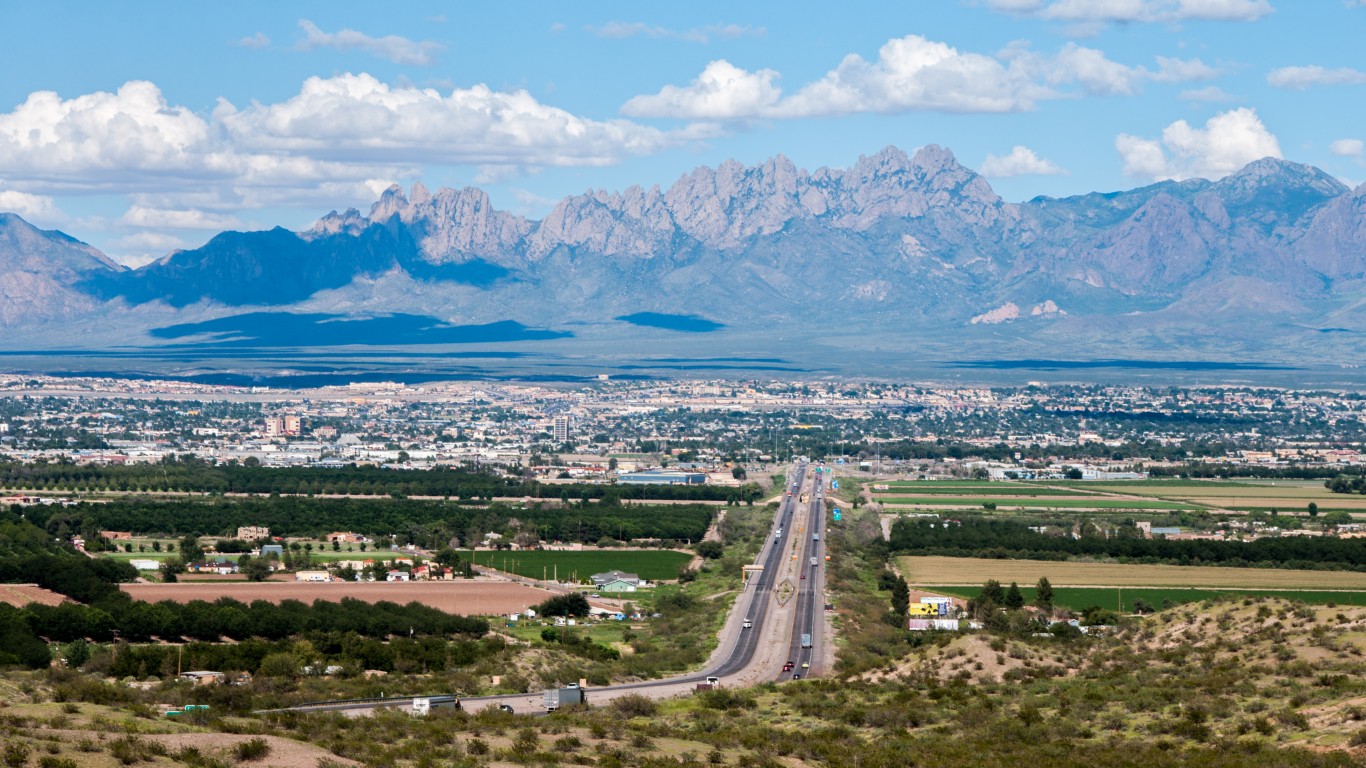
- Documented police killings, Jan. 2020 – Oct. 2024: 11.7 per 100,000 people (13 total)
- Gender of those killed: 84.6% male, 15.4% female
- Race/ethnicity of those killed: 7.7% White, 7.7% Black, 61.5% Hispanic, 0.0% Native American, 0.0% Asian
- Share of those killed with signs of a mental illness: 38.5%
- Share of those killed who were unarmed: 23.1%
- City population: 111,273
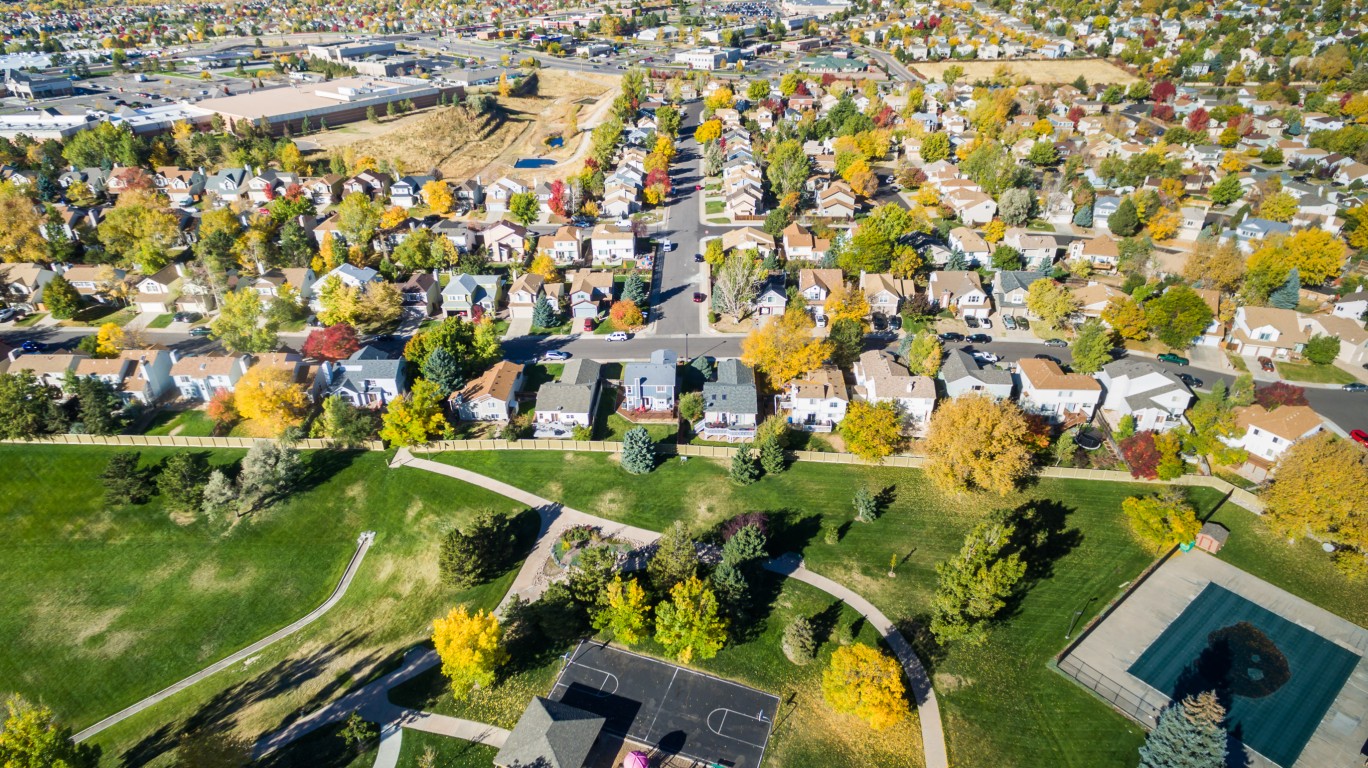
1. Pueblo, Colorado

- Documented police killings, Jan. 2020 – Oct. 2024: 14.4 per 100,000 people (16 total)
- Gender of those killed: 93.8% male, 6.3% female
- Race/ethnicity of those killed: 43.8% White, 0.0% Black, 43.8% Hispanic, 0.0% Native American, 0.0% Asian
- Share of those killed with signs of a mental illness: 12.5%
- Share of those killed who were unarmed: 0.0%
- City population: 111,430