During the first year of the COVID-19 pandemic, reported cases of automobile theft rose sharply in the United States. In 2020, the first year of the pandemic, there were nearly 881,000 reported car thefts nationwide, an 11% increase from 794,000 the previous year. While the pandemic is now over, the rate of auto theft has continued to rise.
According to the National Insurance Crime Bureau, there were over 1 million reported car thefts in 2022 — about 128,000 more than in 2020. Often, motor-vehicle theft is a crime of opportunity. While vehicle theft is sometimes committed for nothing more than a joyride, these crimes are often committed by professionals who re-sell stolen vehicles or vehicle parts. Car theft can be especially lucrative, as the average new vehicle transaction price in December 2024 was nearly $50,000, according to Kelley Blue Book.
While car theft can happen anywhere, the vast majority of these crimes are committed in and around major cities. Of the 1,008,756 known car thefts in 2022, more than 90% were committed in a metropolitan area — and certain metro areas are driving the nationwide increase in motor vehicle theft.
Using data from the NICB, 24/7 Wall St. identified the cities where car theft is surging. We reviewed the percent change in reported car thefts between 2020 and 2022 in the more than 380 U.S. metro areas with available data.
Among the 40 metro areas on this list, the number of reported car thefts rose by anywhere from 40% to over 200% since the COVID-19 pandemic. For comparison, incidents of car theft climbed by about 15% nationwide over the same period. In many of the larger cities on this list — including Chicago, Denver, and Seattle — there were thousands more incidents of car theft in 2022 than there were in 2020. (Here is a look at the most dangerous neighborhoods in America.)
Half of the metro areas on this list are the Western U.S., including nine in Washington state alone, and another four in Colorado. It is important to note that even though each of these cities has reported a dramatic rise in car thefts in recent years, some still do not have an especially high car theft rate. Across all 50 states, the median automobile theft rate is 226 incidents per 100,000 people — and in 14 cities on this list, the car theft rate remains below the national median. Still, other cities on this list have annual car theft rates exceeding 1,000 incidents per 100,000 people. (Here is a look at where your car is most likely to be stolen in every state.)
These are the U.S. cities where car theft has surged since the pandemic.
Why It Matters
Of all the major crimes tracked in the FBI’s crime rate indices, motor vehicle theft has long been among the most common — and in recent years, car theft has only become more prevalent. Over 1 million vehicles were reported stolen in 2022, over 100,000 more than were stolen in 2020. This increase has been disproportionately driven by a handful of major U.S. cities.
40. El Centro, CA
- Change in motor vehicle thefts from 2020 to 2022: +40.4% (+201 incidents)
- Motor-vehicle theft rate in 2022: 391 incidents per 100,000 people (num. 55 of 389 U.S. metro areas)
- Motor-vehicle theft rate in 2020: 276 incidents per 100,000 people (num. 113 of 389 U.S. metro areas)
- Total, known motor-vehicle thefts in 2022: 699 (num. 171 of 389 U.S. metro areas)
- Total, known motor-vehicle thefts in 2020: 498 (num. 197 of 389 U.S. metro areas)
39. Mansfield, OH

- Change in motor vehicle thefts from 2020 to 2022: +41.2% (+56 incidents)
- Motor-vehicle theft rate in 2022: 153 incidents per 100,000 people (num. 254 of 389 U.S. metro areas)
- Motor-vehicle theft rate in 2020: 113 incidents per 100,000 people (num. 296 of 389 U.S. metro areas)
- Total, known motor-vehicle thefts in 2022: 192 (num. 308 of 389 U.S. metro areas)
- Total, known motor-vehicle thefts in 2020: 136 (num. 332 of 389 U.S. metro areas)
38. Rochester, NY

- Change in motor vehicle thefts from 2020 to 2022: +41.4% (+594 incidents)
- Motor-vehicle theft rate in 2022: 188 incidents per 100,000 people (num. 211 of 389 U.S. metro areas)
- Motor-vehicle theft rate in 2020: 134 incidents per 100,000 people (num. 274 of 389 U.S. metro areas)
- Total, known motor-vehicle thefts in 2022: 2,028 (num. 77 of 389 U.S. metro areas)
- Total, known motor-vehicle thefts in 2020: 1,434 (num. 94 of 389 U.S. metro areas)
37. Chicago-Naperville-Elgin, IL-IN-WI

- Change in motor vehicle thefts from 2020 to 2022: +42.0% (+9,792 incidents)
- Motor-vehicle theft rate in 2022: 350 incidents per 100,000 people (num. 73 of 389 U.S. metro areas)
- Motor-vehicle theft rate in 2020: 248 incidents per 100,000 people (num. 146 of 389 U.S. metro areas)
- Total, known motor-vehicle thefts in 2022: 33,089 (num. 2 of 389 U.S. metro areas)
- Total, known motor-vehicle thefts in 2020: 23,297 (num. 6 of 389 U.S. metro areas)
36. Milwaukee-Waukesha, WI

- Change in motor vehicle thefts from 2020 to 2022: +43.3% (+2,359 incidents)
- Motor-vehicle theft rate in 2022: 500 incidents per 100,000 people (num. 23 of 389 U.S. metro areas)
- Motor-vehicle theft rate in 2020: 345 incidents per 100,000 people (num. 66 of 389 U.S. metro areas)
- Total, known motor-vehicle thefts in 2022: 7,805 (num. 29 of 389 U.S. metro areas)
- Total, known motor-vehicle thefts in 2020: 5,446 (num. 38 of 389 U.S. metro areas)
35. Albany-Lebanon, OR
- Change in motor vehicle thefts from 2020 to 2022: +44.0% (+118 incidents)
- Motor-vehicle theft rate in 2022: 296 incidents per 100,000 people (num. 106 of 389 U.S. metro areas)
- Motor-vehicle theft rate in 2020: 205 incidents per 100,000 people (num. 190 of 389 U.S. metro areas)
- Total, known motor-vehicle thefts in 2022: 386 (num. 222 of 389 U.S. metro areas)
- Total, known motor-vehicle thefts in 2020: 268 (num. 268 of 389 U.S. metro areas)
34. Bloomington, IL
- Change in motor vehicle thefts from 2020 to 2022: +44.2% (+53 incidents)
- Motor-vehicle theft rate in 2022: 101 incidents per 100,000 people (num. 311 of 389 U.S. metro areas)
- Motor-vehicle theft rate in 2020: 70 incidents per 100,000 people (num. 353 of 389 U.S. metro areas)
- Total, known motor-vehicle thefts in 2022: 173 (num. 314 of 389 U.S. metro areas)
- Total, known motor-vehicle thefts in 2020: 120 (num. 340 of 389 U.S. metro areas)
33. Redding, CA

- Change in motor vehicle thefts from 2020 to 2022: +45.0% (+313 incidents)
- Motor-vehicle theft rate in 2022: 557 incidents per 100,000 people (num. 13 of 389 U.S. metro areas)
- Motor-vehicle theft rate in 2020: 388 incidents per 100,000 people (num. 47 of 389 U.S. metro areas)
- Total, known motor-vehicle thefts in 2022: 1,008 (num. 126 of 389 U.S. metro areas)
- Total, known motor-vehicle thefts in 2020: 695 (num. 163 of 389 U.S. metro areas)
32. Albany-Schenectady-Troy, NY
- Change in motor vehicle thefts from 2020 to 2022: +45.1% (+381 incidents)
- Motor-vehicle theft rate in 2022: 135 incidents per 100,000 people (num. 275 of 389 U.S. metro areas)
- Motor-vehicle theft rate in 2020: 96 incidents per 100,000 people (num. 319 of 389 U.S. metro areas)
- Total, known motor-vehicle thefts in 2022: 1,225 (num. 108 of 389 U.S. metro areas)
- Total, known motor-vehicle thefts in 2020: 844 (num. 146 of 389 U.S. metro areas)
31. Utica-Rome, NY

- Change in motor vehicle thefts from 2020 to 2022: +45.9% (+90 incidents)
- Motor-vehicle theft rate in 2022: 99 incidents per 100,000 people (num. 312 of 389 U.S. metro areas)
- Motor-vehicle theft rate in 2020: 68 incidents per 100,000 people (num. 359 of 389 U.S. metro areas)
- Total, known motor-vehicle thefts in 2022: 286 (num. 261 of 389 U.S. metro areas)
- Total, known motor-vehicle thefts in 2020: 196 (num. 302 of 389 U.S. metro areas)
30. Sierra Vista-Douglas, AZ
- Change in motor vehicle thefts from 2020 to 2022: +47.7% (+51 incidents)
- Motor-vehicle theft rate in 2022: 126 incidents per 100,000 people (num. 289 of 389 U.S. metro areas)
- Motor-vehicle theft rate in 2020: 84 incidents per 100,000 people (num. 334 of 389 U.S. metro areas)
- Total, known motor-vehicle thefts in 2022: 158 (num. 324 of 389 U.S. metro areas)
- Total, known motor-vehicle thefts in 2020: 107 (num. 348 of 389 U.S. metro areas)
29. San Antonio-New Braunfels, TX

- Change in motor vehicle thefts from 2020 to 2022: +48.1% (+4,743 incidents)
- Motor-vehicle theft rate in 2022: 550 incidents per 100,000 people (num. 14 of 389 U.S. metro areas)
- Motor-vehicle theft rate in 2020: 380 incidents per 100,000 people (num. 51 of 389 U.S. metro areas)
- Total, known motor-vehicle thefts in 2022: 14,595 (num. 19 of 389 U.S. metro areas)
- Total, known motor-vehicle thefts in 2020: 9,852 (num. 22 of 389 U.S. metro areas)
28. Rockford, IL

- Change in motor vehicle thefts from 2020 to 2022: +48.4% (+274 incidents)
- Motor-vehicle theft rate in 2022: 250 incidents per 100,000 people (num. 139 of 389 U.S. metro areas)
- Motor-vehicle theft rate in 2020: 169 incidents per 100,000 people (num. 238 of 389 U.S. metro areas)
- Total, known motor-vehicle thefts in 2022: 840 (num. 155 of 389 U.S. metro areas)
- Total, known motor-vehicle thefts in 2020: 566 (num. 189 of 389 U.S. metro areas)
27. Youngstown-Warren-Boardman, OH-PA

- Change in motor vehicle thefts from 2020 to 2022: +48.9% (+278 incidents)
- Motor-vehicle theft rate in 2022: 158 incidents per 100,000 people (num. 248 of 389 U.S. metro areas)
- Motor-vehicle theft rate in 2020: 107 incidents per 100,000 people (num. 308 of 389 U.S. metro areas)
- Total, known motor-vehicle thefts in 2022: 847 (num. 153 of 389 U.S. metro areas)
- Total, known motor-vehicle thefts in 2020: 569 (num. 187 of 389 U.S. metro areas)
26. Philadelphia-Camden-Wilmington, PA-NJ-DE-MD

- Change in motor vehicle thefts from 2020 to 2022: +50.0% (+6,492 incidents)
- Motor-vehicle theft rate in 2022: 312 incidents per 100,000 people (num. 90 of 389 U.S. metro areas)
- Motor-vehicle theft rate in 2020: 213 incidents per 100,000 people (num. 181 of 389 U.S. metro areas)
- Total, known motor-vehicle thefts in 2022: 19,486 (num. 11 of 389 U.S. metro areas)
- Total, known motor-vehicle thefts in 2020: 12,994 (num. 14 of 389 U.S. metro areas)
25. Denver-Aurora-Lakewood, CO

- Change in motor vehicle thefts from 2020 to 2022: +50.3% (+10,618 incidents)
- Motor-vehicle theft rate in 2022: 1,063 incidents per 100,000 people (num. 3 of 389 U.S. metro areas)
- Motor-vehicle theft rate in 2020: 706 incidents per 100,000 people (num. 3 of 389 U.S. metro areas)
- Total, known motor-vehicle thefts in 2022: 31,730 (num. 5 of 389 U.S. metro areas)
- Total, known motor-vehicle thefts in 2020: 21,112 (num. 8 of 389 U.S. metro areas)
24. Lynchburg, VA

- Change in motor vehicle thefts from 2020 to 2022: +51.8% (+144 incidents)
- Motor-vehicle theft rate in 2022: 160 incidents per 100,000 people (num. 245 of 389 U.S. metro areas)
- Motor-vehicle theft rate in 2020: 105 incidents per 100,000 people (num. 311 of 389 U.S. metro areas)
- Total, known motor-vehicle thefts in 2022: 422 (num. 212 of 389 U.S. metro areas)
- Total, known motor-vehicle thefts in 2020: 278 (num. 260 of 389 U.S. metro areas)
23. Detroit-Warren-Dearborn, MI

- Change in motor vehicle thefts from 2020 to 2022: +57.0% (+6,182 incidents)
- Motor-vehicle theft rate in 2022: 392 incidents per 100,000 people (num. 53 of 389 U.S. metro areas)
- Motor-vehicle theft rate in 2020: 252 incidents per 100,000 people (num. 138 of 389 U.S. metro areas)
- Total, known motor-vehicle thefts in 2022: 17,026 (num. 14 of 389 U.S. metro areas)
- Total, known motor-vehicle thefts in 2020: 10,844 (num. 21 of 389 U.S. metro areas)
22. Spokane-Spokane Valley, WA

- Change in motor vehicle thefts from 2020 to 2022: +57.2% (+1,137 incidents)
- Motor-vehicle theft rate in 2022: 523 incidents per 100,000 people (num. 20 of 389 U.S. metro areas)
- Motor-vehicle theft rate in 2020: 346 incidents per 100,000 people (num. 65 of 389 U.S. metro areas)
- Total, known motor-vehicle thefts in 2022: 3,126 (num. 54 of 389 U.S. metro areas)
- Total, known motor-vehicle thefts in 2020: 1,989 (num. 75 of 389 U.S. metro areas)
21. Mount Vernon-Anacortes, WA

- Change in motor vehicle thefts from 2020 to 2022: +59.5% (+178 incidents)
- Motor-vehicle theft rate in 2022: 364 incidents per 100,000 people (num. 68 of 389 U.S. metro areas)
- Motor-vehicle theft rate in 2020: 229 incidents per 100,000 people (num. 164 of 389 U.S. metro areas)
- Total, known motor-vehicle thefts in 2022: 477 (num. 202 of 389 U.S. metro areas)
- Total, known motor-vehicle thefts in 2020: 299 (num. 250 of 389 U.S. metro areas)
20. Walla Walla, WA
- Change in motor vehicle thefts from 2020 to 2022: +61.6% (+61 incidents)
- Motor-vehicle theft rate in 2022: 259 incidents per 100,000 people (num. 135 of 389 U.S. metro areas)
- Motor-vehicle theft rate in 2020: 162 incidents per 100,000 people (num. 246 of 389 U.S. metro areas)
- Total, known motor-vehicle thefts in 2022: 160 (num. 322 of 389 U.S. metro areas)
- Total, known motor-vehicle thefts in 2020: 99 (num. 353 of 389 U.S. metro areas)
19. Portland-Vancouver-Hillsboro, OR-WA

- Change in motor vehicle thefts from 2020 to 2022: +62.6% (+7,700 incidents)
- Motor-vehicle theft rate in 2022: 797 incidents per 100,000 people (num. 5 of 389 U.S. metro areas)
- Motor-vehicle theft rate in 2020: 490 incidents per 100,000 people (num. 19 of 389 U.S. metro areas)
- Total, known motor-vehicle thefts in 2022: 19,999 (num. 10 of 389 U.S. metro areas)
- Total, known motor-vehicle thefts in 2020: 12,299 (num. 17 of 389 U.S. metro areas)
18. Seattle-Tacoma-Bellevue, WA

- Change in motor vehicle thefts from 2020 to 2022: +63.8% (+11,916 incidents)
- Motor-vehicle theft rate in 2022: 759 incidents per 100,000 people (num. 7 of 389 U.S. metro areas)
- Motor-vehicle theft rate in 2020: 465 incidents per 100,000 people (num. 26 of 389 U.S. metro areas)
- Total, known motor-vehicle thefts in 2022: 30,607 (num. 7 of 389 U.S. metro areas)
- Total, known motor-vehicle thefts in 2020: 18,691 (num. 9 of 389 U.S. metro areas)
17. Charlottesville, VA

- Change in motor vehicle thefts from 2020 to 2022: +64.4% (+116 incidents)
- Motor-vehicle theft rate in 2022: 132 incidents per 100,000 people (num. 282 of 389 U.S. metro areas)
- Motor-vehicle theft rate in 2020: 82 incidents per 100,000 people (num. 344 of 389 U.S. metro areas)
- Total, known motor-vehicle thefts in 2022: 296 (num. 258 of 389 U.S. metro areas)
- Total, known motor-vehicle thefts in 2020: 180 (num. 315 of 389 U.S. metro areas)
16. Olympia-Lacey-Tumwater, WA

- Change in motor vehicle thefts from 2020 to 2022: +67.6% (+453 incidents)
- Motor-vehicle theft rate in 2022: 376 incidents per 100,000 people (num. 63 of 389 U.S. metro areas)
- Motor-vehicle theft rate in 2020: 228 incidents per 100,000 people (num. 165 of 389 U.S. metro areas)
- Total, known motor-vehicle thefts in 2022: 1,123 (num. 118 of 389 U.S. metro areas)
- Total, known motor-vehicle thefts in 2020: 670 (num. 166 of 389 U.S. metro areas)
15. Las Cruces, NM
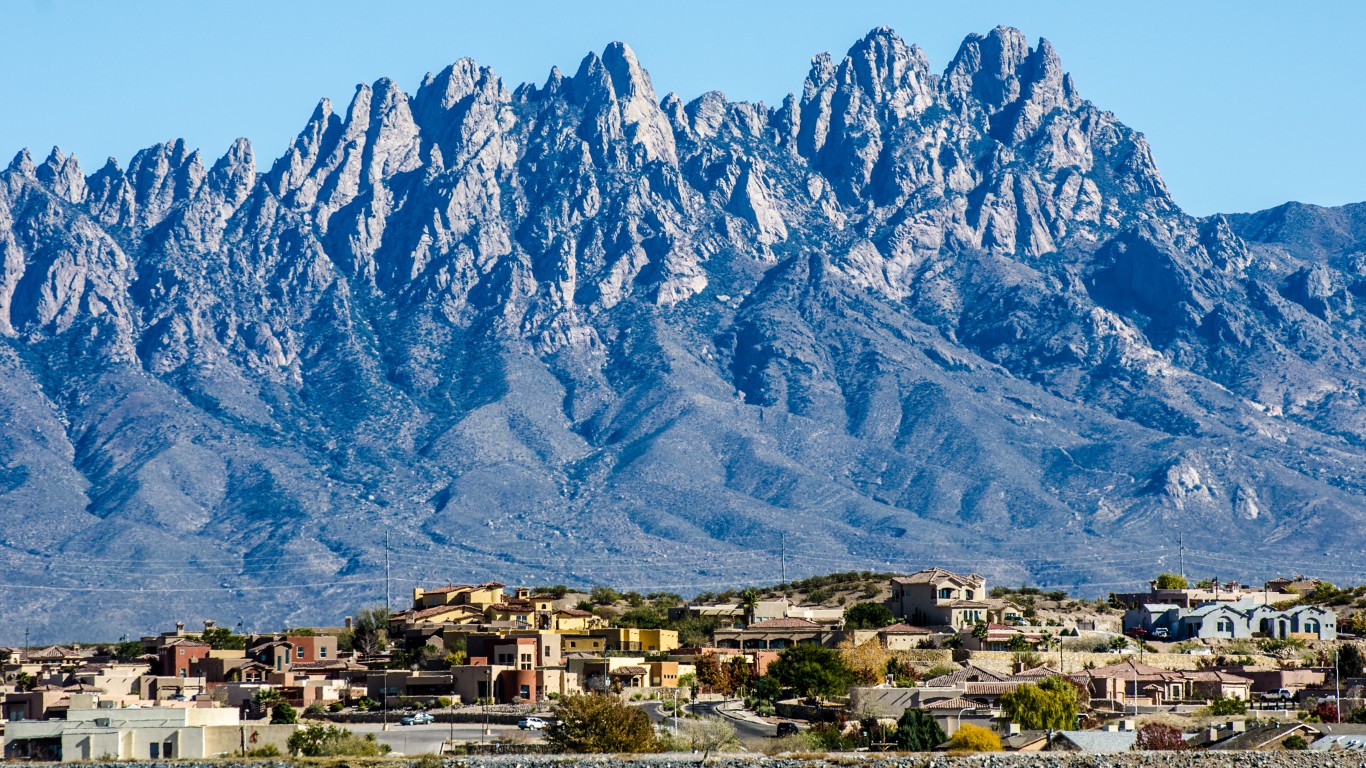
- Change in motor vehicle thefts from 2020 to 2022: +68.7% (+483 incidents)
- Motor-vehicle theft rate in 2022: 531 incidents per 100,000 people (num. 18 of 389 U.S. metro areas)
- Motor-vehicle theft rate in 2020: 318 incidents per 100,000 people (num. 78 of 389 U.S. metro areas)
- Total, known motor-vehicle thefts in 2022: 1,186 (num. 111 of 389 U.S. metro areas)
- Total, known motor-vehicle thefts in 2020: 703 (num. 161 of 389 U.S. metro areas)
14. Dover, DE
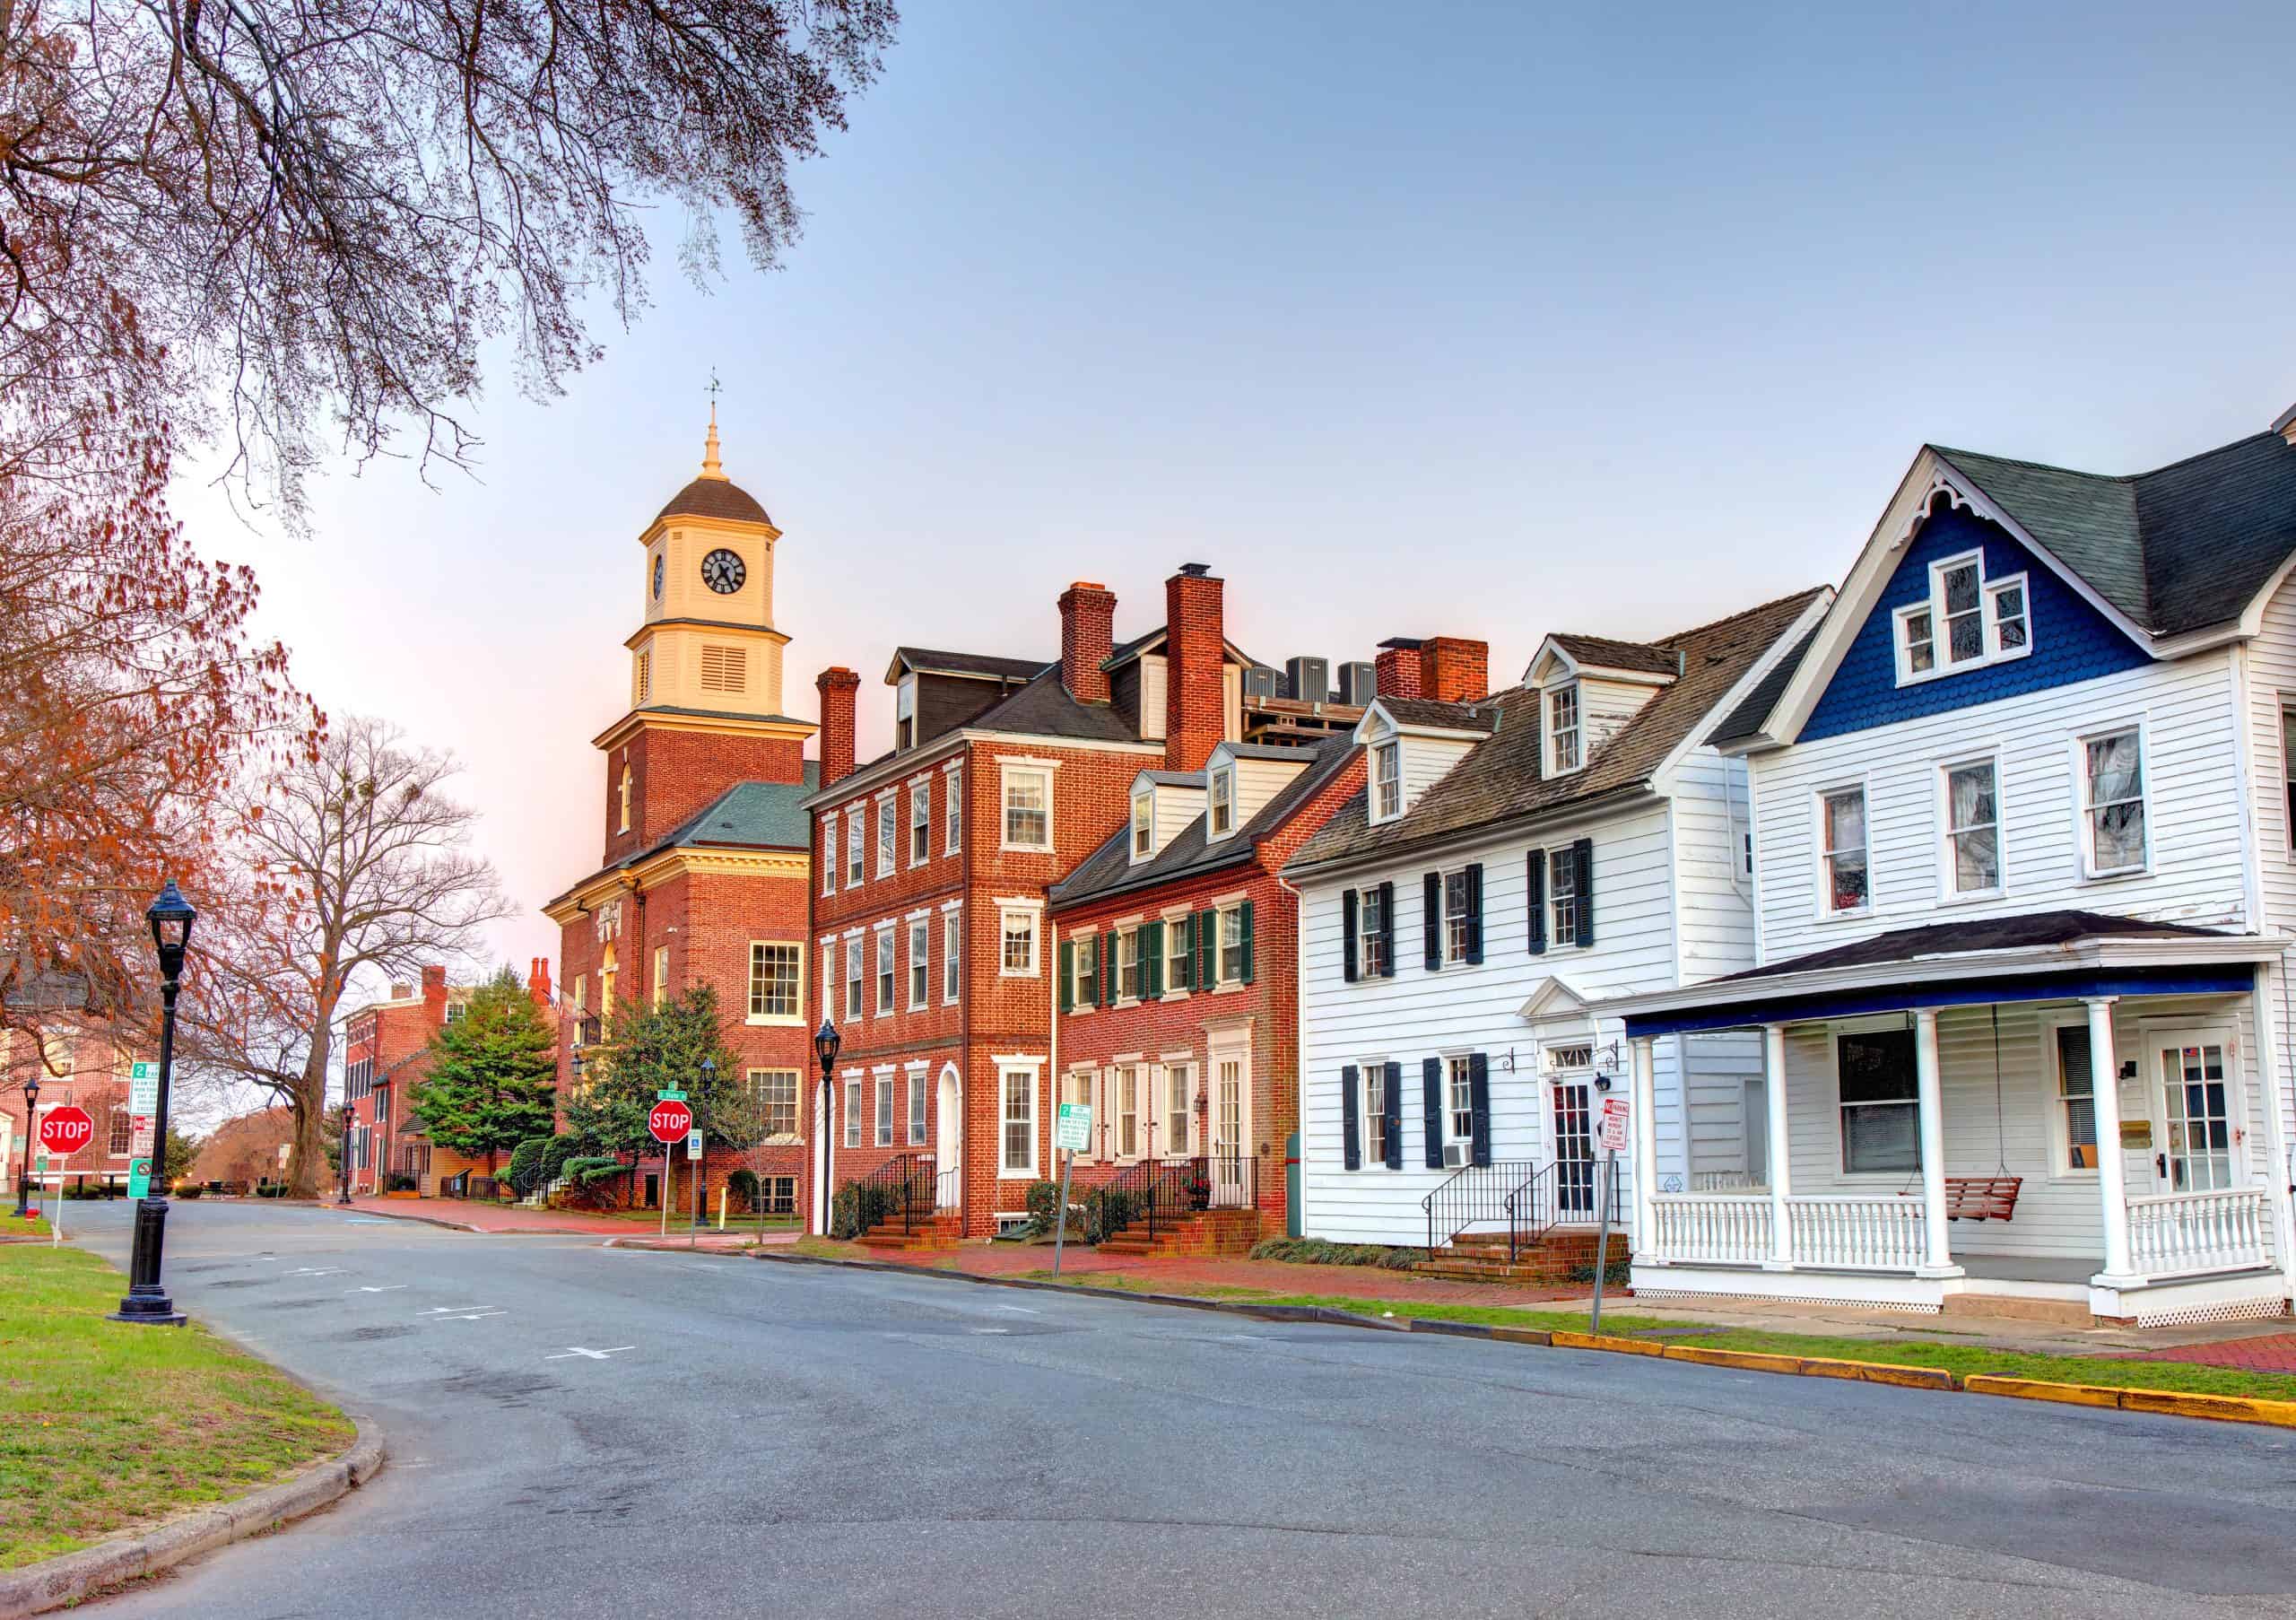
- Change in motor vehicle thefts from 2020 to 2022: +69.9% (+165 incidents)
- Motor-vehicle theft rate in 2022: 215 incidents per 100,000 people (num. 180 of 389 U.S. metro areas)
- Motor-vehicle theft rate in 2020: 129 incidents per 100,000 people (num. 281 of 389 U.S. metro areas)
- Total, known motor-vehicle thefts in 2022: 401 (num. 219 of 389 U.S. metro areas)
- Total, known motor-vehicle thefts in 2020: 236 (num. 282 of 389 U.S. metro areas)
13. Santa Fe, NM

- Change in motor vehicle thefts from 2020 to 2022: +71.8% (+316 incidents)
- Motor-vehicle theft rate in 2022: 486 incidents per 100,000 people (num. 27 of 389 U.S. metro areas)
- Motor-vehicle theft rate in 2020: 290 incidents per 100,000 people (num. 93 of 389 U.S. metro areas)
- Total, known motor-vehicle thefts in 2022: 756 (num. 162 of 389 U.S. metro areas)
- Total, known motor-vehicle thefts in 2020: 440 (num. 208 of 389 U.S. metro areas)
12. Longview, WA

- Change in motor vehicle thefts from 2020 to 2022: +72.8% (+177 incidents)
- Motor-vehicle theft rate in 2022: 375 incidents per 100,000 people (num. 64 of 389 U.S. metro areas)
- Motor-vehicle theft rate in 2020: 218 incidents per 100,000 people (num. 173 of 389 U.S. metro areas)
- Total, known motor-vehicle thefts in 2022: 420 (num. 213 of 389 U.S. metro areas)
- Total, known motor-vehicle thefts in 2020: 243 (num. 279 of 389 U.S. metro areas)
11. Fort Collins, CO
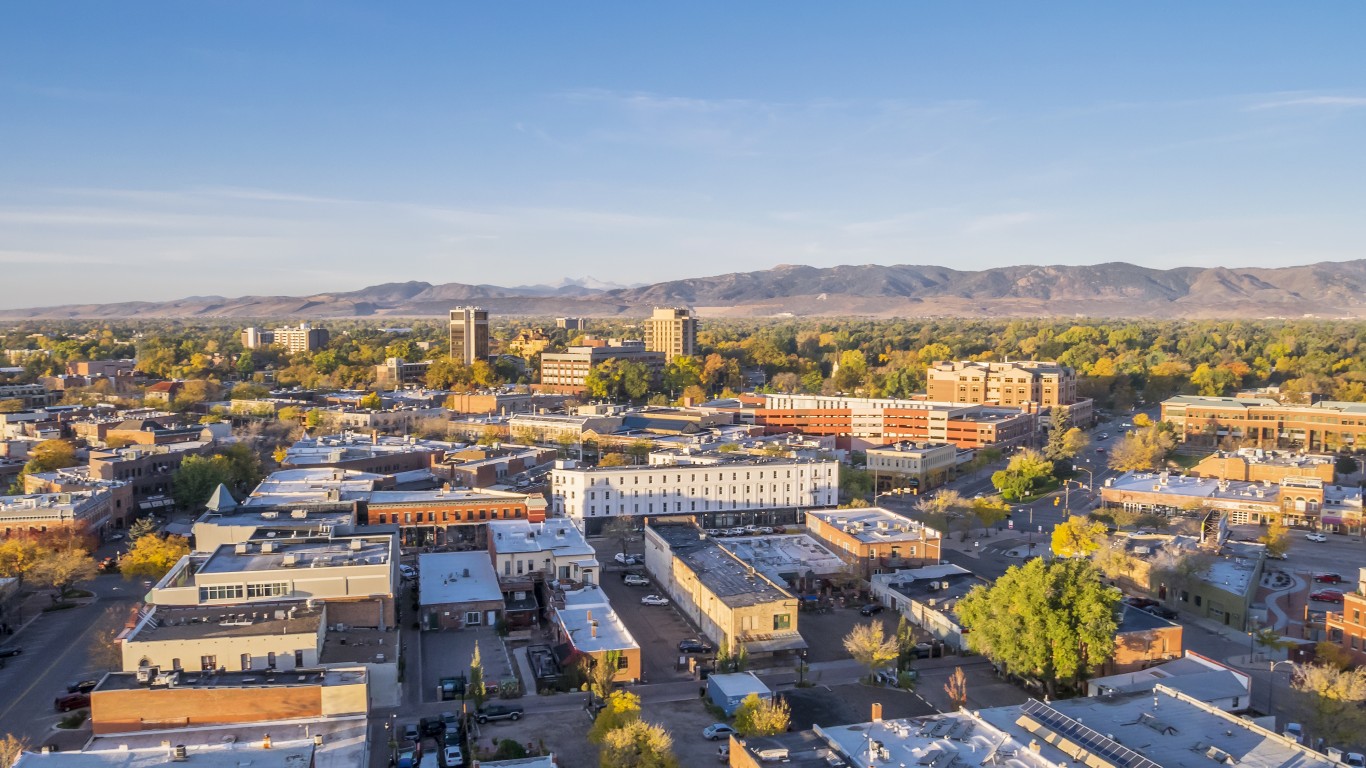
- Change in motor vehicle thefts from 2020 to 2022: +74.6% (+425 incidents)
- Motor-vehicle theft rate in 2022: 271 incidents per 100,000 people (num. 122 of 389 U.S. metro areas)
- Motor-vehicle theft rate in 2020: 158 incidents per 100,000 people (num. 248 of 389 U.S. metro areas)
- Total, known motor-vehicle thefts in 2022: 995 (num. 127 of 389 U.S. metro areas)
- Total, known motor-vehicle thefts in 2020: 570 (num. 186 of 389 U.S. metro areas)
10. Wenatchee, WA

- Change in motor vehicle thefts from 2020 to 2022: +78.4% (+105 incidents)
- Motor-vehicle theft rate in 2022: 193 incidents per 100,000 people (num. 205 of 389 U.S. metro areas)
- Motor-vehicle theft rate in 2020: 111 incidents per 100,000 people (num. 301 of 389 U.S. metro areas)
- Total, known motor-vehicle thefts in 2022: 239 (num. 284 of 389 U.S. metro areas)
- Total, known motor-vehicle thefts in 2020: 134 (num. 333 of 389 U.S. metro areas)
9. Pueblo, CO
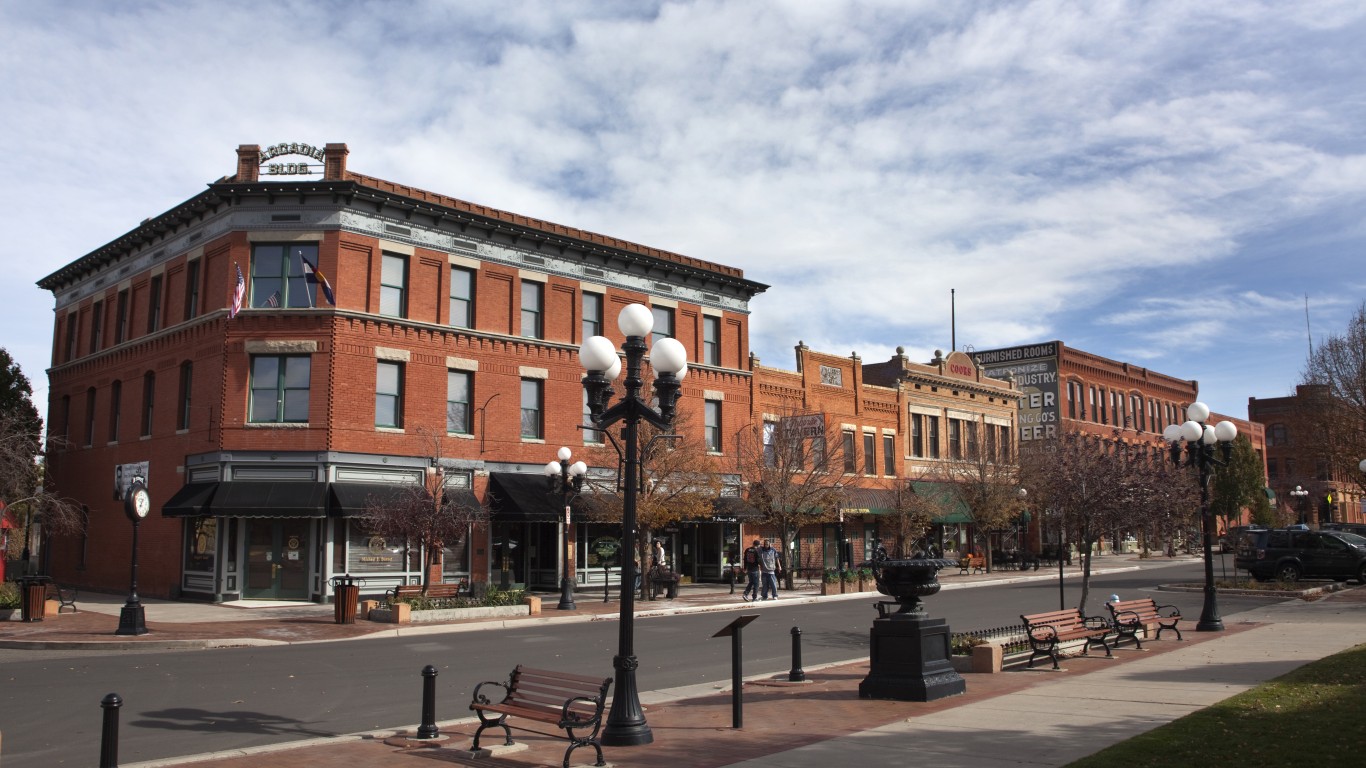
- Change in motor vehicle thefts from 2020 to 2022: +80.1% (+819 incidents)
- Motor-vehicle theft rate in 2022: 1,086 incidents per 100,000 people (num. 1 of 389 U.S. metro areas)
- Motor-vehicle theft rate in 2020: 602 incidents per 100,000 people (num. 7 of 389 U.S. metro areas)
- Total, known motor-vehicle thefts in 2022: 1,842 (num. 81 of 389 U.S. metro areas)
- Total, known motor-vehicle thefts in 2020: 1,023 (num. 128 of 389 U.S. metro areas)
8. Memphis, TN-MS-AR

- Change in motor vehicle thefts from 2020 to 2022: +81.5% (+5,058 incidents)
- Motor-vehicle theft rate in 2022: 846 incidents per 100,000 people (num. 4 of 389 U.S. metro areas)
- Motor-vehicle theft rate in 2020: 460 incidents per 100,000 people (num. 27 of 389 U.S. metro areas)
- Total, known motor-vehicle thefts in 2022: 11,267 (num. 23 of 389 U.S. metro areas)
- Total, known motor-vehicle thefts in 2020: 6,209 (num. 32 of 389 U.S. metro areas)
7. Greeley, CO
- Change in motor vehicle thefts from 2020 to 2022: +87.6% (+964 incidents)
- Motor-vehicle theft rate in 2022: 589 incidents per 100,000 people (num. 9 of 389 U.S. metro areas)
- Motor-vehicle theft rate in 2020: 329 incidents per 100,000 people (num. 73 of 389 U.S. metro areas)
- Total, known motor-vehicle thefts in 2022: 2,064 (num. 76 of 389 U.S. metro areas)
- Total, known motor-vehicle thefts in 2020: 1,100 (num. 116 of 389 U.S. metro areas)
6. Williamsport, PA
- Change in motor vehicle thefts from 2020 to 2022: +100.0% (+38 incidents)
- Motor-vehicle theft rate in 2022: 67 incidents per 100,000 people (num. 360 of 389 U.S. metro areas)
- Motor-vehicle theft rate in 2020: 34 incidents per 100,000 people (num. 382 of 389 U.S. metro areas)
- Total, known motor-vehicle thefts in 2022: 76 (num. 367 of 389 U.S. metro areas)
- Total, known motor-vehicle thefts in 2020: 38 (num. 383 of 389 U.S. metro areas)
5. Ithaca, NY
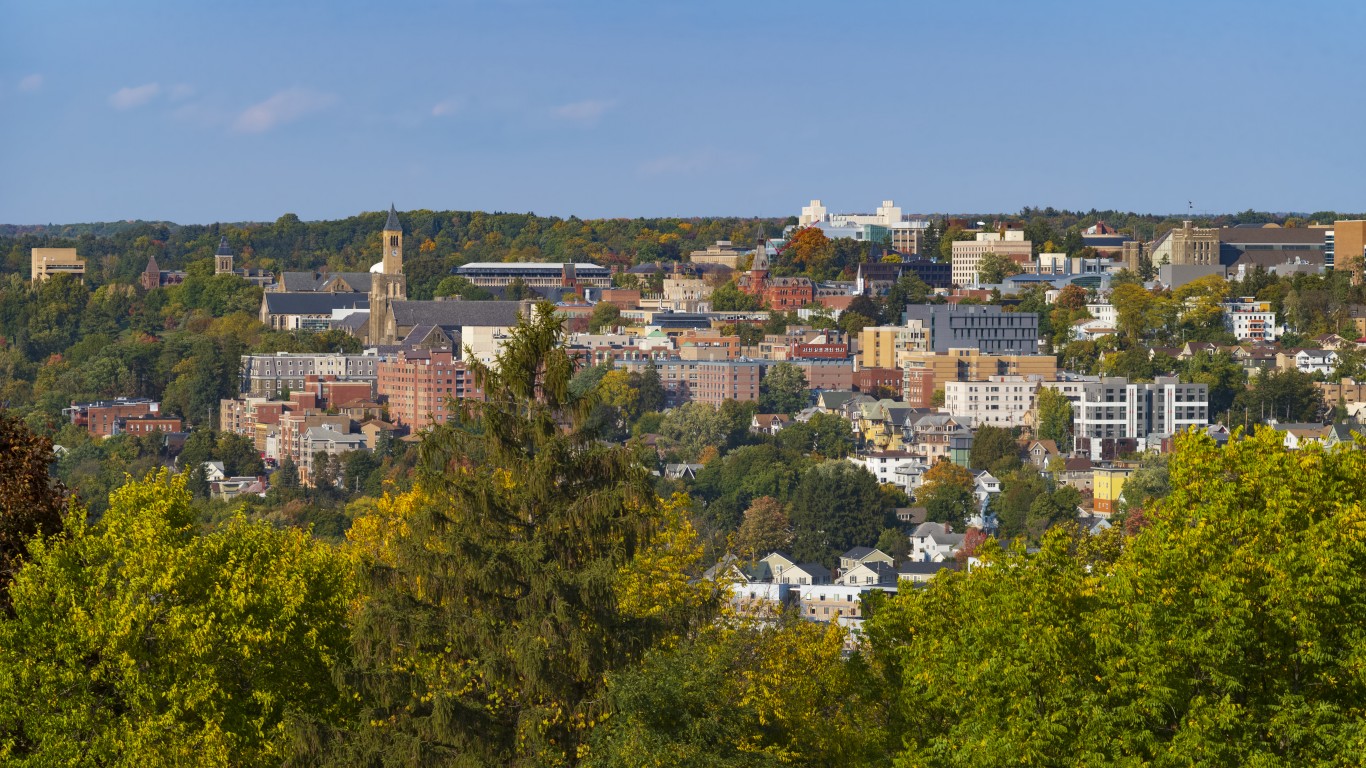
- Change in motor vehicle thefts from 2020 to 2022: +103.4% (+30 incidents)
- Motor-vehicle theft rate in 2022: 56 incidents per 100,000 people (num. 370 of 389 U.S. metro areas)
- Motor-vehicle theft rate in 2020: 29 incidents per 100,000 people (num. 383 of 389 U.S. metro areas)
- Total, known motor-vehicle thefts in 2022: 59 (num. 376 of 389 U.S. metro areas)
- Total, known motor-vehicle thefts in 2020: 29 (num. 387 of 389 U.S. metro areas)
4. Bremerton-Silverdale-Port Orchard, WA

- Change in motor vehicle thefts from 2020 to 2022: +136.1% (+750 incidents)
- Motor-vehicle theft rate in 2022: 469 incidents per 100,000 people (num. 32 of 389 U.S. metro areas)
- Motor-vehicle theft rate in 2020: 202 incidents per 100,000 people (num. 194 of 389 U.S. metro areas)
- Total, known motor-vehicle thefts in 2022: 1,301 (num. 103 of 389 U.S. metro areas)
- Total, known motor-vehicle thefts in 2020: 551 (num. 190 of 389 U.S. metro areas)
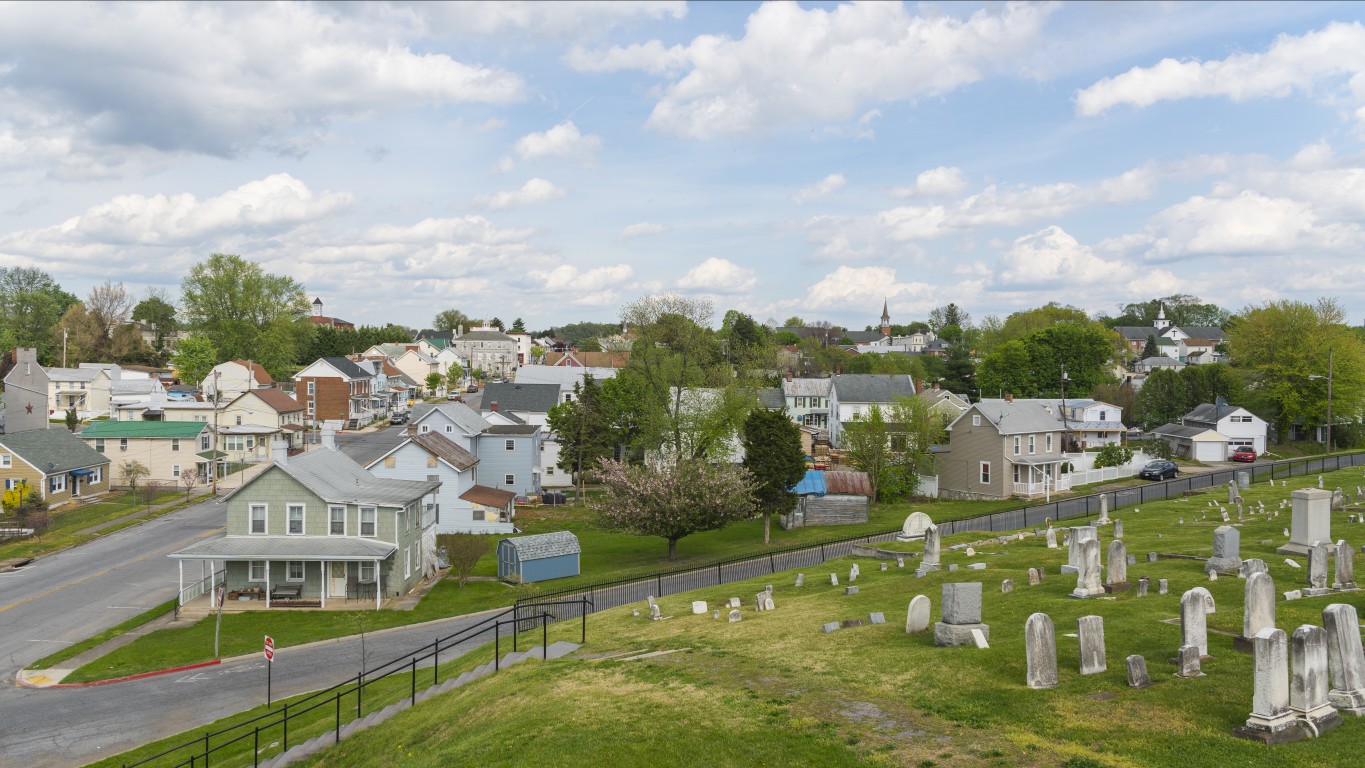
3. Lebanon, PA

- Change in motor vehicle thefts from 2020 to 2022: +178.4% (+66 incidents)
- Motor-vehicle theft rate in 2022: 72 incidents per 100,000 people (num. 357 of 389 U.S. metro areas)
- Motor-vehicle theft rate in 2020: 26 incidents per 100,000 people (num. 385 of 389 U.S. metro areas)
- Total, known motor-vehicle thefts in 2022: 103 (num. 352 of 389 U.S. metro areas)
- Total, known motor-vehicle thefts in 2020: 37 (num. 385 of 389 U.S. metro areas)
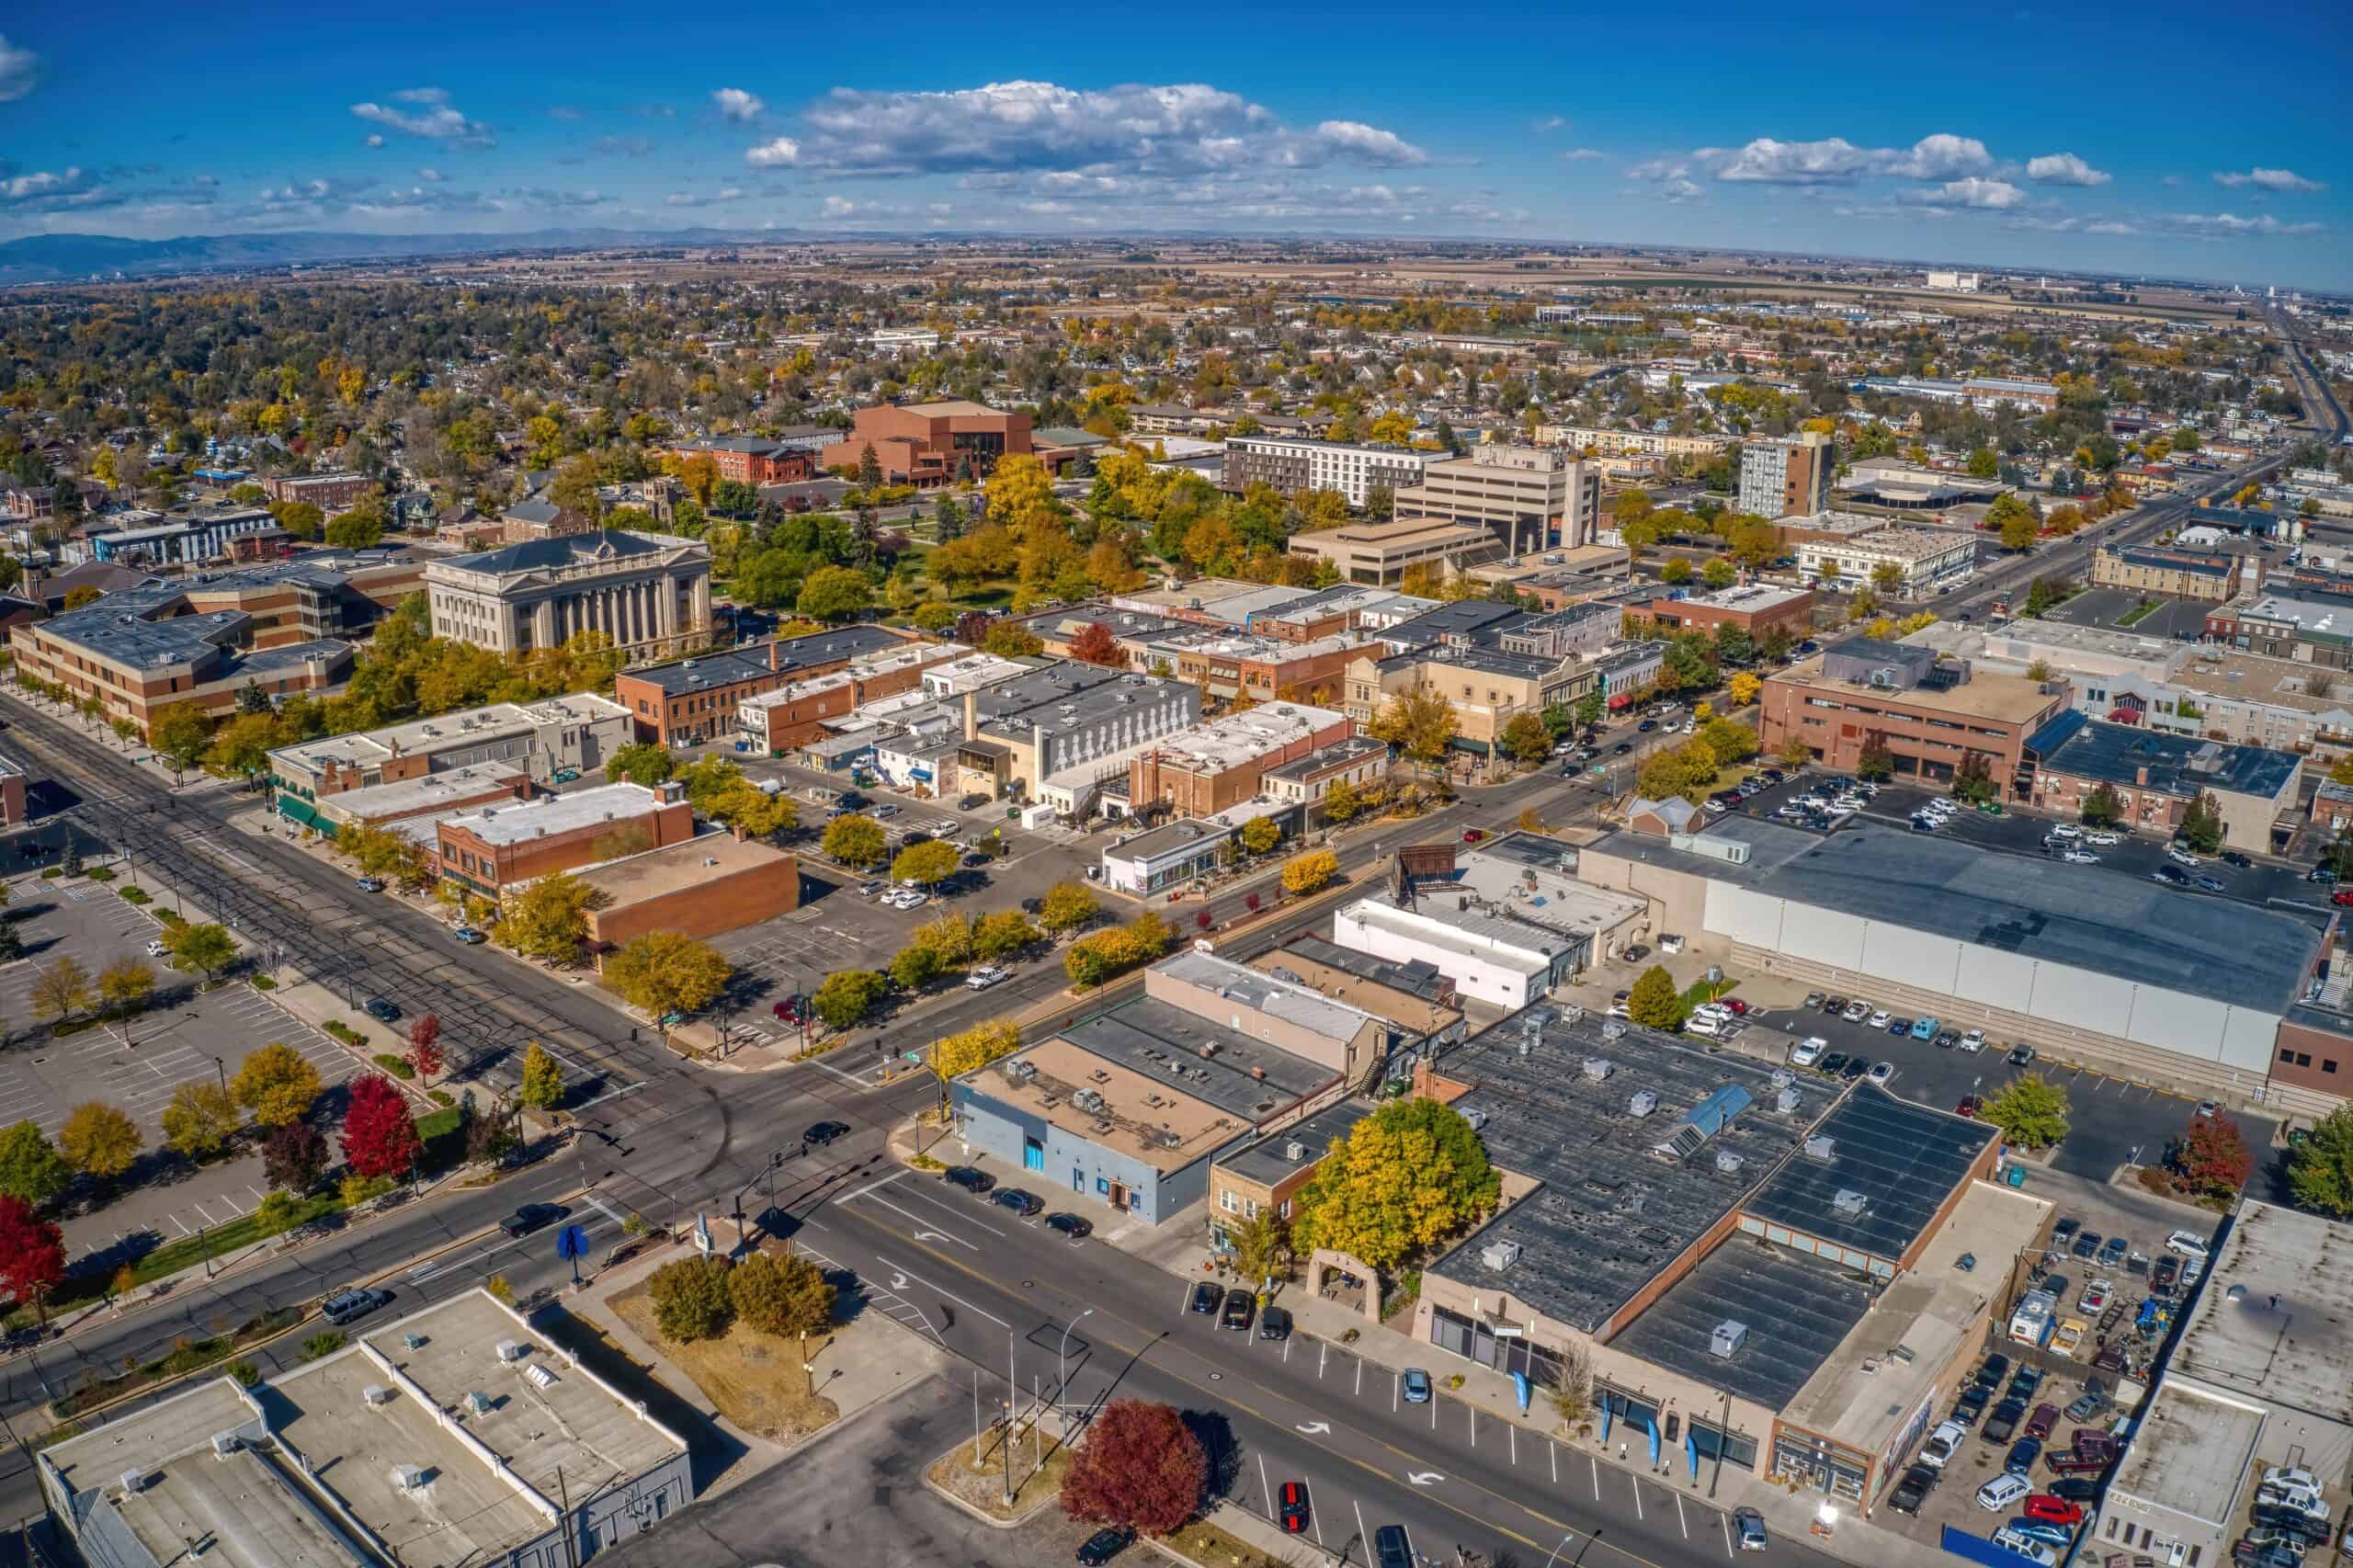
2. Kennewick-Richland, WA
- Change in motor vehicle thefts from 2020 to 2022: +188.6% (+1,105 incidents)
- Motor-vehicle theft rate in 2022: 543 incidents per 100,000 people (num. 15 of 389 U.S. metro areas)
- Motor-vehicle theft rate in 2020: 193 incidents per 100,000 people (num. 206 of 389 U.S. metro areas)
- Total, known motor-vehicle thefts in 2022: 1,691 (num. 86 of 389 U.S. metro areas)
- Total, known motor-vehicle thefts in 2020: 586 (num. 180 of 389 U.S. metro areas)
1. Burlington-South Burlington, VT
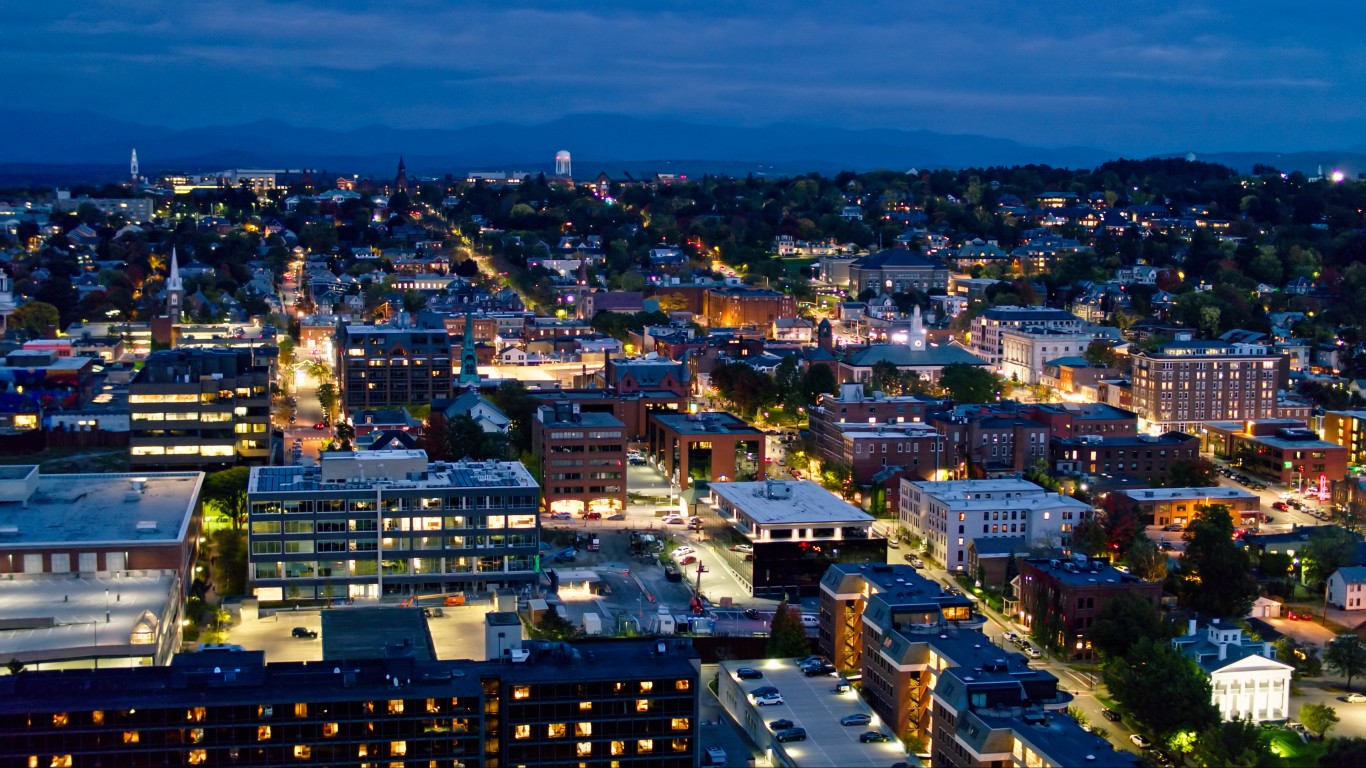
- Change in motor vehicle thefts from 2020 to 2022: +230.3% (+426 incidents)
- Motor-vehicle theft rate in 2022: 269 incidents per 100,000 people (num. 125 of 389 U.S. metro areas)
- Motor-vehicle theft rate in 2020: 84 incidents per 100,000 people (num. 336 of 389 U.S. metro areas)
- Total, known motor-vehicle thefts in 2022: 611 (num. 182 of 389 U.S. metro areas)
- Total, known motor-vehicle thefts in 2020: 185 (num. 306 of 389 U.S. metro areas)
It’s Your Money, Your Future—Own It (sponsor)
Retirement can be daunting, but it doesn’t need to be.
Imagine having an expert in your corner to help you with your financial goals. Someone to help you determine if you’re ahead, behind, or right on track. With SmartAsset, that’s not just a dream—it’s reality. This free tool connects you with pre-screened financial advisors who work in your best interests. It’s quick, it’s easy, so take the leap today and start planning smarter!
Don’t waste another minute; get started right here and help your retirement dreams become a retirement reality.
Thank you for reading! Have some feedback for us?
Contact the 24/7 Wall St. editorial team.

Our expert who first called NVIDIA in 2009 is predicting 2025 will see a historic AI breakthrough.
You can follow him investing $500,000 of his own money on our top AI stocks for free.