An issue that remains in place is that U.S. wholesale inventories are generally running a bit heavier than compared to 2014. Higher inventories can act as a “planning ahead for stronger growth” in good times, but in times of stagnation or in times of uncertainty those higher inventories can crimp future monthly production and expectations for new job hires.
Factory inventories in July were down by 0.1% to $584.3 billion in a seasonally adjusted reading. Sales were shown to be down 0.3% at $449.5 billion from June, but the level was actually down 4.2% from the July 2014 level.
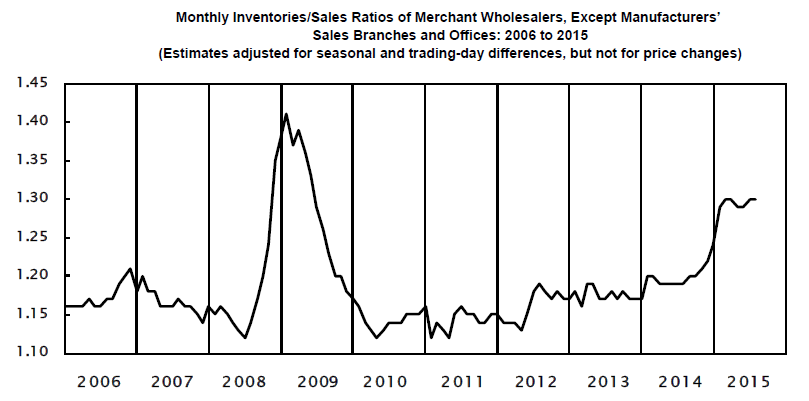
The important stock-to-sales ratio was left unchanged at 1.30 in July. If you want proof that inventories are far higher than 2014, the stock-to-sales reading for July last year was 1.19. The graph included below is far higher than the post-recession recovery.
Additional data was as follows on a monthly basis, July versus June:
- Sales of machinery, equipment and supplies were up 5.2%.
- Computer and peripheral equipment sales were up 3.2%.
- Sales of nondurable goods were down 1.7%.
- Sales of petroleum and petroleum products were down a sharp 8.2% from just the prior month.
- Farm product raw materials sales were down 2.2%.
ALSO READ: America’s Fastest Growing Jobs
The graph below should show just how bad that stock-to-sales ratio (meaning higher inventories than sales) has been trending.