Death and taxes are two things proven to be impossible to avoid. It turns out that the tally of state and local taxes continues to rise in America. A new feature report from the Census Bureau showed that taxes as a whole were up 6.9% to $339.2 billion in all state and local taxes in the second quarter of 2015. This second-quarter view matters more than any other quarter because this is when so many taxes are filed, paid and collected.
The Census data measured the four largest tax categories in the second quarter of 2015. This $339.2 billion total compared to $317.2 billion in the second quarter of 2014. All four major groups saw tax revenues rise at the state and local level: individual income tax, general sales tax, corporate income tax and property tax revenues.
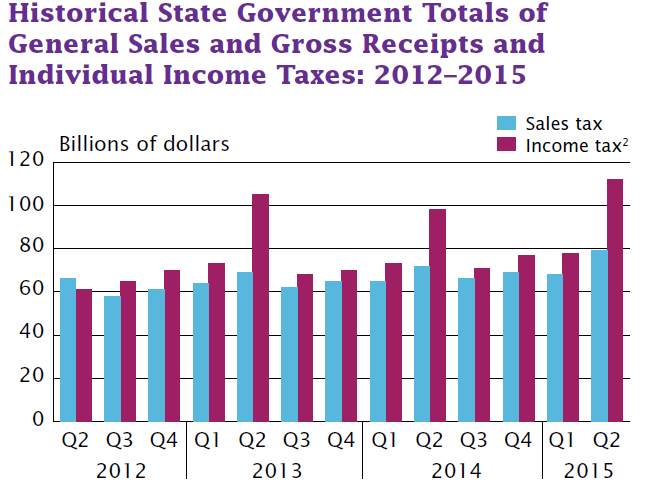
Individual income tax collections at the state and local level combined were $121.7 billion in the second quarter. That figure was up 13.8% from a year earlier. General sales and gross receipts tax revenues were up 3.9% to $99.9 billion. Corporation net income tax rose by 7.5% to $21.4 billion. State and local collections in property tax rose just over 2% to $96.2 billion, although it was referred to as being “not statistically different.” Local governments collected $92.4 billion of the total property taxes.
When it comes to total state collection, the Census said the following:
Total state tax revenue rose 6.1 percent to $274.4 billion in the second quarter, from $258.6 billion reported in the same quarter of the prior year. Individual income tax, at $111.5 billion, is up 13.4 percent from the same quarter of 2014. The second largest category of state tax revenue, general sales and gross receipts taxes, accounted for $79.5 billion, an increase of 2.9 percent from the same quarter in 2014. At $18.4 billion, corporation net income tax collections increased 6.1 percent from the same quarter in 2014.
ALSO READ: America’s Richest (and Poorest) States
A breakdown of the total state tax revenue, by each category’s share of taxes, was as follows:
- Individual income tax was 40.6% of all taxes.
- General sales and gross receipts taxes were 29.0% of all taxes.
- Corporate net income tax was 6.7% of all taxes.
- Property tax was 1.4% of all taxes.
- Other miscellaneous tax revenue was the remaining 22.3%.
As it is, income taxes and sales taxes hit every U.S. consumer, regardless of home ownership. The chart below shows the Census trends at the state level for general sales and gross receipts and also for individual income tax in the years 2012 to 2015.
There are always exceptions and special considerations that have to be considered in any group of statistics. That being said, it is puzzling that sales and gross receipts taxes and personal income taxes are rising when you keep hearing over and over that wages are not rising.
ALSO READ: 9 Simple Ways to Save Money Dining Out
Get Ready To Retire (Sponsored)
Start by taking a quick retirement quiz from SmartAsset that will match you with up to 3 financial advisors that serve your area and beyond in 5 minutes, or less.
Each advisor has been vetted by SmartAsset and is held to a fiduciary standard to act in your best interests.
Here’s how it works:
1. Answer SmartAsset advisor match quiz
2. Review your pre-screened matches at your leisure. Check out the advisors’ profiles.
3. Speak with advisors at no cost to you. Have an introductory call on the phone or introduction in person and choose whom to work with in the future
Thank you for reading! Have some feedback for us?
Contact the 24/7 Wall St. editorial team.


