24/7 Wall St. has released its annual analysis of America’s Richest (and Poorest) States. Mississippi was at the bottom of the list.
According to the report:
The U.S. Census Bureau released on Wednesday new data from its 2015 nationwide population survey. According to the annual survey, the national median household income rose to $55,775 in 2015. No state reported income declines. While 39 states reported significant increases in household income, income levels in 11 states remained the same.
24/7 Wall St. ranked all 50 states according to the newly released median household income figures. Annual income levels range from $75,847 in Maryland to $40,593 in Mississippi.
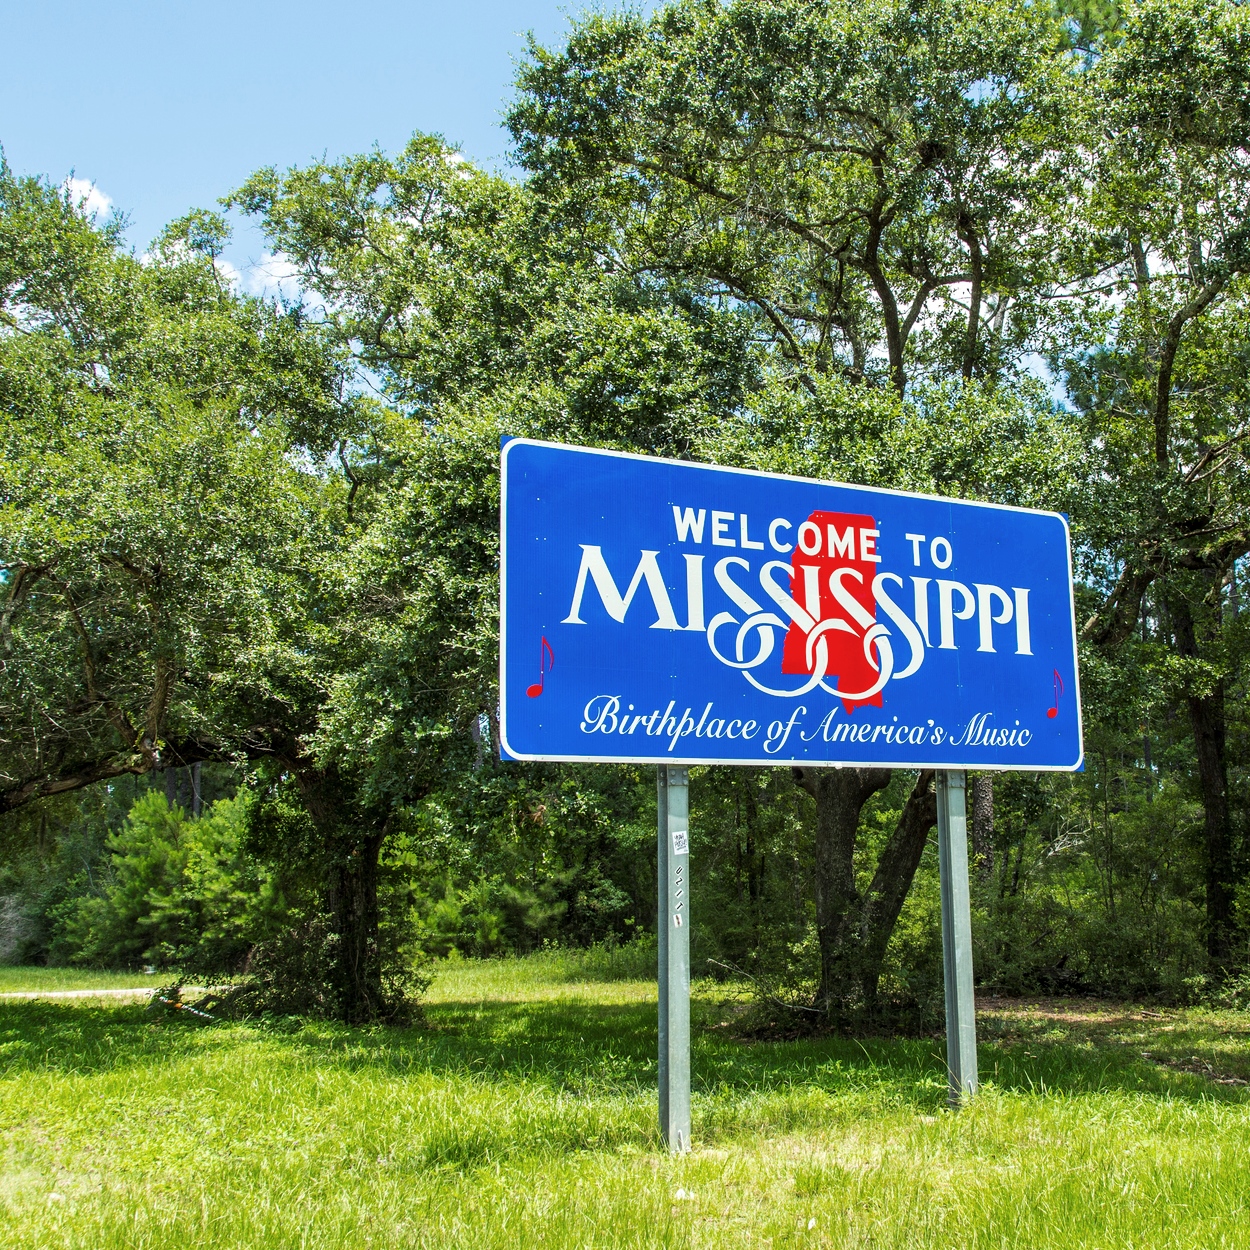
Regarding Mississippi specifically:
> Median household income: $40,593
> Population: 2,992,333 (19th lowest)
> 2015 Unemployment rate: 6.5% (4th highest)
> Poverty rate: 22.0% (the highest)With 2015 median household income unchanged from 2014, Mississippi is once again the poorest state in the country. The typical Mississippi household earned $40,593 last year, well below the national median income of $55,775. Mississippi also has the highest poverty rate in the country, with 22.0% of residents living below the poverty line. A relatively large share of state households are very poor. Some 11.5% earn $10,000 or less annually, the highest extreme poverty rate of any state. Similarly, there are relatively few affluent households in the state. Only 2.1% of Mississippi households earn $200,000 or more a year, the lowest such share.
The methodology:
To identify the richest and poorest states with the highest and lowest median household income, 24/7 Wall St. reviewed state data on income from the U.S. Census Bureau’s 2015 American Community Survey (ACS). Median household income for all years is adjusted for inflation. Data on health insurance coverage, employment by industry, food stamp recipiency, poverty, and income inequality also came from the 2015 ACS. Income inequality is measured by the Gini coefficient, which is scaled from 0 to 1, with 0 representing perfect equality and 1 representing total inequality. We also reviewed annual average unemployment data from the Bureau of Labor Statistics (BLS) for 2014 and 2015.
See all of America’s richest and poorest states.
100 Million Americans Are Missing This Crucial Retirement Tool
The thought of burdening your family with a financial disaster is most Americans’ nightmare. However, recent studies show that over 100 million Americans still don’t have proper life insurance in the event they pass away.
Life insurance can bring peace of mind – ensuring your loved ones are safeguarded against unforeseen expenses and debts. With premiums often lower than expected and a variety of plans tailored to different life stages and health conditions, securing a policy is more accessible than ever.
A quick, no-obligation quote can provide valuable insight into what’s available and what might best suit your family’s needs. Life insurance is a simple step you can take today to help secure peace of mind for your loved ones tomorrow.
Click here to learn how to get a quote in just a few minutes.
Thank you for reading! Have some feedback for us?
Contact the 24/7 Wall St. editorial team.
Latest from 24/7


Our expert who first called NVIDIA in 2009 is predicting 2025 will see a historic AI breakthrough.
You can follow him investing $500,000 of his own money on our top AI stocks for free.