Economy
American Household Debt Almost Back at Pre-Recession Levels

Published:
Last Updated:

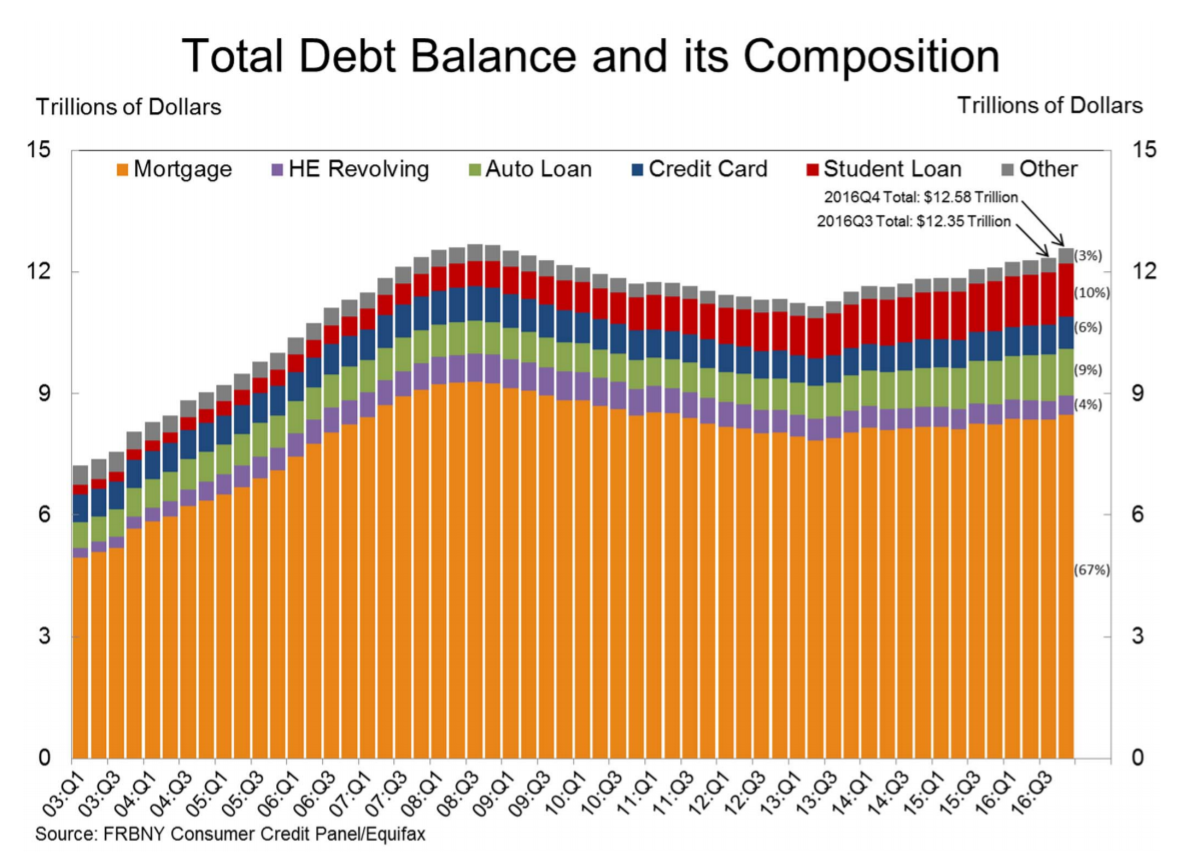
The Federal Reserve Bank of New York’s Center for Microeconomic Data has released its reading for the level of household debt for the fourth quarter of 2016. As the headline suggests, the debt levels keep rising. Top drivers were shown to be auto debt, credit card debt levels and rising student debt.
Total household debt in the fourth quarter of 2016 was up 1.8%, or by $226 billion, reaching a level $12.58 trillion. What should stand out about this report is that this is a mere $99 billion under the peak household debt that was hit in the third quarter of 2008. In percentages, that is just 0.8% shy of the record.
Debt levels rose across all debt products. The New York Fed showed that there was a 1.6% rise in mortgage balances, but that was the smallest of the group. Debt balances rose by 1.9% in auto loans, rose by 2.4% on student debt balances and rose 4.3% on credit card balances.
Mortgage balances are understandably the largest component of household debt. This was up $130 billion at $8.48 trillion at the end of 2016 versus the prior quarter. The balances on home equity lines of credit were almost flat, having risen just $1 billion to $473 billion. Mortgage originations were $617 billion, the highest level since the beginning of the Great Recession.
The non-house debt gains (auto, credit card, student) in the fourth quarter were broken out individually. These were shown as follows:
Then there is the delinquency rate issue, and it was mostly stable. As of December 31st, some 4.8% of outstanding debt was in some stage of delinquency. And of that $607 billion of debt that is considered to be in some stage of delinquency, some $412 billion was said to be seriously delinquent of being at least 90 days late or “severely derogatory.”
The New York Fed also reported that roughly 204,000 consumers had a bankruptcy notation added to their credit reports in the fourth quarter of 2016. That was down 4% from the end of 2015 and was said to be a new series low. Roughly 79,000 individuals had a new foreclosure notation added to their credit reports during the fourth quarter of 2016.
If you were curious about how your own credit score stacks up against the rest of the country, the credit scores remain quite high. The statement on credit score metrics said:
The distribution of the credit scores of newly originating auto and mortgage loan borrowers tightened a bit, with the median score for originating borrowers for auto loans ticking up to 700, and the median origination score for mortgages increasing to 763. About 58% of new mortgages went to borrowers with credit scores over 760 during 2016, compared with an average of 54% in 2015. The origination volumes for auto loans do reflect a slight tightening, with 32% of dollars originated to borrowers with credit scores over 760 in the fourth quarter, compared to only 29% for the first 3 quarters of 2016.
A bar chart from the New York Federal Reserve Bank has been included below.

The last few years made people forget how much banks and CD’s can pay. Meanwhile, interest rates have spiked and many can afford to pay you much more, but most are keeping yields low and hoping you won’t notice.
But there is good news. To win qualified customers, some accounts are paying almost 10x the national average! That’s an incredible way to keep your money safe and earn more at the same time. Our top pick for high yield savings accounts includes other benefits as well. You can earn up to 3.80% with a Checking & Savings Account today Sign up and get up to $300 with direct deposit. No account fees. FDIC Insured.
Click here to see how much more you could be earning on your savings today. It takes just a few minutes to open an account to make your money work for you.
Thank you for reading! Have some feedback for us?
Contact the 24/7 Wall St. editorial team.