Economy
The Recent Rebound in Prime-Age Labor Force Participation

Published:
Last Updated:

By Audrey Breitwieser, Ryan Nunn, and Jay Shambaugh of the Brookings Institution’s Hamilton Project
Over the last three years, amid a strengthening labor market, the prime-age (25- to 54-year-old) labor force participation rate has increased. The participation rate, 82.0 percent as of June 2018, is now close to recovering entirely from its cyclical downturn following the Great Recession. This comes after a decades-long decline in male prime-age participation and a 15-year slide in female prime-age participation.
Continued improvements in labor force participation rates in the next few months will be crucial to determining whether recent progress constitutes merely a rebound from a cyclical low or an actual reversal of the downward trend—a distinction that is critical to long-run growth and current macroeconomic policymaking.
Trends in Labor Force Participation
Labor force participation of workers 16 and older in the United States has steadily declined since the turn of the century, from just above 67 percent to a low of below 63 percent. Coming on the heels of a decades-long increase in participation, fueled by the entry of many women into the workforce, this decline has concerned many economists and policymakers who recognize the close link between labor force participation and economic growth.
Much of the post-2000 decline is attributable to population aging: an increasing share of Americans are senior citizens. But even when focusing on those between the ages of 25 and 54, the labor force participation rate had declined by more than three percentage points from 2000 to 2015. Men and women experienced remarkably similar declines during this period. Prior Hamilton Project analysis documented the fall in participation across women of all demographic groups, noting the departure from trends seen in other major economies (Japan being the most striking example).
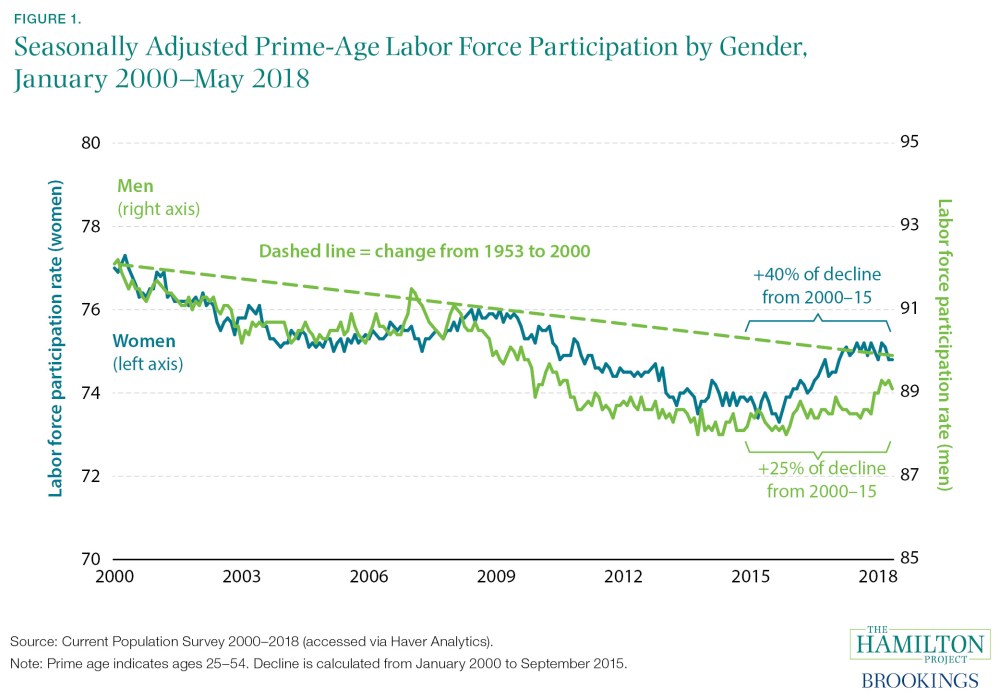
However, after unemployment reached low levels in September 2015, U.S. prime-age labor force participation has sharply rebounded. Both women and men have experienced considerable increases in their prime-age participation rates (see figure 1), though women’s rebound started earlier and has been somewhat larger. The changing age distribution within the 25- to 54-year-old group has contributed slightly to the rebound, adding 0.1 percentage points since 2015.
Measured against the January 2000 level of 77.0 percent, prime-age women have now made up 40 percent of their 2000–15 decline. Prime-age men made up 25 percent of their 2000-15 decline from an initial level of 92.1 percent.

Figure 1 also shows the 1953–2000 trend decline (the dashed line) in men’s labor force participation rate, anchored to the actual rate in January 2000. Even after the recent rebound, men’s participation has underperformed the trend, while women’s participation has almost exactly followed the trend.
What does this recent increase mean for estimates of the trend in participation? Should the 2015–18 rebound cause researchers to reevaluate their assessment of the long-term downward trend in labor force participation?
Separating the post-2008 decline into the short-run effect of the recession and the long-run trend decline is the focus of an active debate, with most estimates suggesting considerable uncertainty about this decomposition. The fact that there has been a sizable rebound in the last three years as the labor market has healed suggests a large portion may have been due to the recession. Even the decline since 2000 may be in part due to a weak labor market, as the recovery from the 2001 recession was weak and the Great Recession began before a full recovery of the labor market.
As the labor market has tightened—the national unemployment rate now stands at an unusually low 4.0 percent—employers have become eager to find workers, drawing many away from the sidelines of the labor market. The overall participation rate for workers 16 and older is largely back to pre-crisis levels after adjusting for demographic shocks, but in part this is due to an increase in participation by older workers (consistent with improved health and longevity as well as changes to Social Security rules).
Prime-age labor force participation, though, is still below both the 2007 level and the long-run trend. This suggests there may still be some room for participation to continue to increase based on cyclical factors alone. And, as noted, women’s participation has been rising in other countries, suggesting female prime-age participation may have more room to climb as well.
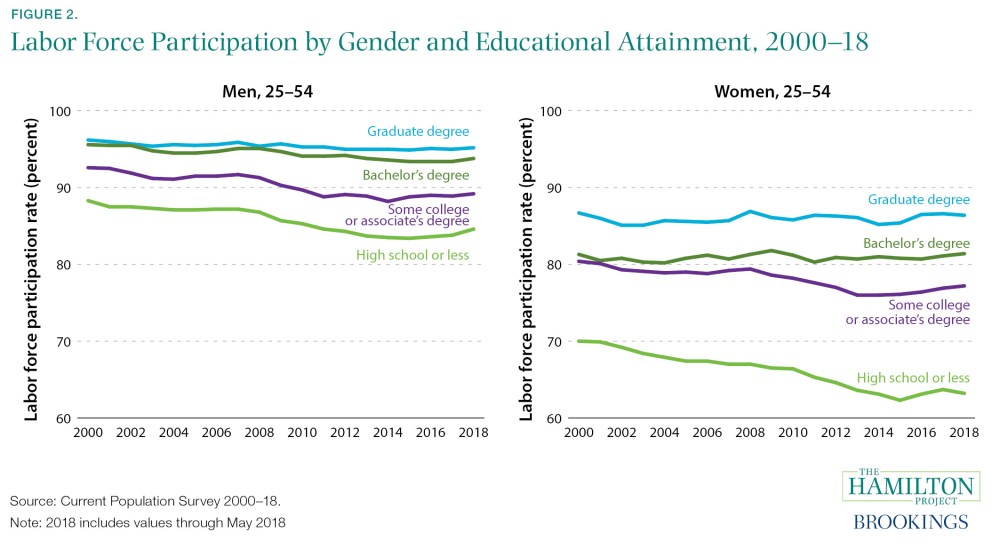
To better understand what has happened with prime-age participation since 2015, we look at labor force participation trends by gender and educational attainment. Indeed, the post-2000 decline—and subsequent rebound—has looked different for different groups.
Between 2000 and 2015, labor force participation rates for people with less education fell more than for people with more education. During this period, the labor force participation rates of men and women with some college or less fell by 4.4 and 5.5 percentage points, respectively. By the same token, the 2015-18 rebound has been strongest for the same groups, at 0.9 and 1.1 percentage points for men and women, respectively.
It thus appears there is relatively little hangover from the recession for the most-educated workers, but considerable room to increase labor force participation for lower-skill workers, possibly by increasing their skills or by increasing the returns to low-education jobs. As shown by Jared Bernstein in a Hamilton Project proposal, tight labor markets seem to disproportionately boost the returns to work of low-wage workers, so continued labor market strength may help bring more of these workers back.

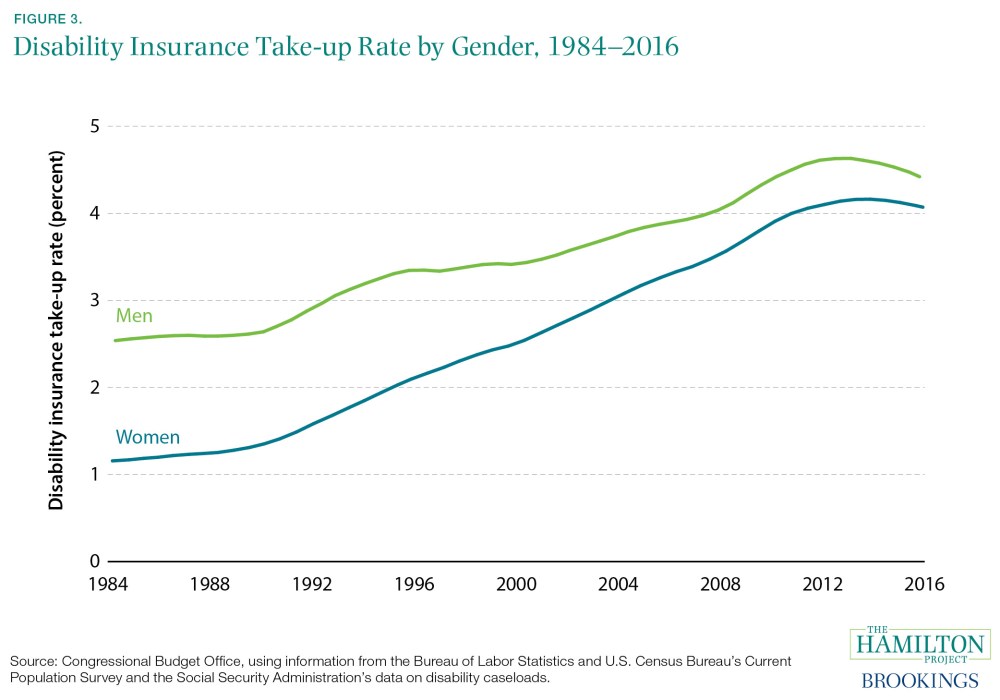
The recent decline in take-up of disability insurance can be viewed as supporting Bernstein’s take on tight labor markets. People outside the labor force have a number of reasons for not working, but disability accounts for almost one-third of prime-age nonparticipation. Disability caseloads are therefore informative about an important piece of the participation puzzle.
As shown below, caseloads peaked (as a fraction of the 18–64 population) in 2013 and then fell 0.17 and 0.05 percentage points for men and women, respectively.

Given that take-up of disability benefits depends in part on wages and other labor market conditions, the recent decline in disability caseloads may be driven by the same forces that are affecting labor force participation.
It is important to recall, though, that there are barriers to work for many of those outside the labor force. Almost 30 percent of prime-age nonparticipants list a disability as a barrier to their participation. Though it is clear from the figure above that most of the post-recession increase in disability caseloads has gone away, there are still large numbers of working-age Americans on disability rolls, and there are important barriers to labor force participation that go beyond labor market slack.
More than half of prime-age women outside the paid labor force—and over one-third of the overall prime-age non-participators—list caregiving as their reason for nonparticipation. Without child care or elder care, it would not be possible to increase these peoples’ participation.
For living standards to rise over time, either productivity must rise or the number of hours worked must increase. Through the second channel, the labor force participation rate has a direct impact on per capita income. It is therefore a welcome development that the drop in prime-age participation after 2008 has been partially erased. Looking forward, the vital question is whether participation will resume a long-term downward trend or whether a booming economy can continue to draw workers into the labor force.
Credit card companies are at war. The biggest issuers are handing out free rewards and benefits to win the best customers.
It’s possible to find cards paying unlimited 1.5%, 2%, and even more today. That’s free money for qualified borrowers, and the type of thing that would be crazy to pass up. Those rewards can add up to thousands of dollars every year in free money, and include other benefits as well.
We’ve assembled some of the best credit cards for users today. Don’t miss these offers because they won’t be this good forever.
Flywheel Publishing has partnered with CardRatings for our coverage of credit card products. Flywheel Publishing and CardRatings may receive a commission from card issuers.
Thank you for reading! Have some feedback for us?
Contact the 24/7 Wall St. editorial team.