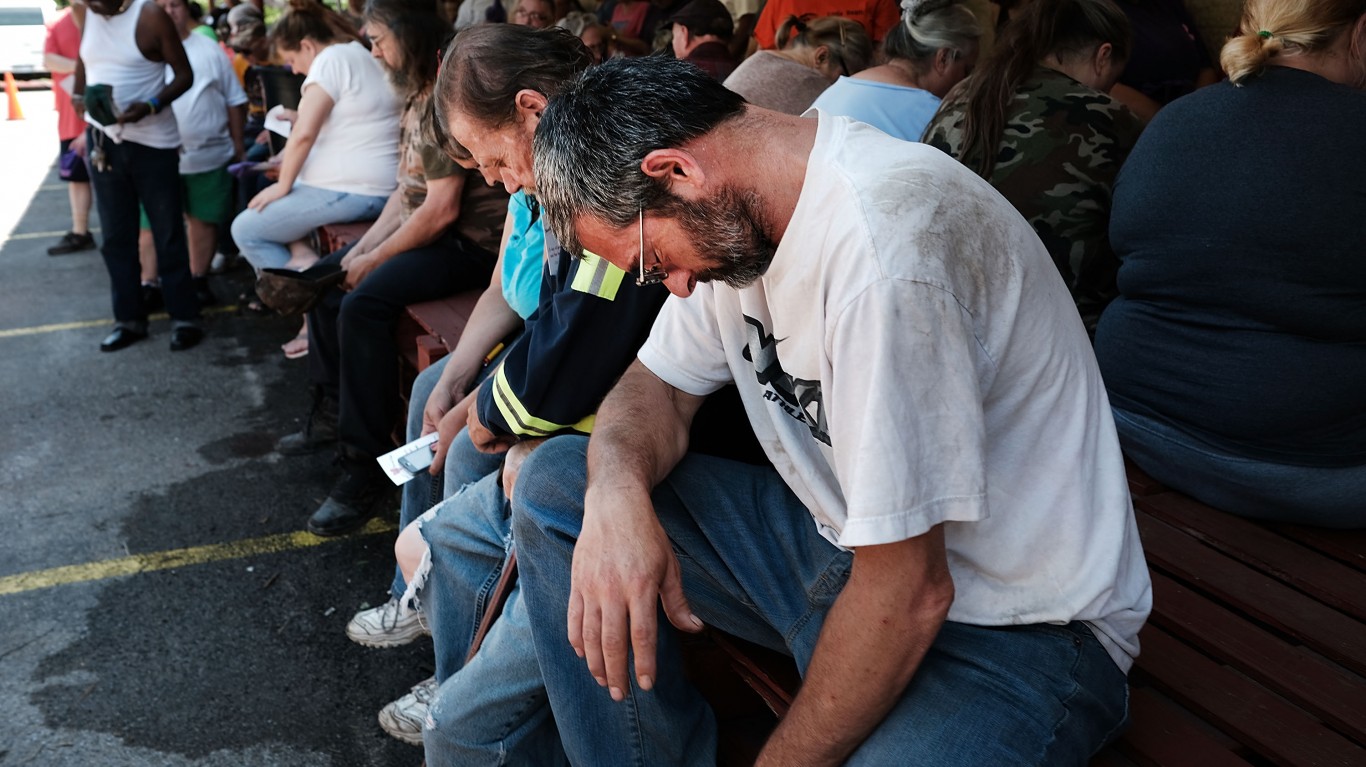
The poverty rate in America was 11.4% in 2020, according to the Census Bureau. That was one percentage point higher than in 2019. The bureau added that 37.3 million Americans lived in poverty last year. That was up by 3.3 million from the year before. The Supplemental Poverty rate, on the other hand, fell by 2.3 percentage points to 9.1%. The rate is calculated by “post-tax income that include stimulus payments.”
Most government agencies look at key employment numbers by state and by city. Recently, to get figures that do not include the effects of COVID-19 on the economy, some of this analysis has made adjustments. That is fair enough because the recession brought on by the spread of the virus was a once-in-a-century event.
Self has looked at poverty patterns in a study titled “Mapping Poverty: The Poverty Rates in Each U.S. State Over Time.” In its research paper, it looked at COVID-19, groups hit hardest by poverty and poverty by age, gender and race. Most of the data were from the Census Bureau, supplemented by data from Dqudj.com.
Among the other figures analyzed, the researchers looked at the poverty rate in each state in both 2019 and 2020. They also looked at the change in median income for each of the years. They summarized their approach thus:
Using U.S. Census data, we analyzed the poverty rates in each state over time to find out which states have seen the highest and lowest poverty rates historically. This allowed us to establish which ones have been hit the most financially by the pandemic.
Interestingly, there was not much of a pattern. Small states geographically and many that are sparsely populated tended to be high on the lists of states where poverty rose the most. New Hampshire, usually a state with very low unemployment and high median income, topped the list. The poverty rate moved from 3.7% to 6.2%, an increase of 67.57%. The median household income in New Hampshire is one of the highest among all states at $86,800.
These are the 10 states where poverty is rising most:
| State | In Poverty in 2020 | Change |
|---|---|---|
| New Hampshire | 6.20% | +67.57% |
| Delaware | 10.50% | +61.54% |
| Minnesota | 8.40% | +47.37% |
| Oklahoma | 15.50% | +43.52% |
| Connecticut | 11.20% | +34.94% |
| District of Columbia | 16.70% | +33.60% |
| North Dakota | 10.70% | +32.10% |
| Maryland | 9.20% | +31.43% |
| Alaska | 13.30% | +30.39% |
| New Jersey | 8.20% | +30.16% |
Click here to see which is the poorest city in each state.
The Average American Has No Idea How Much Money You Can Make Today (Sponsor)
The last few years made people forget how much banks and CD’s can pay. Meanwhile, interest rates have spiked and many can afford to pay you much more, but most are keeping yields low and hoping you won’t notice.
But there is good news. To win qualified customers, some accounts are paying almost 10x the national average! That’s an incredible way to keep your money safe and earn more at the same time. Our top pick for high yield savings accounts includes other benefits as well. You can earn up to 3.80% with a Checking & Savings Account today Sign up and get up to $300 with direct deposit. No account fees. FDIC Insured.
Click here to see how much more you could be earning on your savings today. It takes just a few minutes to open an account to make your money work for you.
Our top pick for high yield savings accounts includes other benefits as well. You can earn up to 4.00% with a Checking & Savings Account from Sofi. Sign up and get up to $300 with direct deposit. No account fees. FDIC Insured.
Thank you for reading! Have some feedback for us?
Contact the 24/7 Wall St. editorial team.


