JD Vance formally accepted the Republican vice-presidential nomination on Wednesday. The first-term senator from Ohio introduced himself to the country as Donald Trump’s running mate at the Republican National Convention. In his speech, he shared the story of growing up in a struggling working-class family.
“I want to give my kids the things that I didn’t have when I was growing up,” Vance said. Indeed, practically all parents want that for their children and their family. And regardless of who ends up in the White House after the elections, Americans want to believe that the elected president would work hard to help them achieve that – albeit using different policies.
To find the best and worst states to raise a family, 24/7 Wall St. reviewed Birth Injury Lawyer Group’s report: The Best & Worst States in America to Raise a Family in 2024. To rank the state, the report uses 16 indicators across four categories: health & safety, education & child care, affordability, and socioeconomics. All scores are on a scale of 40 to 85. For each state we added the poverty rate, high school attainment rate, and the number of families from the Census Bureau’s 2022 American Community Survey. States are listed from worst to best.
Nevada ranks as the worst state to raise a family, followed by Louisiana and Mississippi. Nevada’s lowest category score is in socioeconomics, with a high unemployment rate and low credit score. There is also limited access to quality health care in the state, according to the report, and a high violent crime rate. Affordability is Nevada’s best scoring category, but while housing is relatively affordable, living costs are high. (Also see: This is the Worst State to Work in America.)
At the other end of the spectrum, Massachusetts ranks as the best state to raise a family, followed by Vermont and North Dakota. Massachusetts’ worst category is affordability, with high costs of living. Still, the relatively high wages alleviate the high costs and sallow families to afford living in a state that prioritizes children’s health, including low infant mortality, low child uninsured rate, and relatively many pediatricians. The state also has a good education system and ranks high in socioeconomics measures.
The state that excels in the health & safety category is Vermont, while Arkansas ranks last in the category. In education & childcare, Utah ranks the highest and West Virginia ranks last. North Dakota leads in affordability, a category in which Hawaii struggles and ranks last. Finally, Vermont also leads in socioeconomics, where Louisiana ranks worst.
Why this matters

50. Nevada: 49.57 (on 40-85 scale)

- Best category: Affordability at 60.5 (on 40-85 scale)
- Worst category: socioeconomics at 41.2 (on 40-85 scale)
- Poverty rate, 2022: 12.5% — 22nd highest
- High school attainment rate, 2022: 87.4% — 4th lowest
- No. of family households, 2022: 773,666 — 64.6% of all households
49. Louisiana: 52.37 (on 40-85 scale)
- Best category: Affordability at 78.2 (on 40-85 scale)
- Worst category: socioeconomics at 40.0 (on 40-85 scale)
- Poverty rate, 2022: 18.6% — 2nd highest
- High school attainment rate, 2022: 87.3% — 3rd lowest
- No. of family households, 2022: 1,131,137 — 62.3% of all households
48. Mississippi: 52.59 (on 40-85 scale)

- Best category: Affordability at 74.6 (on 40-85 scale)
- Worst category: Health & Safety at 44.2 (on 40-85 scale)
- Poverty rate, 2022: 19.1% — the highest
- High school attainment rate, 2022: 87.6% — 5th lowest
- No. of family households, 2022: 754,264 — 65.7% of all households
47. California: 53.87 (on 40-85 scale)

- Best category: Health & Safety at 65.4 (on 40-85 scale)
- Worst category: Education & Childcare at 43.5 (on 40-85 scale)
- Poverty rate, 2022: 12.2% — 23rd highest
- High school attainment rate, 2022: 84.7% — the lowest
- No. of family households, 2022: 9,150,804 — 67.5% of all households
46. Arkansas: 55.1 (on 40-85 scale)

- Best category: Affordability at 80.6 (on 40-85 scale)
- Worst category: Health & Safety at 40.0 (on 40-85 scale)
- Poverty rate, 2022: 16.8% — 5th highest
- High school attainment rate, 2022: 89.1% — 11th lowest
- No. of family households, 2022: 777,933 — 64.0% of all households
45. New Mexico: 55.8 (on 40-85 scale)
- Best category: Affordability at 74.0 (on 40-85 scale)
- Worst category: Education & Childcare at 42.5 (on 40-85 scale)
- Poverty rate, 2022: 17.6% — 4th highest
- High school attainment rate, 2022: 88.0% — 7th lowest
- No. of family households, 2022: 516,464 — 60.9% of all households
44. Texas: 56.04 (on 40-85 scale)
- Best category: Affordability at 77.2 (on 40-85 scale)
- Worst category: socioeconomics at 45.3 (on 40-85 scale)
- Poverty rate, 2022: 14.0% — 10th highest
- High school attainment rate, 2022: 86.1% — 2nd lowest
- No. of family households, 2022: 7,483,376 — 67.5% of all households
43. South Carolina: 56.31 (on 40-85 scale)

- Best category: Affordability at 67.0 (on 40-85 scale)
- Worst category: Education & Childcare at 50.8 (on 40-85 scale)
- Poverty rate, 2022: 14.0% — 11th highest
- High school attainment rate, 2022: 90.5% — 20th lowest
- No. of family households, 2022: 1,398,412 — 65.5% of all households
42. Arizona: 56.74 (on 40-85 scale)

- Best category: Affordability at 62.6 (on 40-85 scale)
- Worst category: Education & Childcare at 52.0 (on 40-85 scale)
- Poverty rate, 2022: 12.5% — 21st highest
- High school attainment rate, 2022: 89.2% — 12th lowest
- No. of family households, 2022: 1,843,530 — 64.7% of all households
41. Alabama: 57.02 (on 40-85 scale)

- Best category: Affordability at 79.5 (on 40-85 scale)
- Worst category: Education & Childcare at 46.8 (on 40-85 scale)
- Poverty rate, 2022: 16.2% — 7th highest
- High school attainment rate, 2022: 88.8% — 8th lowest
- No. of family households, 2022: 1,308,988 — 64.9% of all households
40. West Virginia: 57.15 (on 40-85 scale)

- Best category: Affordability at 79.9 (on 40-85 scale)
- Worst category: Education & Childcare at 40.0 (on 40-85 scale)
- Poverty rate, 2022: 17.9% — 3rd highest
- High school attainment rate, 2022: 89.1% — 10th lowest
- No. of family households, 2022: 463,064 — 62.9% of all households
39. Oklahoma: 57.48 (on 40-85 scale)

- Best category: Affordability at 79.3 (on 40-85 scale)
- Worst category: Health & Safety at 48.0 (on 40-85 scale)
- Poverty rate, 2022: 15.7% — 8th highest
- High school attainment rate, 2022: 89.6% — 14th lowest
- No. of family households, 2022: 1,017,586 — 64.7% of all households
38. Kentucky: 58.32 (on 40-85 scale)

- Best category: Affordability at 81.8 (on 40-85 scale)
- Worst category: socioeconomics at 46.8 (on 40-85 scale)
- Poverty rate, 2022: 16.5% — 6th highest
- High school attainment rate, 2022: 89.0% — 9th lowest
- No. of family households, 2022: 1,172,125 — 64.1% of all households
37. Florida: 58.38 (on 40-85 scale)
- Best category: Affordability at 62.6 (on 40-85 scale)
- Worst category: Education & Childcare at 52.8 (on 40-85 scale)
- Poverty rate, 2022: 12.7% — 17th highest
- High school attainment rate, 2022: 89.9% — 15th lowest
- No. of family households, 2022: 5,684,399 — 64.4% of all households
36. Tennessee: 59.16 (on 40-85 scale)

- Best category: Affordability at 74.4 (on 40-85 scale)
- Worst category: Health & Safety at 50.2 (on 40-85 scale)
- Poverty rate, 2022: 13.3% — 14th highest
- High school attainment rate, 2022: 90.4% — 18th lowest
- No. of family households, 2022: 1,846,572 — 64.9% of all households
35. Georgia: 59.77 (on 40-85 scale)

- Best category: Affordability at 72.5 (on 40-85 scale)
- Worst category: socioeconomics at 52.1 (on 40-85 scale)
- Poverty rate, 2022: 12.7% — 18th highest
- High school attainment rate, 2022: 89.5% — 13th lowest
- No. of family households, 2022: 2,733,234 — 66.8% of all households
34. Alaska: 60.88 (on 40-85 scale)

- Best category: Affordability at 71.3 (on 40-85 scale)
- Worst category: Health & Safety at 48.7 (on 40-85 scale)
- Poverty rate, 2022: 11.0% — 19th lowest
- High school attainment rate, 2022: 93.3% — 10th highest
- No. of family households, 2022: 175,789 — 64.0% of all households
33. North Carolina: 61.6 (on 40-85 scale)
- Best category: Affordability at 73.2 (on 40-85 scale)
- Worst category: Education & Childcare at 56.6 (on 40-85 scale)
- Poverty rate, 2022: 12.8% — 16th highest
- High school attainment rate, 2022: 90.2% — 16th lowest
- No. of family households, 2022: 2,785,497 — 64.8% of all households
32. Indiana: 62.02 (on 40-85 scale)

- Best category: Affordability at 79.9 (on 40-85 scale)
- Worst category: Health & Safety at 54.2 (on 40-85 scale)
- Poverty rate, 2022: 12.6% — 19th highest
- High school attainment rate, 2022: 90.2% — 17th lowest
- No. of family households, 2022: 1,740,106 — 63.8% of all households
31. Rhode Island: 63.62 (on 40-85 scale)
- Best category: Health & Safety at 78.7 (on 40-85 scale)
- Worst category: Education & Childcare at 47.3 (on 40-85 scale)
- Poverty rate, 2022: 10.8% — 17th lowest
- High school attainment rate, 2022: 90.5% — 21st lowest
- No. of family households, 2022: 266,935 — 59.8% of all households
30. Hawaii: 64.02 (on 40-85 scale)

- Best category: Health & Safety at 76.7 (on 40-85 scale)
- Worst category: Affordability at 40.0 (on 40-85 scale)
- Poverty rate, 2022: 10.2% — 10th lowest
- High school attainment rate, 2022: 92.9% — 14th highest
- No. of family households, 2022: 335,052 — 67.7% of all households
29. Idaho: 64.1 (on 40-85 scale)

- Best category: socioeconomics at 71.1 (on 40-85 scale)
- Worst category: Health & Safety at 60.3 (on 40-85 scale)
- Poverty rate, 2022: 10.7% — 15th lowest
- High school attainment rate, 2022: 92.0% — 19th highest
- No. of family households, 2022: 491,073 — 68.5% of all households
28. Oregon: 64.41 (on 40-85 scale)
- Best category: Health & Safety at 67.0 (on 40-85 scale)
- Worst category: Education & Childcare at 60.0 (on 40-85 scale)
- Poverty rate, 2022: 12.1% — 25th highest
- High school attainment rate, 2022: 91.6% — 23rd highest
- No. of family households, 2022: 1,041,083 — 60.3% of all households
27. Michigan: 64.83 (on 40-85 scale)

- Best category: Affordability at 82.1 (on 40-85 scale)
- Worst category: Education & Childcare at 54.0 (on 40-85 scale)
- Poverty rate, 2022: 13.4% — 13th highest
- High school attainment rate, 2022: 91.8% — 21st highest
- No. of family households, 2022: 2,548,560 — 62.3% of all households
26. Delaware: 64.89 (on 40-85 scale)
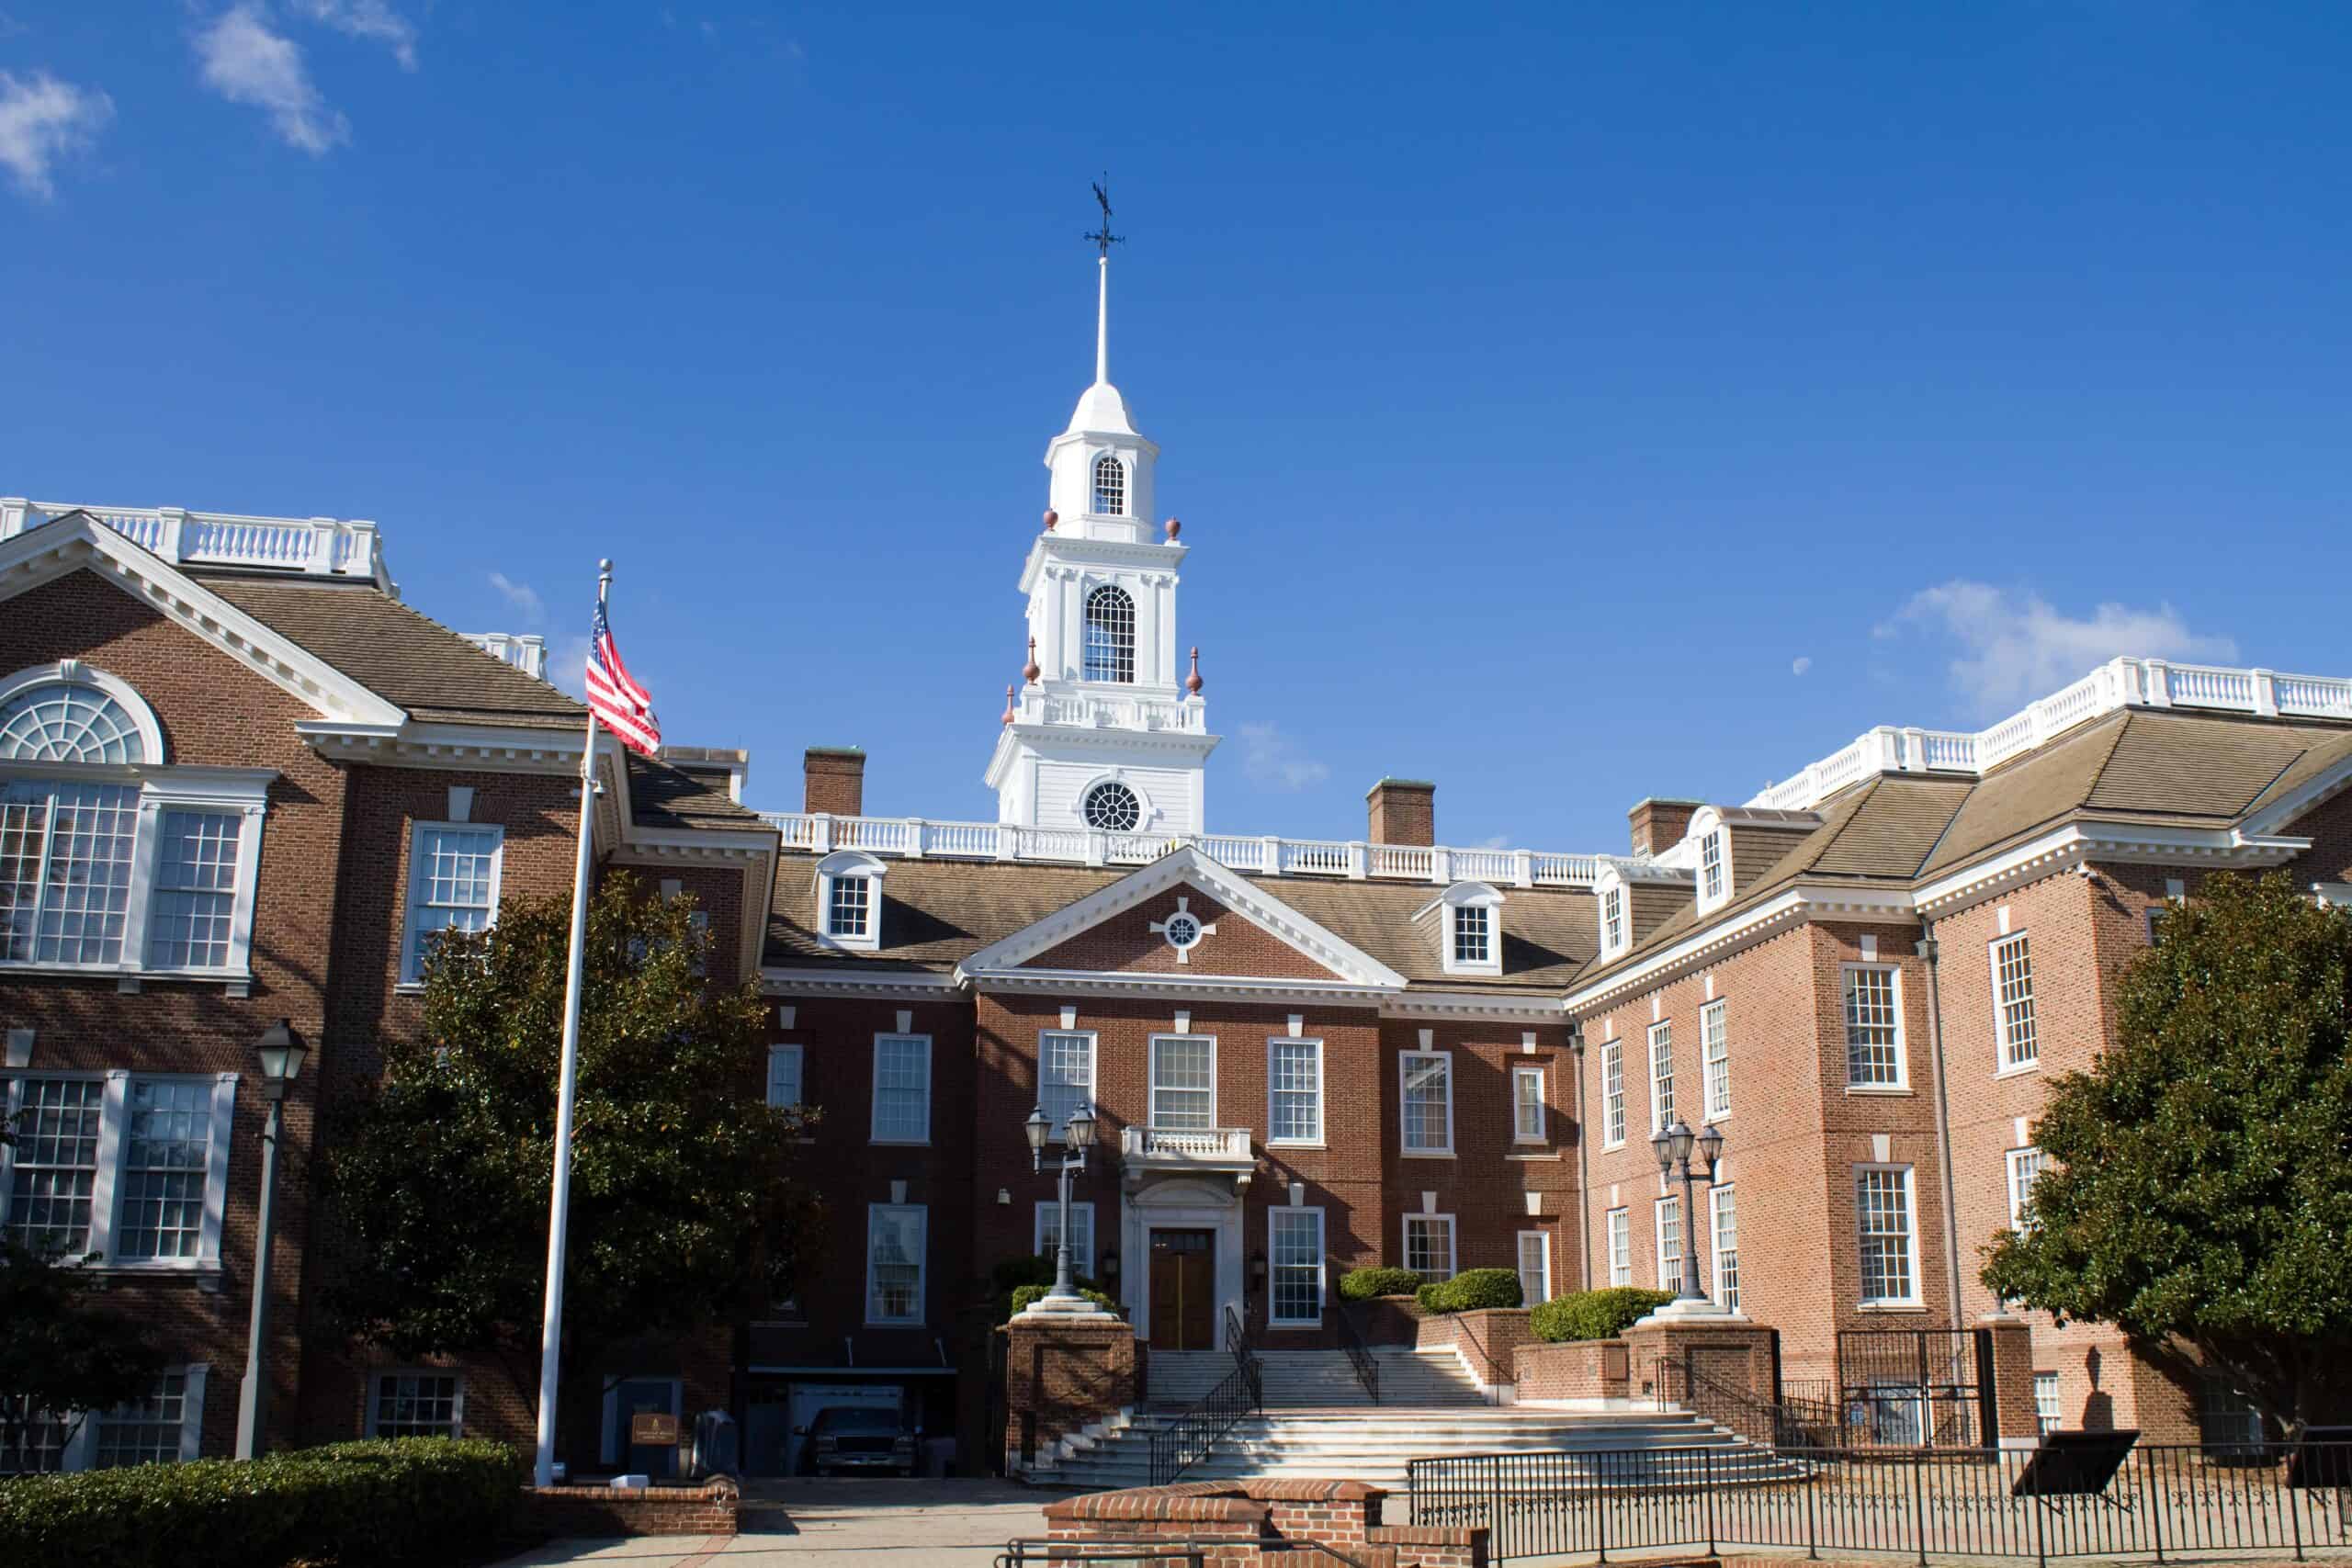
- Best category: Affordability at 73.8 (on 40-85 scale)
- Worst category: socioeconomics at 58.1 (on 40-85 scale)
- Poverty rate, 2022: 9.4% — 3rd lowest
- High school attainment rate, 2022: 92.0% — 20th highest
- No. of family households, 2022: 263,885 — 65.6% of all households
25. Illinois: 64.94 (on 40-85 scale)
- Best category: Affordability at 84.0 (on 40-85 scale)
- Worst category: socioeconomics at 54.3 (on 40-85 scale)
- Poverty rate, 2022: 11.9% — 24th lowest
- High school attainment rate, 2022: 90.4% — 19th lowest
- No. of family households, 2022: 3,137,923 — 62.1% of all households
24. Ohio: 64.99 (on 40-85 scale)

- Best category: Affordability at 84.1 (on 40-85 scale)
- Worst category: Education & Childcare at 57.2 (on 40-85 scale)
- Poverty rate, 2022: 13.4% — 12th highest
- High school attainment rate, 2022: 91.8% — 22nd highest
- No. of family households, 2022: 2,983,145 — 61.2% of all households
23. Missouri: 65.16 (on 40-85 scale)
- Best category: Affordability at 80.9 (on 40-85 scale)
- Worst category: Health & Safety at 58.0 (on 40-85 scale)
- Poverty rate, 2022: 13.2% — 15th highest
- High school attainment rate, 2022: 91.6% — 24th highest
- No. of family households, 2022: 1,569,735 — 62.2% of all households
22. Washington: 65.28 (on 40-85 scale)
- Best category: Health & Safety at 66.9 (on 40-85 scale)
- Worst category: socioeconomics at 63.4 (on 40-85 scale)
- Poverty rate, 2022: 10.0% — 9th lowest
- High school attainment rate, 2022: 92.2% — 17th highest
- No. of family households, 2022: 1,935,445 — 62.8% of all households
21. New York: 65.33 (on 40-85 scale)

- Best category: Affordability at 81.2 (on 40-85 scale)
- Worst category: Education & Childcare at 49.3 (on 40-85 scale)
- Poverty rate, 2022: 14.3% — 9th highest
- High school attainment rate, 2022: 87.9% — 6th lowest
- No. of family households, 2022: 4,738,232 — 60.9% of all households
20. Colorado: 65.65 (on 40-85 scale)
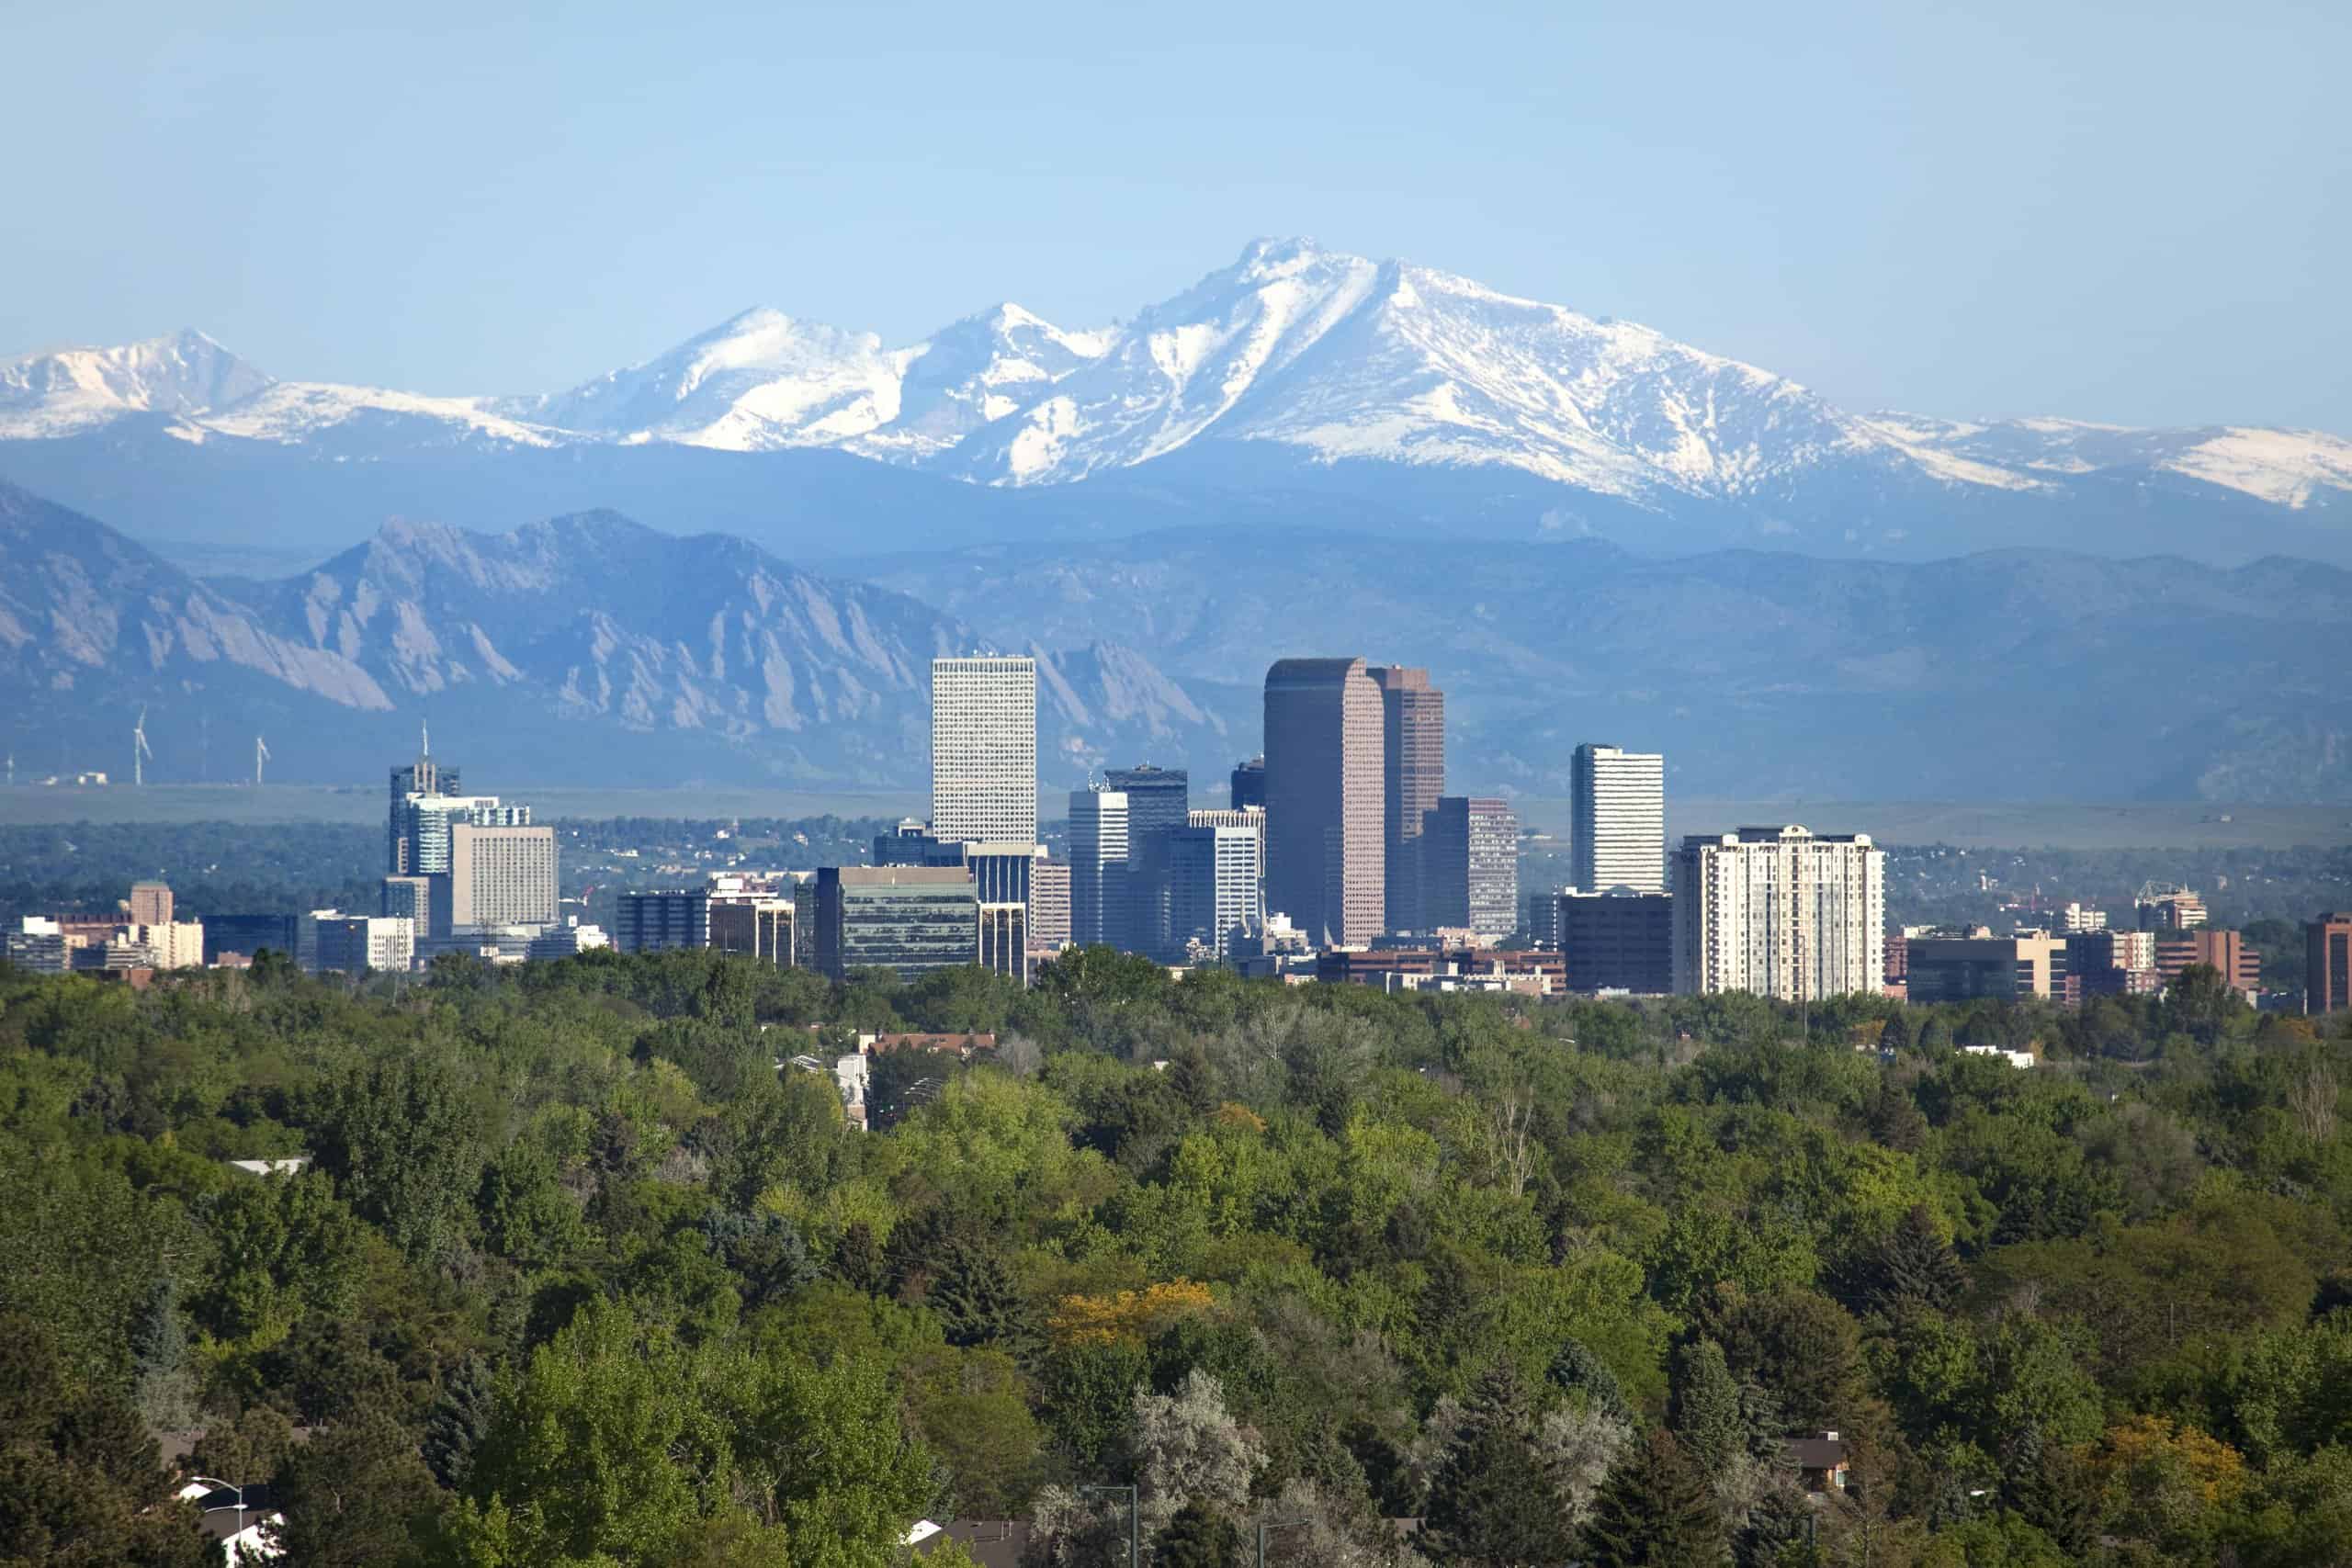
- Best category: socioeconomics at 69.3 (on 40-85 scale)
- Worst category: Affordability at 59.4 (on 40-85 scale)
- Poverty rate, 2022: 9.4% — 4th lowest
- High school attainment rate, 2022: 93.0% — 12th highest
- No. of family households, 2022: 1,464,182 — 61.4% of all households
19. Montana: 65.8 (on 40-85 scale)

- Best category: socioeconomics at 74.4 (on 40-85 scale)
- Worst category: Health & Safety at 57.0 (on 40-85 scale)
- Poverty rate, 2022: 12.1% — 24th highest
- High school attainment rate, 2022: 94.0% — 4th highest
- No. of family households, 2022: 282,216 — 60.8% of all households
18. New Jersey: 65.96 (on 40-85 scale)

- Best category: Health & Safety at 70.8 (on 40-85 scale)
- Worst category: socioeconomics at 58.1 (on 40-85 scale)
- Poverty rate, 2022: 9.7% — 7th lowest
- High school attainment rate, 2022: 90.7% — 22nd lowest
- No. of family households, 2022: 2,378,459 — 67.6% of all households
17. Virginia: 67.62 (on 40-85 scale)

- Best category: socioeconomics at 70.7 (on 40-85 scale)
- Worst category: Health & Safety at 64.0 (on 40-85 scale)
- Poverty rate, 2022: 10.6% — 13th lowest
- High school attainment rate, 2022: 91.5% — 25th highest
- No. of family households, 2022: 2,191,916 — 64.8% of all households
16. Connecticut: 68.77 (on 40-85 scale)

- Best category: Affordability at 78.6 (on 40-85 scale)
- Worst category: Education & Childcare at 60.6 (on 40-85 scale)
- Poverty rate, 2022: 9.8% — 8th lowest
- High school attainment rate, 2022: 91.5% — 25th lowest
- No. of family households, 2022: 902,539 — 63.0% of all households
15. Maryland: 68.99 (on 40-85 scale)

- Best category: Education & Childcare at 73.3 (on 40-85 scale)
- Worst category: Health & Safety at 66.8 (on 40-85 scale)
- Poverty rate, 2022: 9.6% — 5th lowest
- High school attainment rate, 2022: 91.4% — 24th lowest
- No. of family households, 2022: 1,546,282 — 65.1% of all households
14. Kansas: 69.06 (on 40-85 scale)
- Best category: Affordability at 79.6 (on 40-85 scale)
- Worst category: Health & Safety at 59.7 (on 40-85 scale)
- Poverty rate, 2022: 12.0% — 25th lowest
- High school attainment rate, 2022: 92.1% — 18th highest
- No. of family households, 2022: 740,407 — 63.0% of all households
13. Wyoming: 69.22 (on 40-85 scale)

- Best category: Affordability at 77.1 (on 40-85 scale)
- Worst category: Education & Childcare at 63.0 (on 40-85 scale)
- Poverty rate, 2022: 11.8% — 22nd lowest
- High school attainment rate, 2022: 93.7% — 7th highest
- No. of family households, 2022: 153,365 — 63.0% of all households
12. Nebraska: 70.64 (on 40-85 scale)

- Best category: Affordability at 78.7 (on 40-85 scale)
- Worst category: Education & Childcare at 62.5 (on 40-85 scale)
- Poverty rate, 2022: 11.2% — 20th lowest
- High school attainment rate, 2022: 92.8% — 15th highest
- No. of family households, 2022: 501,595 — 62.5% of all households
11. Wisconsin: 71.23 (on 40-85 scale)

- Best category: socioeconomics at 79.0 (on 40-85 scale)
- Worst category: Education & Childcare at 58.2 (on 40-85 scale)
- Poverty rate, 2022: 10.7% — 14th lowest
- High school attainment rate, 2022: 93.5% — 8th highest
- No. of family households, 2022: 1,511,105 — 60.7% of all households
10. Pennsylvania: 71.26 (on 40-85 scale)

- Best category: Affordability at 81.7 (on 40-85 scale)
- Worst category: Health & Safety at 65.8 (on 40-85 scale)
- Poverty rate, 2022: 11.8% — 23rd lowest
- High school attainment rate, 2022: 92.2% — 16th highest
- No. of family households, 2022: 3,294,814 — 62.2% of all households
9. Utah: 71.31 (on 40-85 scale)
- Best category: Education & Childcare at 85.0 (on 40-85 scale)
- Worst category: Affordability at 58.1 (on 40-85 scale)
- Poverty rate, 2022: 8.2% — 2nd lowest
- High school attainment rate, 2022: 93.0% — 13th highest
- No. of family households, 2022: 830,599 — 73.5% of all households
8. Maine: 71.38 (on 40-85 scale)
- Best category: Health & Safety at 77.8 (on 40-85 scale)
- Worst category: Education & Childcare at 62.0 (on 40-85 scale)
- Poverty rate, 2022: 10.8% — 16th lowest
- High school attainment rate, 2022: 94.6% — 2nd highest
- No. of family households, 2022: 370,935 — 61.3% of all households
7. Iowa: 71.63 (on 40-85 scale)

- Best category: Affordability at 83.6 (on 40-85 scale)
- Worst category: Education & Childcare at 61.2 (on 40-85 scale)
- Poverty rate, 2022: 11.0% — 18th lowest
- High school attainment rate, 2022: 93.5% — 9th highest
- No. of family households, 2022: 821,960 — 61.8% of all households
6. South Dakota: 72.07 (on 40-85 scale)
- Best category: socioeconomics at 84.0 (on 40-85 scale)
- Worst category: Health & Safety at 58.1 (on 40-85 scale)
- Poverty rate, 2022: 12.5% — 20th highest
- High school attainment rate, 2022: 93.2% — 11th highest
- No. of family households, 2022: 224,853 — 61.1% of all households
5. New Hampshire: 74.25 (on 40-85 scale)
- Best category: socioeconomics at 80.6 (on 40-85 scale)
- Worst category: Education & Childcare at 67.3 (on 40-85 scale)
- Poverty rate, 2022: 7.2% — the lowest
- High school attainment rate, 2022: 94.5% — 3rd highest
- No. of family households, 2022: 358,120 — 64.3% of all households
4. Minnesota: 75.29 (on 40-85 scale)
- Best category: socioeconomics at 83.5 (on 40-85 scale)
- Worst category: Education & Childcare at 67.1 (on 40-85 scale)
- Poverty rate, 2022: 9.6% — 6th lowest
- High school attainment rate, 2022: 94.0% — 5th highest
- No. of family households, 2022: 1,456,312 — 62.7% of all households
3. North Dakota: 75.75 (on 40-85 scale)

- Best category: Affordability at 85.0 (on 40-85 scale)
- Worst category: Education & Childcare at 65.8 (on 40-85 scale)
- Poverty rate, 2022: 11.5% — 21st lowest
- High school attainment rate, 2022: 93.9% — 6th highest
- No. of family households, 2022: 193,761 — 58.5% of all households
2. Vermont: 76.54 (on 40-85 scale)
- Best category: Health & Safety at 85.0 (on 40-85 scale)
- Worst category: Education & Childcare at 65.7 (on 40-85 scale)
- Poverty rate, 2022: 10.4% — 12th lowest
- High school attainment rate, 2022: 95.0% — the highest
- No. of family households, 2022: 164,496 — 59.4% of all households
1. Massachusetts: 77.14 (on 40-85 scale)
- Best category: Health & Safety at 82.3 (on 40-85 scale)
- Worst category: Affordability at 72.8 (on 40-85 scale)
- Poverty rate, 2022: 10.4% — 11th lowest
- High school attainment rate, 2022: 91.3% — 23rd lowest
- No. of family households, 2022: 1,724,355 — 61.6% of all households
Thank you for reading! Have some feedback for us?
Contact the 24/7 Wall St. editorial team.
