24/7 Wall St. Insights
- The U.S. economy has added over 14 million jobs in the last decade
- But due to free-market forces, government policy, and technological advancements, dozens of once-healthy American industries have been rapidly shedding workers
- Also: 2 Dividend Legends To Hold Forever
The United States is home to the largest and most diverse economy in the world. But the free-market dynamism that has helped make the U.S. a global center of gravity is also continuously fueling economic transformation. In the last 10 years alone, the industrial foundation upon which the U.S. economy is built has changed considerably.
Evolving manufacturing processes, the emergence of new media platforms, the ongoing transition to clean energy, and broad-based technological advancements have all led to meaningful shifts in the industrial composition of the American labor force. Driven by rapid growth in a number of industries, including transportation and utilities, finance, and professional and business services, there are nearly 14.4 million more workers today than there were a decade ago. (Here is a look at the jobs going away due to automation.)
But the overall growth of the workforce belies a starly different reality that has come to define multiple economic sectors. Several once-healthy industries are rapidly disappearing in the United States.
Using data from the Bureau of Labor Statistics, 24/7 Wall St. identified America’s 25 fastest dying industries. We reviewed historical employment data in nearly 300 industrial classifications and ranked them on the percent change in employment between 2013 and 2022. Industries classified as miscellaneous were excluded from analysis. Every industry on this list has lost at least 30% of its workforce in the last 10 years.
The 25 industries on this list fall under multiple broad categories, including education and healthcare, manufacturing, wholesale and retail trade, information, and resource extraction.
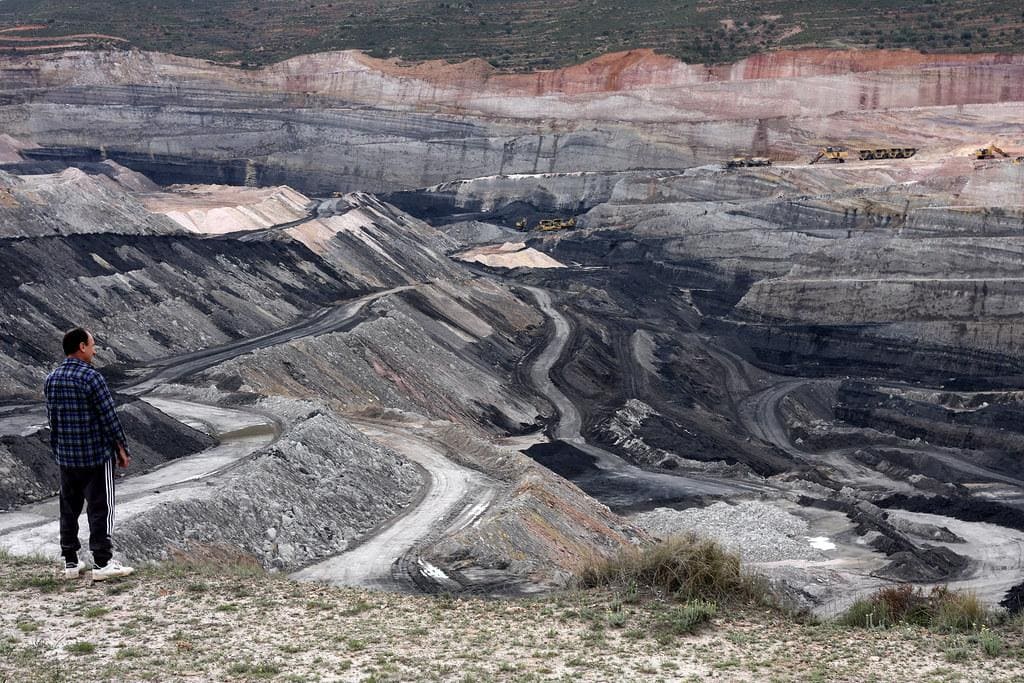
Some of these industries are disappearing largely as a result of shifting government policy. The country’s continued shift away from fossil fuels, in favor of clean, renewable energy sources has resulted in a precipitous decline in coal mining. According to the U.S. Energy Information Administration, domestic coal production totaled 594 million short tons in 2022, down 40% from 10 years earlier. Over the same period, the number of Americans working in the coal mining industry fell by nearly 58%.
For most other industries on this list, falling employment is driven primarily by market forces. The number of Americans working in aerospace products and parts manufacturing, for example, has declined by over 80% in the last 10 years. Major aerospace companies, like Boeing, are increasingly relying on overseas manufacturing partners to cut costs, improve efficiency, and drive innovation. (Here is a look at 10 American cities that were destroyed by outsourcing jobs.)
For other industries, like newspaper publishing and broadcasting, falling employment is closely tied to emergent, internet-based media platforms.
The decline of the industries on this list is further evidenced by their aging workforces. As demand for the products and services generated by these sectors falls, workers are laid off and hiring stagnates. As a result, in most of these fields, the typical worker is older now than they were a decade ago.
Why It Matters

In the U.S. economy — one of the most diverse and dynamic in the world — change is the only constant. While the economy as a whole has steadily added jobs in recent years, many industries have reported rapid downsizing. Whether due to free-market forces, government policy, or technological advancements, dozens of once-healthy American industries are far smaller now than they were as recently as 10 years ago.
25. Tire manufacturing

- Industry employment change 2013-2022: -30.5% (-29,000 workers)
- Industry employment: 66,000 in 2022; 95,000 in 2013
- Median worker age in industry: 45.0 in 2022; 41.8 in 2013
24. Periodical, book, and directory publishers

- Industry employment change 2013-2022: -31.5% (-80,000 workers)
- Industry employment: 174,000 in 2022; 254,000 in 2013
- Median worker age in industry: 48.0 in 2022; 44.3 in 2013
23. Sewing, needlework, and piece goods stores

- Industry employment change 2013-2022: -32.8% (-20,000 workers)
- Industry employment: 41,000 in 2022; 61,000 in 2013
- Median worker age in industry: N/A in 2022; 50.7 in 2013
22. Navigational, measuring, electromedical, and control instruments manufacturing

- Industry employment change 2013-2022: -33.8% (-79,000 workers)
- Industry employment: 155,000 in 2022; 234,000 in 2013
- Median worker age in industry: 48.5 in 2022; 47.2 in 2013
21. Fabric mills, except knitting mills

- Industry employment change 2013-2022: -35.3% (-36,000 workers)
- Industry employment: 66,000 in 2022; 102,000 in 2013
- Median worker age in industry: 50.6 in 2022; 45.6 in 2013
20. Vocational rehabilitation services

- Industry employment change 2013-2022: -35.6% (-53,000 workers)
- Industry employment: 96,000 in 2022; 149,000 in 2013
- Median worker age in industry: 46.2 in 2022; 44.2 in 2013
19. Farm supplies merchant wholesalers

- Industry employment change 2013-2022: -36.2% (-17,000 workers)
- Industry employment: 30,000 in 2022; 47,000 in 2013
- Median worker age in industry: N/A
18. Petroleum and petroleum products merchant wholesalers
- Industry employment change 2013-2022: -38.5% (-52,000 workers)
- Industry employment: 83,000 in 2022; 135,000 in 2013
- Median worker age in industry: 45.7 in 2022; 46.5 in 2013
17. Coating, engraving, heat treating, and allied activities

- Industry employment change 2013-2022: -40.0% (-32,000 workers)
- Industry employment: 48,000 in 2022; 80,000 in 2013
- Median worker age in industry: N/A in 2022; 44.1 in 2013
16. Oil and gas extraction

- Industry employment change 2013-2022: -40.9% (-47,000 workers)
- Industry employment: 68,000 in 2022; 115,000 in 2013
- Median worker age in industry: 41.0 in 2022; 38.6 in 2013
15. Metalworking machinery manufacturing

- Industry employment change 2013-2022: -43.4% (-69,000 workers)
- Industry employment: 90,000 in 2022; 159,000 in 2013
- Median worker age in industry: 43.8 in 2022; 49.0 in 2013
14. Knitting fabric mills, and apparel knitting mills

- Industry employment change 2013-2022: -43.8% (-7,000 workers)
- Industry employment: 9,000 in 2022; 16,000 in 2013
- Median worker age in industry: N/A
13. Tobacco manufacturing

- Industry employment change 2013-2022: -44.0% (-11,000 workers)
- Industry employment: 14,000 in 2022; 25,000 in 2013
- Median worker age in industry: N/A
12. Broadcasting (except internet)

- Industry employment change 2013-2022: -44.7% (-251,000 workers)
- Industry employment: 310,000 in 2022; 561,000 in 2013
- Median worker age in industry: 42.7 in 2022; 39.8 in 2013
11. Management of companies and enterprises

- Industry employment change 2013-2022: -44.8% (-82,000 workers)
- Industry employment: 101,000 in 2022; 183,000 in 2013
- Median worker age in industry: 40.1 in 2022; 44.2 in 2013
10. Support activities for mining

- Industry employment change 2013-2022: -46.0% (-322,000 workers)
- Industry employment: 378,000 in 2022; 700,000 in 2013
- Median worker age in industry: 41.7 in 2022; 40.2 in 2013
9. Paper and paper products merchant wholesalers

- Industry employment change 2013-2022: -47.5% (-29,000 workers)
- Industry employment: 32,000 in 2022; 61,000 in 2013
- Median worker age in industry: N/A in 2022; 49.5 in 2013
8. Textile and fabric finishing and coating mills

- Industry employment change 2013-2022: -50.0% (-6,000 workers)
- Industry employment: 6,000 in 2022; 12,000 in 2013
- Median worker age in industry: N/A
7. Engine, turbine, and power transmission equipment manufacturing

- Industry employment change 2013-2022: -52.2% (-36,000 workers)
- Industry employment: 33,000 in 2022; 69,000 in 2013
- Median worker age in industry: N/A in 2022; 46.4 in 2013
6. Recyclable material merchant wholesalers

- Industry employment change 2013-2022: -52.6% (-60,000 workers)
- Industry employment: 54,000 in 2022; 114,000 in 2013
- Median worker age in industry: 44.9 in 2022; 43.1 in 2013
5. Office supplies and stationery stores

- Industry employment change 2013-2022: -54.7% (-87,000 workers)
- Industry employment: 72,000 in 2022; 159,000 in 2013
- Median worker age in industry: 40.0 in 2022; 38.9 in 2013
4. Newspaper publishers

- Industry employment change 2013-2022: -54.7% (-150,000 workers)
- Industry employment: 124,000 in 2022; 274,000 in 2013
- Median worker age in industry: 49.2 in 2022; 48.6 in 2013
3. Computer and peripheral equipment manufacturing

- Industry employment change 2013-2022: -57.6% (-151,000 workers)
- Industry employment: 111,000 in 2022; 262,000 in 2013
- Median worker age in industry: 45.4 in 2022; 44.2 in 2013
2. Coal mining
- Industry employment change 2013-2022: -57.6% (-49,000 workers)
- Industry employment: 36,000 in 2022; 85,000 in 2013
- Median worker age in industry: N/A in 2022; 47.2 in 2013
1. Aerospace products and parts manufacturing
- Industry employment change 2013-2022: -82.1% (-353,000 workers)
- Industry employment: 77,000 in 2022; 430,000 in 2013
- Median worker age in industry: 43.5 in 2022; 47.7 in 2013
Take Charge of Your Retirement In Just A Few Minutes (Sponsor)
Retirement planning doesn’t have to feel overwhelming. The key is finding expert guidance—and SmartAsset’s simple quiz makes it easier than ever for you to connect with a vetted financial advisor.
Here’s how it works:
- Answer a Few Simple Questions. Tell us a bit about your goals and preferences—it only takes a few minutes!
- Get Matched with Vetted Advisors Our smart tool matches you with up to three pre-screened, vetted advisors who serve your area and are held to a fiduciary standard to act in your best interests. Click here to begin
- Choose Your Fit Review their profiles, schedule an introductory call (or meet in person), and select the advisor who feel is right for you.
Why wait? Start building the retirement you’ve always dreamed of. Click here to get started today!
Thank you for reading! Have some feedback for us?
Contact the 24/7 Wall St. editorial team.


