
24/7 Wall St. Insights
- Nationwide, the cost of living tends to be higher in cities than in places outside of major metro areas
- Still, consumer prices can vary considerably from one city to another, and some California metro areas are more affordable for a broader range of incomes than others
- Also: 2 Dividend Legends To Hold Forever
The cost of living has skyrocketed across the United States in recent years — and rising prices are weighing heavily on the minds and pocketbooks of American families. According to a recent survey conducted by the U.S. Census Bureau, more than 57% of American households have had at least some difficulty affording their usual expenses in the last week, and over 93% of American adults reported stress related to higher prices in the last two months.
The rate of inflation began to surge in early 2021, and ultimately peaked in June 2022, when the price of goods and services were 9.1% higher than they were 12 months earlier, according to the Consumer Price Index. While inflation has cooled in the last two years, the CPI remains above the Federal Reserve’s target rate of 2%.
While no one was spared from rising consumer prices, in relative terms, the overall cost of living varies considerably across the country. In California, for example, goods and services were about 12.5% more expensive, on average, than they were nationwide in 2022 — the latest year of available data. Likely due in part to a higher cost of living, 56.6% of California households had difficulty paying for household expenses in the last week, and 92.3% of adults in the state reported stress resulting from rising prices. (Here is a look at the most expensive states to live in.)
Generally, Americans living in major cities are saddled with a higher cost of living than those in smaller, rural communities. According to the Bureau of Economic Analysis, goods and services are about 11.4% more expensive within U.S. metro areas than they are outside of metro areas.
In keeping with this pattern, goods and services are about 12.7% more expensive than average across all 26 California metro areas, and only 3.3% more expensive in non-metro areas. Still, the overall cost of living can vary meaningfully between one California city and another. In the state’s least expensive metro area, consumer prices are only about 0.1% higher than they are nationwide on average. Meanwhile, in the state’s most expensive city, prices are 17.9% higher than average. (Here is a look at the most affordable town in every state.)
Consumer prices tend to rise when demand for goods and services outpaces supply. Because cost of living is closely tied to consumer spending, it is no coincidence that more affluent areas are typically more expensive places to live than lower income communities. While there are exceptions, the median household income in some of the most expensive cities on this list is higher than the comparable statewide median income of $91,551.
This is the cost of living in every California metro area, ranked.
Why It Matters

Inflation, as measured by the Consumer Price Index, hit a multi-decade high in 2022, and as of July 2024, the CPI remains well above the Federal Reserve’s 2% target. Even though prices tend to be far higher in cities than in rural communities, the vast majority of Americans — 80% according to the U.S. Census Bureau — live in an urban area. Still, consumer prices can vary considerably from one city to another, and some California metro areas are more affordable for a broader range of incomes than others.
26. El Centro, CA
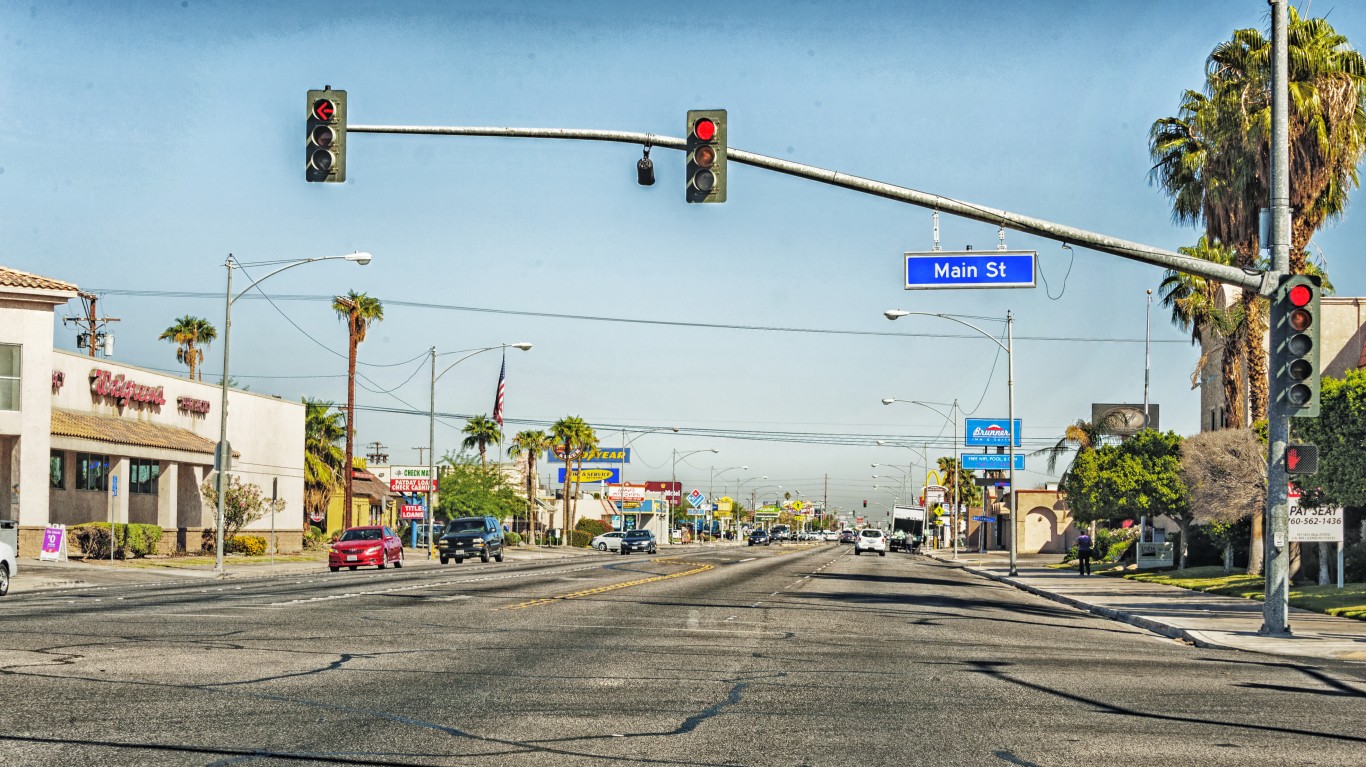
- Overall cost of living, 2022: 0.1% higher than U.S. average
- Median household income, 2022: $57,310 ($34,241 less than statewide median)
- Median home value, 2022: $293,200 ($422,700 less than statewide median)
- Metro area population: 178,713
25. Hanford-Corcoran, CA

- Overall cost of living, 2022: 2.4% higher than U.S. average
- Median household income, 2022: $64,368 ($27,183 less than statewide median)
- Median home value, 2022: $299,400 ($416,500 less than statewide median)
- Metro area population: 152,981
24. Visalia, CA
- Overall cost of living, 2022: 2.4% higher than U.S. average
- Median household income, 2022: $64,722 ($26,829 less than statewide median)
- Median home value, 2022: $320,500 ($395,400 less than statewide median)
- Metro area population: 477,544
23. Yuba City, CA
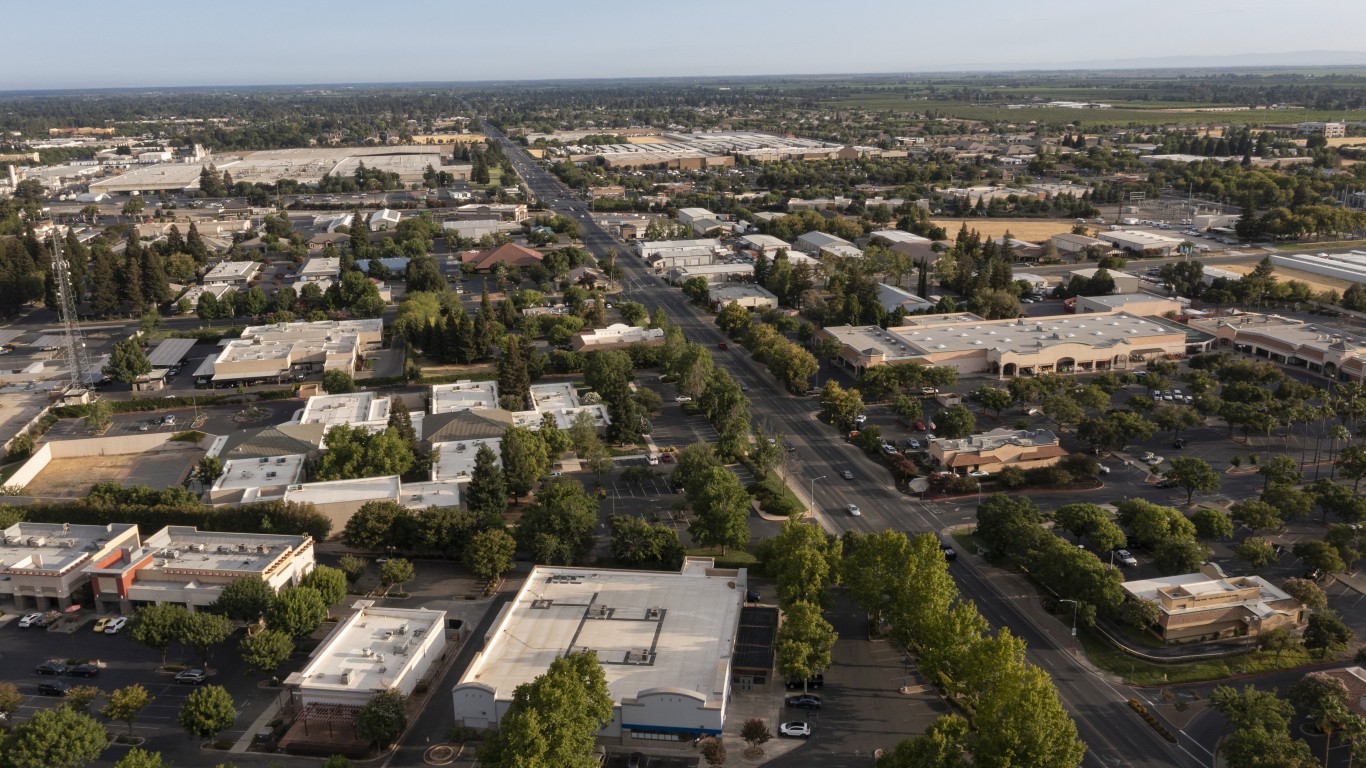
- Overall cost of living, 2022: 2.7% higher than U.S. average
- Median household income, 2022: $65,034 ($26,517 less than statewide median)
- Median home value, 2022: $431,700 ($284,200 less than statewide median)
- Metro area population: 182,813
22. Merced, CA

- Overall cost of living, 2022: 3.0% higher than U.S. average
- Median household income, 2022: $66,164 ($25,387 less than statewide median)
- Median home value, 2022: $388,300 ($327,600 less than statewide median)
- Metro area population: 290,014
21. Madera, CA

- Overall cost of living, 2022: 3.1% higher than U.S. average
- Median household income, 2022: $76,920 ($14,631 less than statewide median)
- Median home value, 2022: $396,100 ($319,800 less than statewide median)
- Metro area population: 160,256
20. Redding, CA

- Overall cost of living, 2022: 3.8% higher than U.S. average
- Median household income, 2022: $68,276 ($23,275 less than statewide median)
- Median home value, 2022: $355,100 ($360,800 less than statewide median)
- Metro area population: 180,930
19. Chico, CA
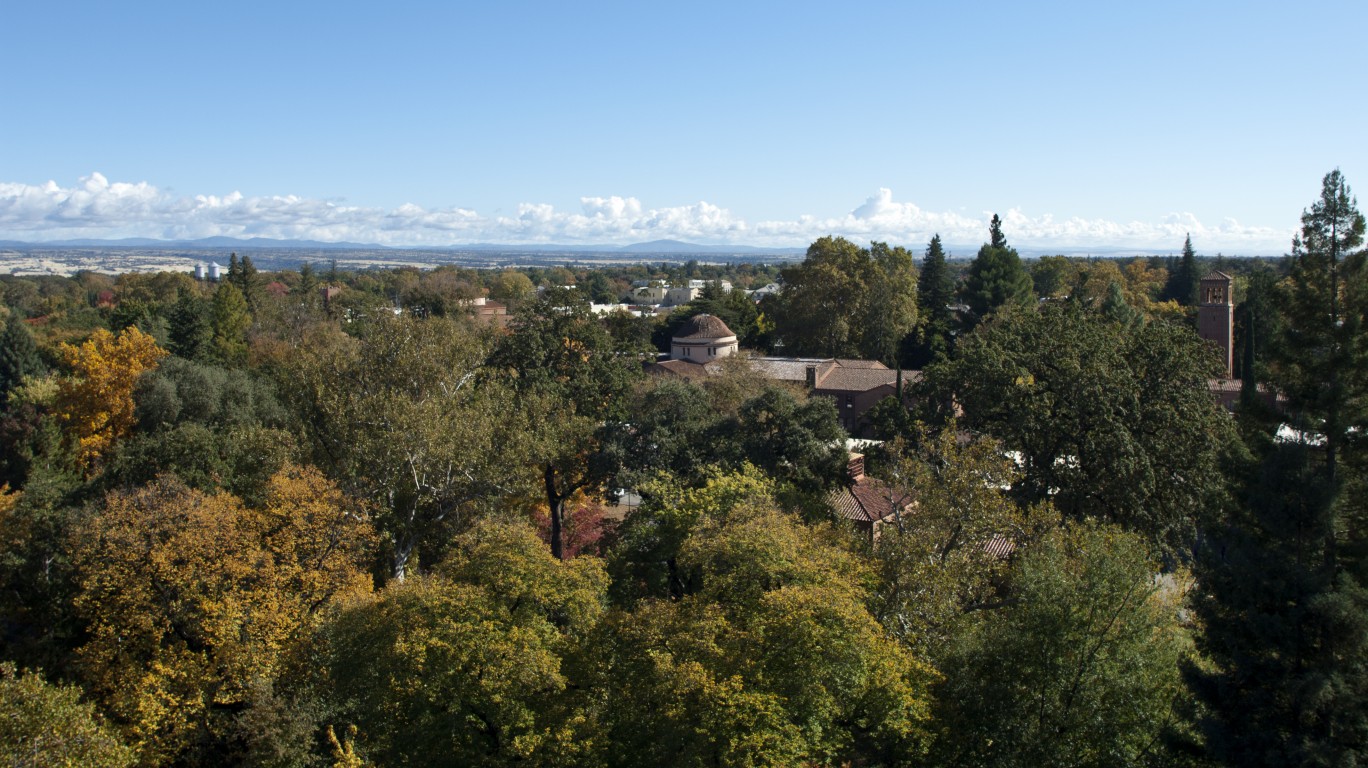
- Overall cost of living, 2022: 4.3% higher than U.S. average
- Median household income, 2022: $64,426 ($27,125 less than statewide median)
- Median home value, 2022: $412,700 ($303,200 less than statewide median)
- Metro area population: 207,303
18. Bakersfield, CA
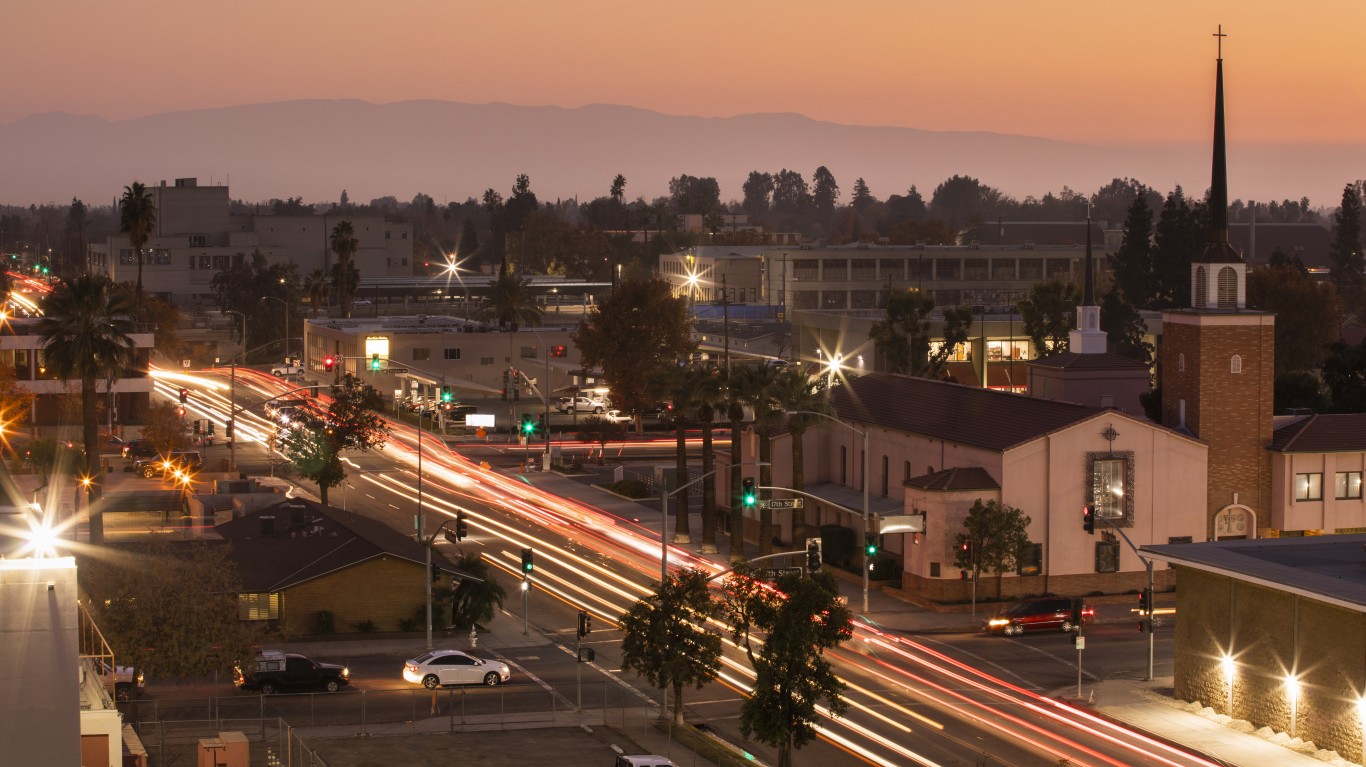
- Overall cost of living, 2022: 4.5% higher than U.S. average
- Median household income, 2022: $66,234 ($25,317 less than statewide median)
- Median home value, 2022: $330,000 ($385,900 less than statewide median)
- Metro area population: 916,108
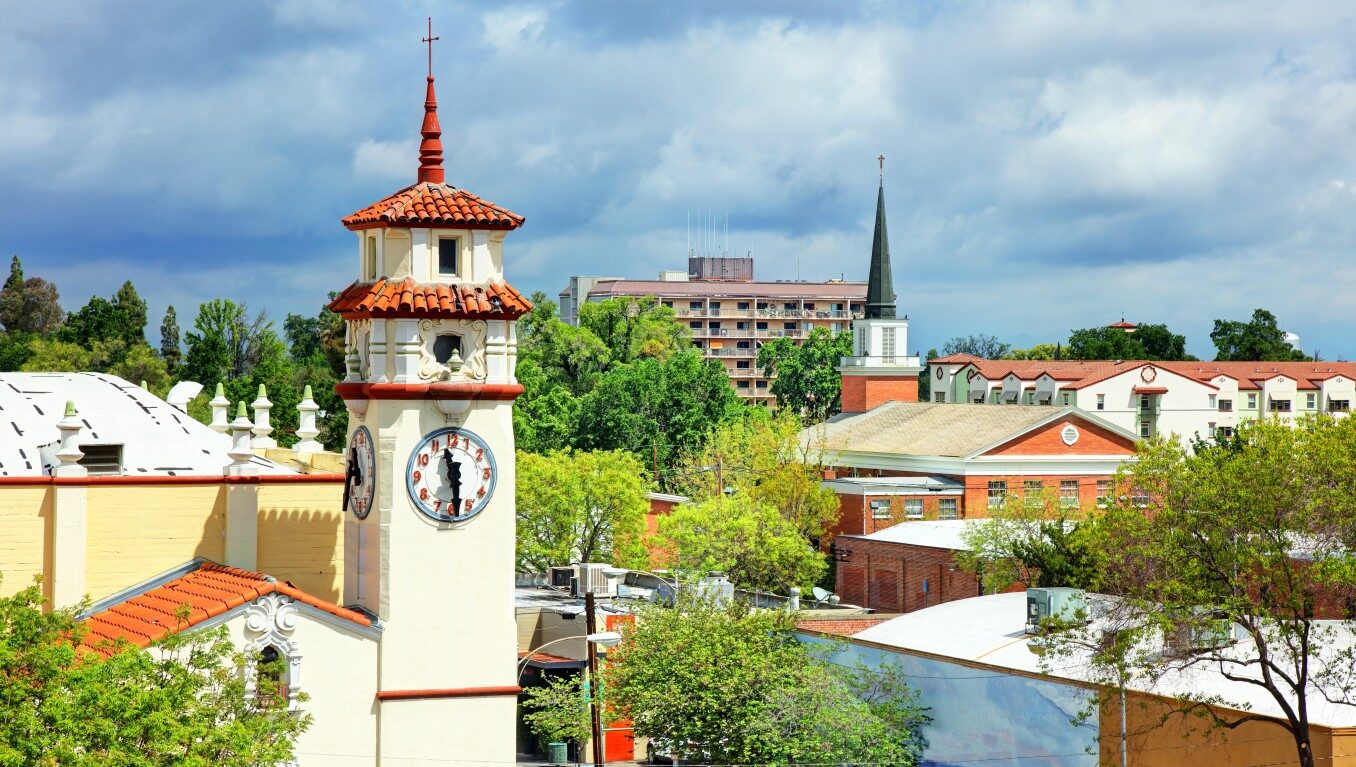
17. Fresno, CA
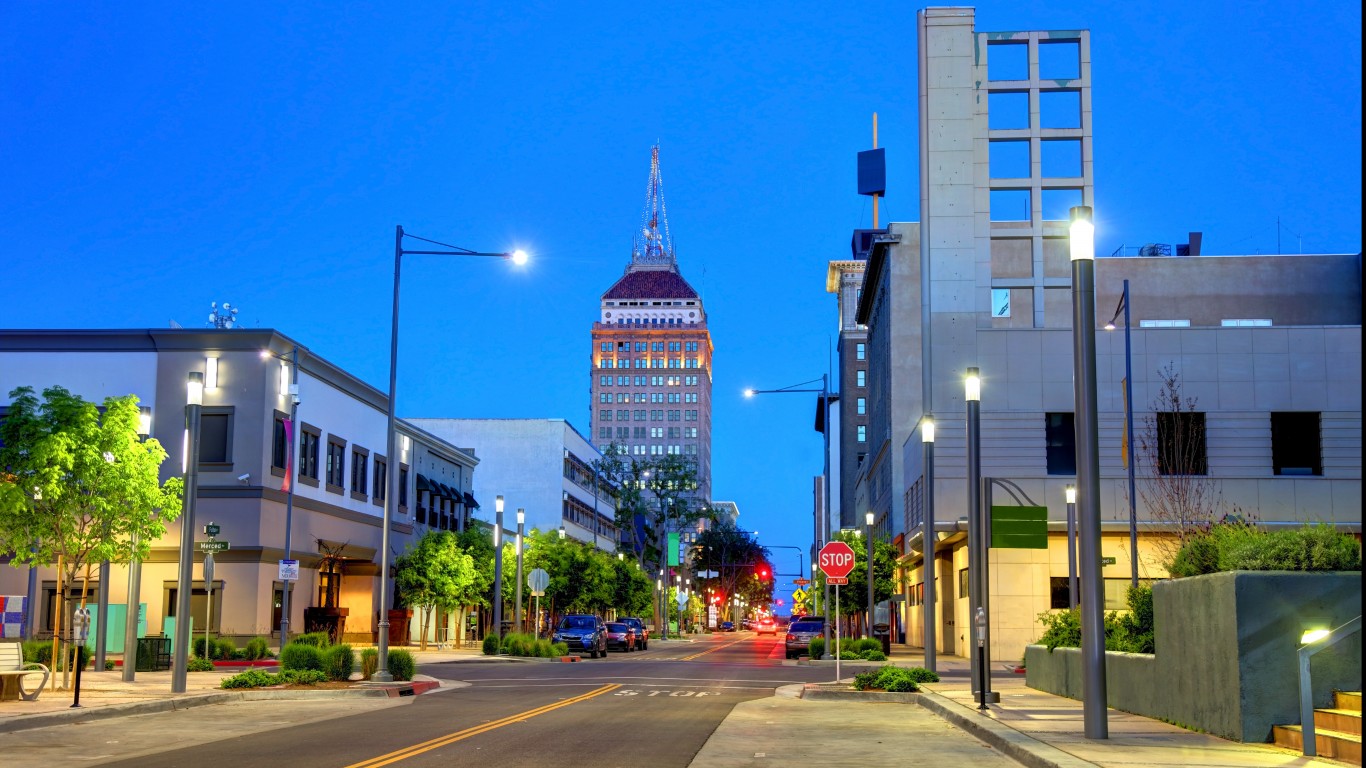
- Overall cost of living, 2022: 5.2% higher than U.S. average
- Median household income, 2022: $69,571 ($21,980 less than statewide median)
- Median home value, 2022: $382,500 ($333,400 less than statewide median)
- Metro area population: 1,015,190
16. Modesto, CA
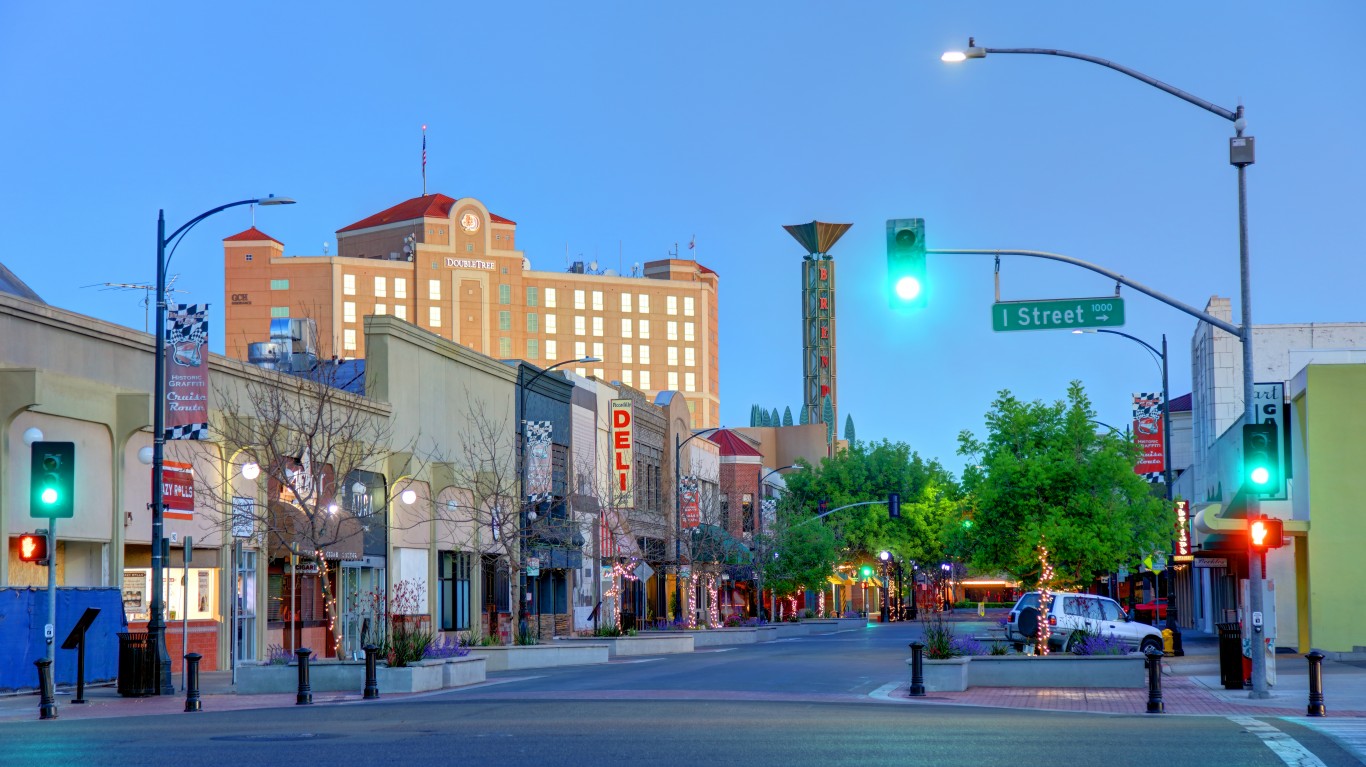
- Overall cost of living, 2022: 6.0% higher than U.S. average
- Median household income, 2022: $75,886 ($15,665 less than statewide median)
- Median home value, 2022: $450,700 ($265,200 less than statewide median)
- Metro area population: 551,275
15. Riverside-San Bernardino-Ontario, CA

- Overall cost of living, 2022: 6.4% higher than U.S. average
- Median household income, 2022: $82,803 ($8,748 less than statewide median)
- Median home value, 2022: $534,900 ($181,000 less than statewide median)
- Metro area population: 4,667,558
14. Stockton, CA

- Overall cost of living, 2022: 8.5% higher than U.S. average
- Median household income, 2022: $86,056 ($5,495 less than statewide median)
- Median home value, 2022: $535,800 ($180,100 less than statewide median)
- Metro area population: 793,229
13. Sacramento-Roseville-Folsom, CA

- Overall cost of living, 2022: 9.9% higher than U.S. average
- Median household income, 2022: $89,237 ($2,314 less than statewide median)
- Median home value, 2022: $584,200 ($131,700 less than statewide median)
- Metro area population: 2,416,702
12. Santa Rosa-Petaluma, CA

- Overall cost of living, 2022: 12.5% higher than U.S. average
- Median household income, 2022: $96,830 ($5,279 more than statewide median)
- Median home value, 2022: $771,000 ($55,100 more than statewide median)
- Metro area population: 482,650
11. Vallejo, CA

- Overall cost of living, 2022: 12.6% higher than U.S. average
- Median household income, 2022: $92,959 ($1,408 more than statewide median)
- Median home value, 2022: $605,300 ($110,600 less than statewide median)
- Metro area population: 448,747
10. San Luis Obispo-Paso Robles, CA
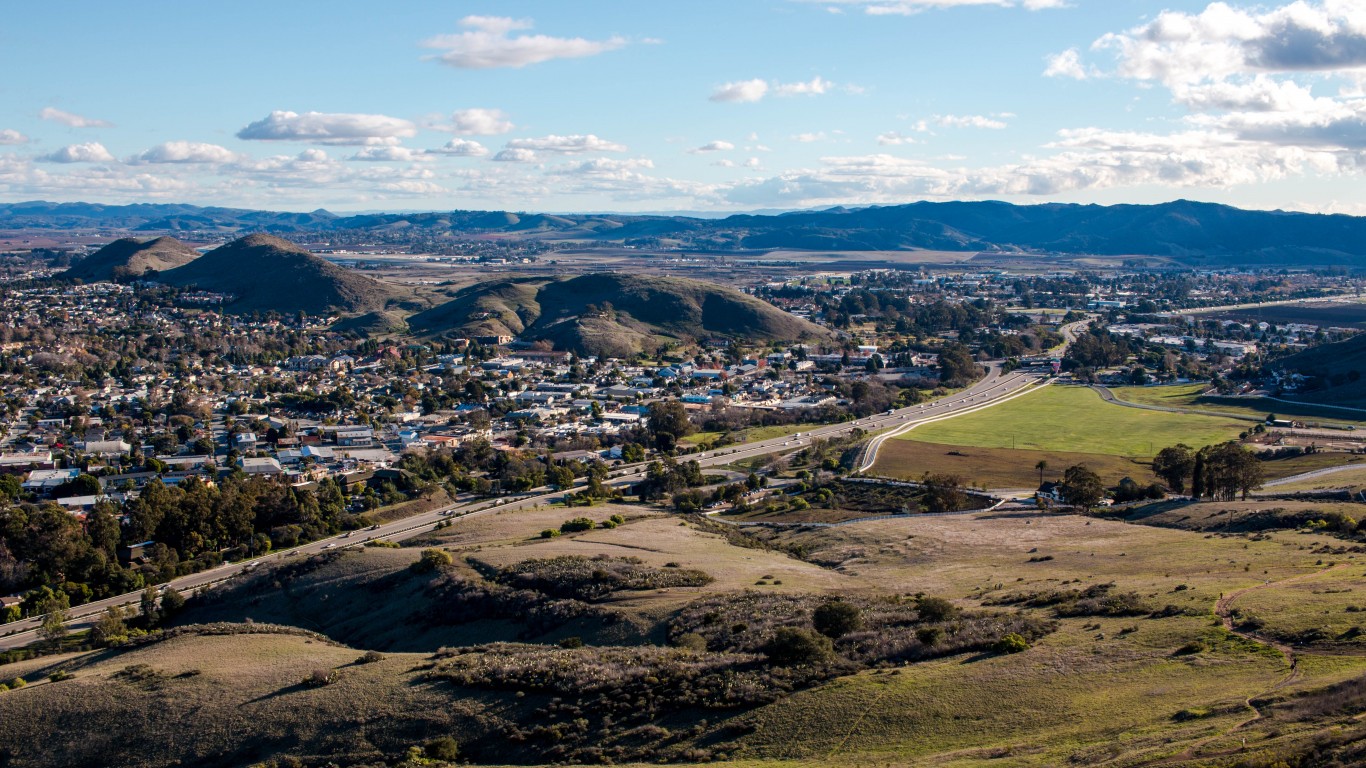
- Overall cost of living, 2022: 12.6% higher than U.S. average
- Median household income, 2022: $90,216 ($1,335 less than statewide median)
- Median home value, 2022: $776,400 ($60,500 more than statewide median)
- Metro area population: 282,013
9. Napa, CA

- Overall cost of living, 2022: 12.9% higher than U.S. average
- Median household income, 2022: $100,318 ($8,767 more than statewide median)
- Median home value, 2022: $866,300 ($150,400 more than statewide median)
- Metro area population: 134,300
8. Salinas, CA
- Overall cost of living, 2022: 13.1% higher than U.S. average
- Median household income, 2022: $92,840 ($1,289 more than statewide median)
- Median home value, 2022: $732,500 ($16,600 more than statewide median)
- Metro area population: 432,858
7. Los Angeles-Long Beach-Anaheim, CA
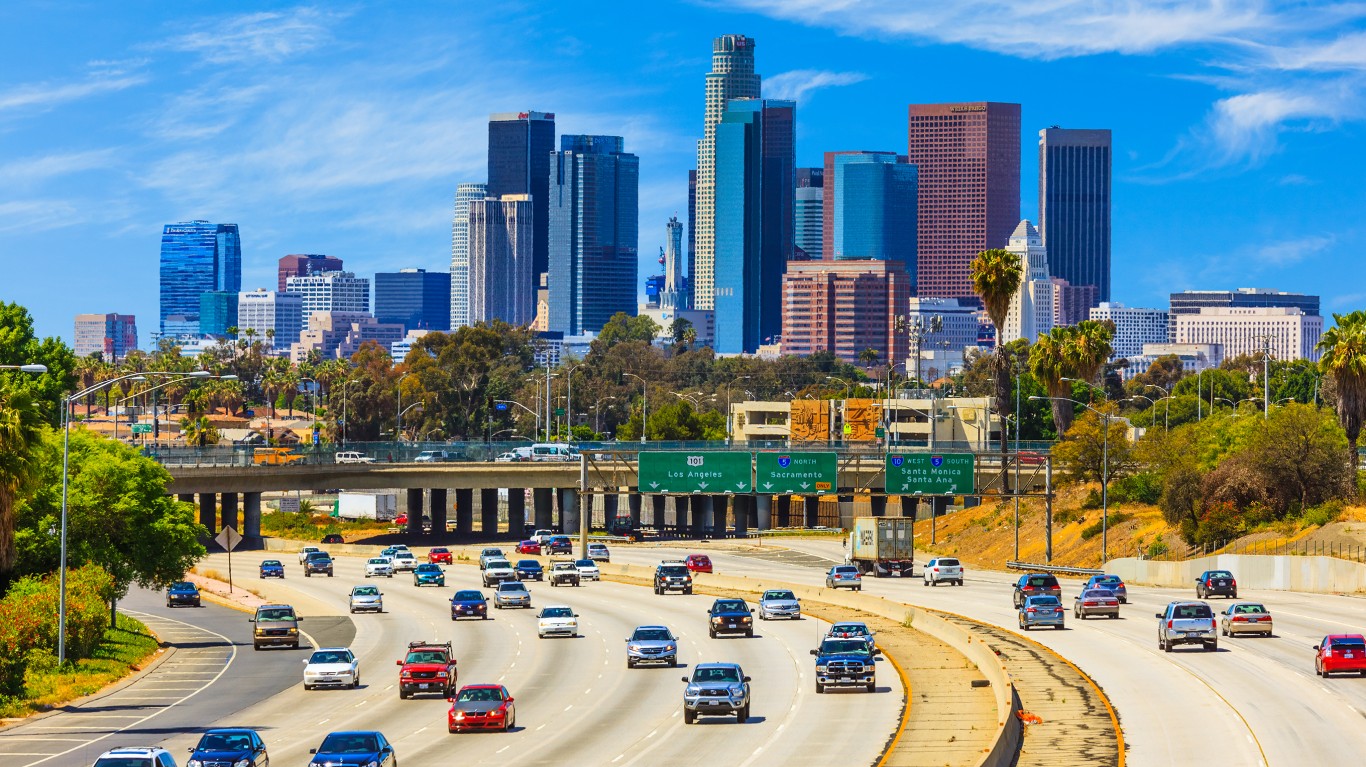
- Overall cost of living, 2022: 13.1% higher than U.S. average
- Median household income, 2022: $87,743 ($3,808 less than statewide median)
- Median home value, 2022: $847,400 ($131,500 more than statewide median)
- Metro area population: 12,872,322
6. Santa Maria-Santa Barbara, CA
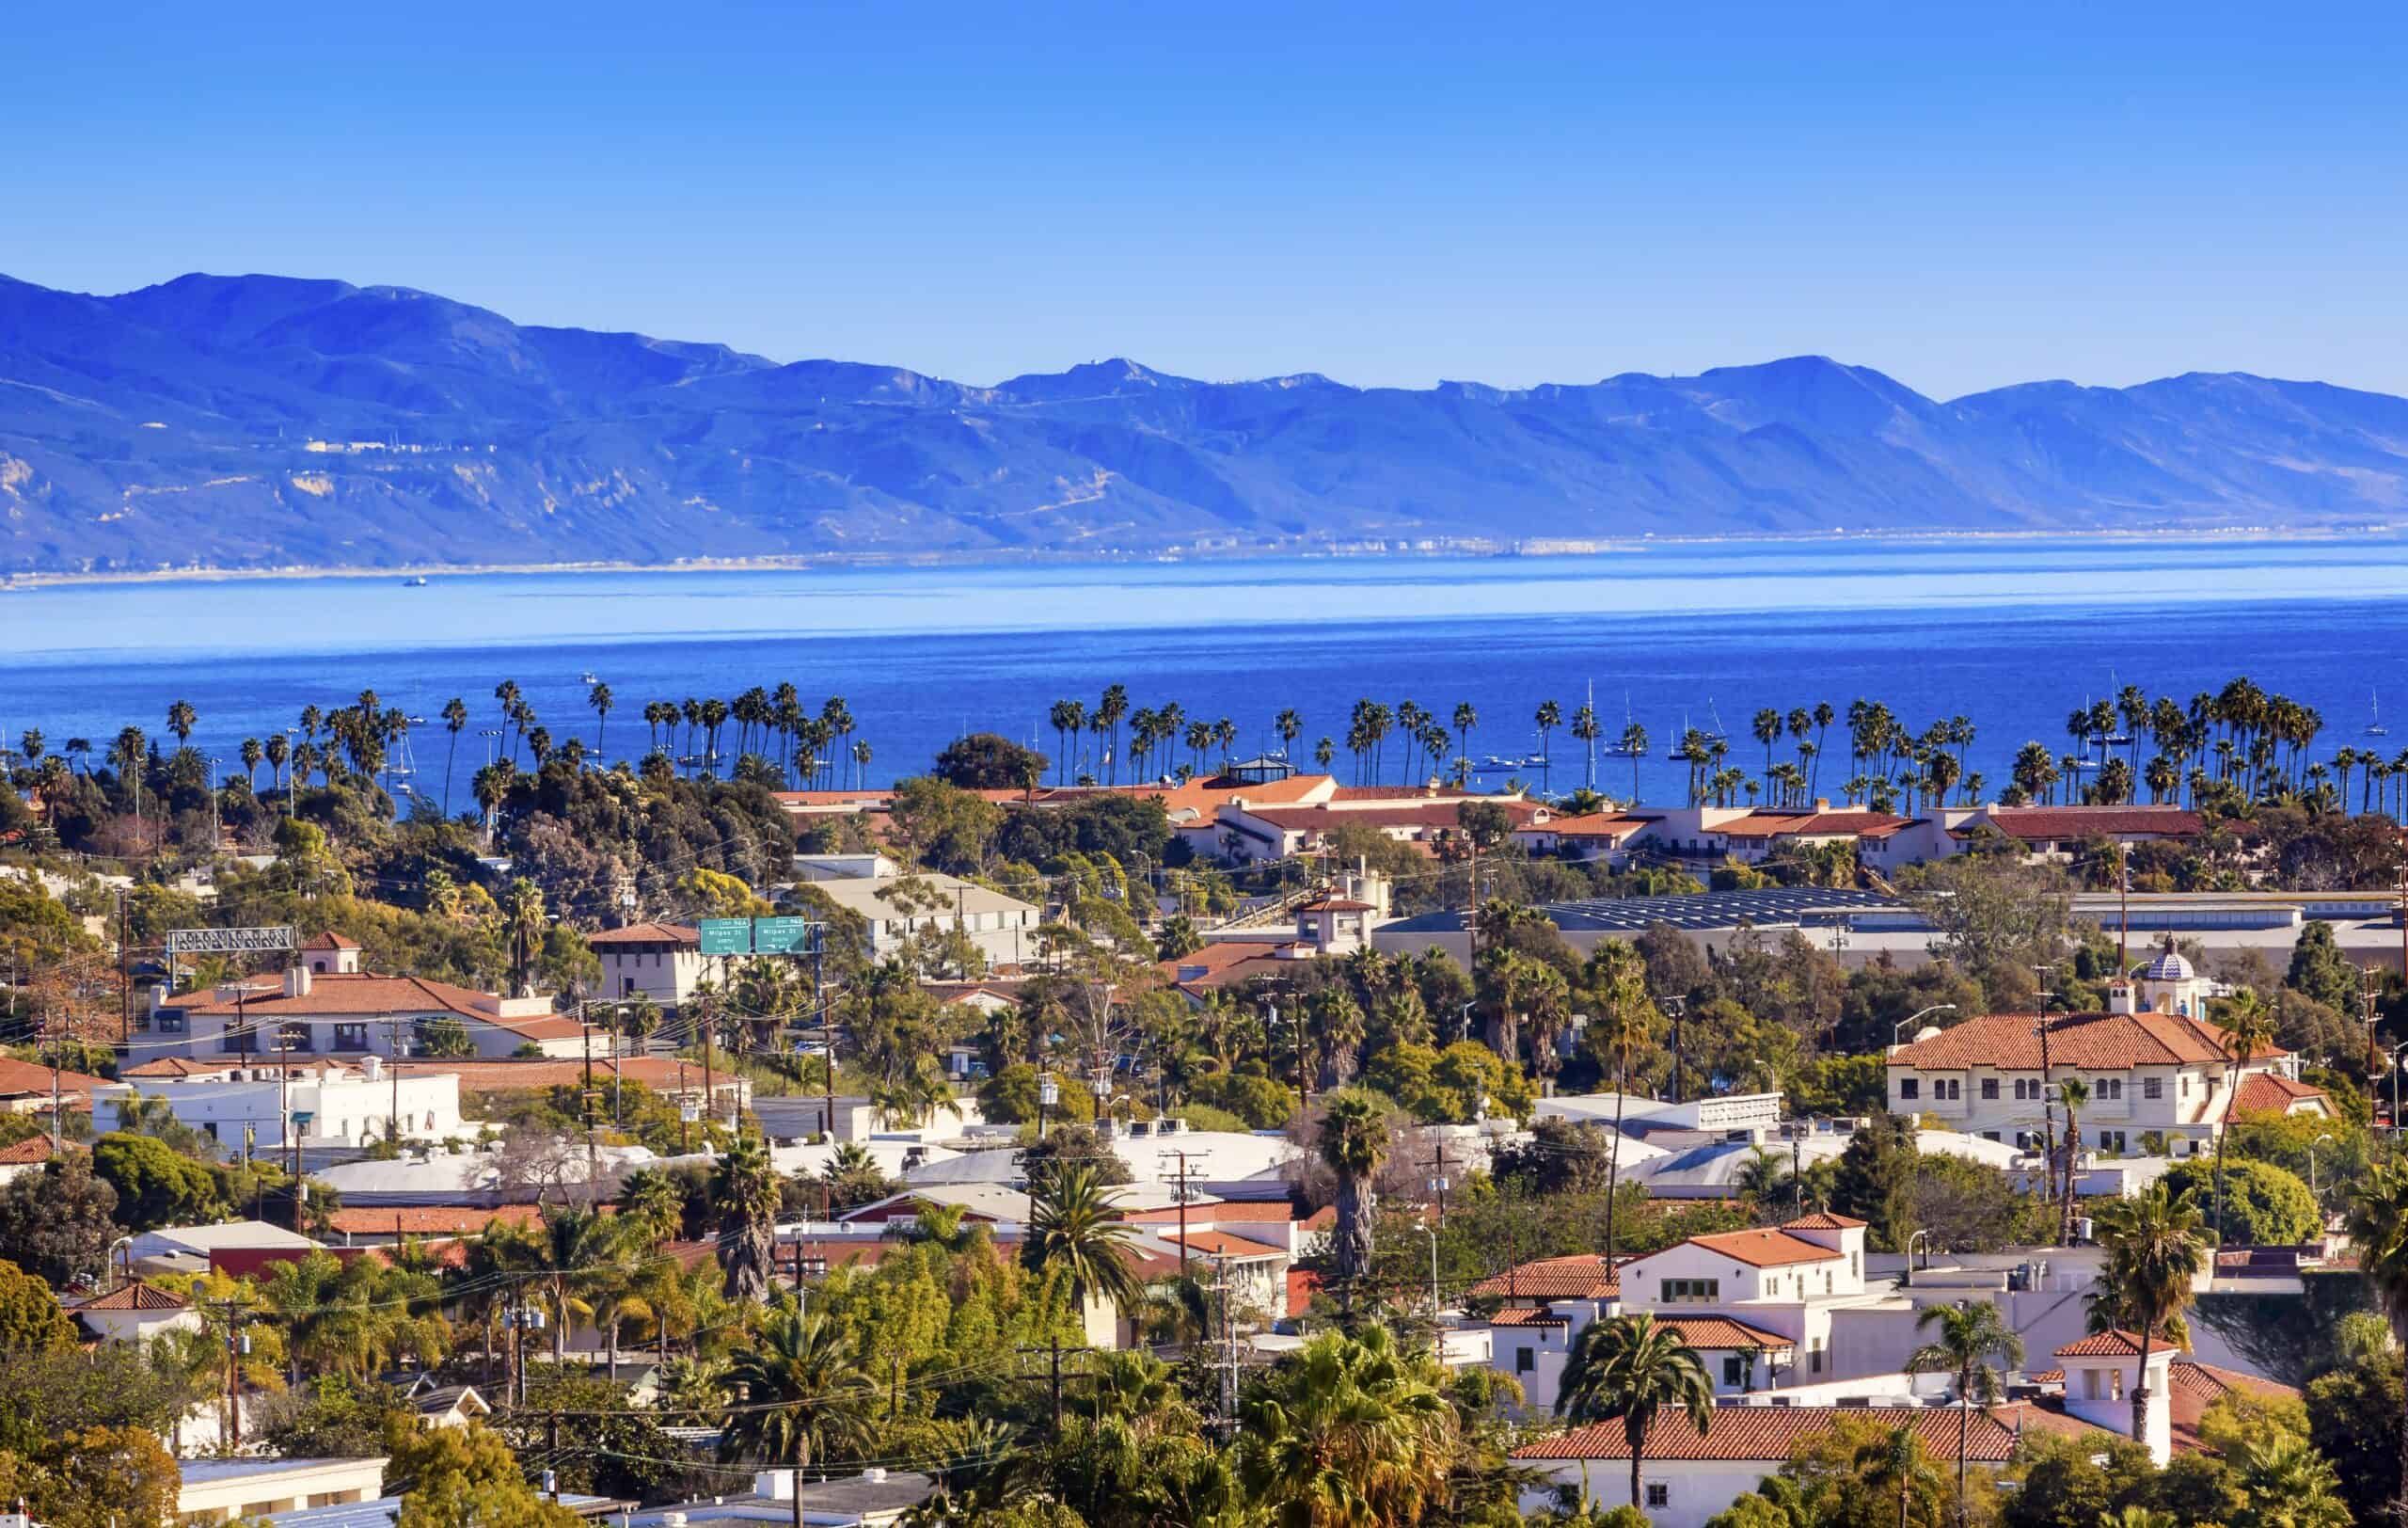
- Overall cost of living, 2022: 13.9% higher than U.S. average
- Median household income, 2022: $90,894 ($657 less than statewide median)
- Median home value, 2022: $744,700 ($28,800 more than statewide median)
- Metro area population: 443,837
5. Oxnard-Thousand Oaks-Ventura, CA
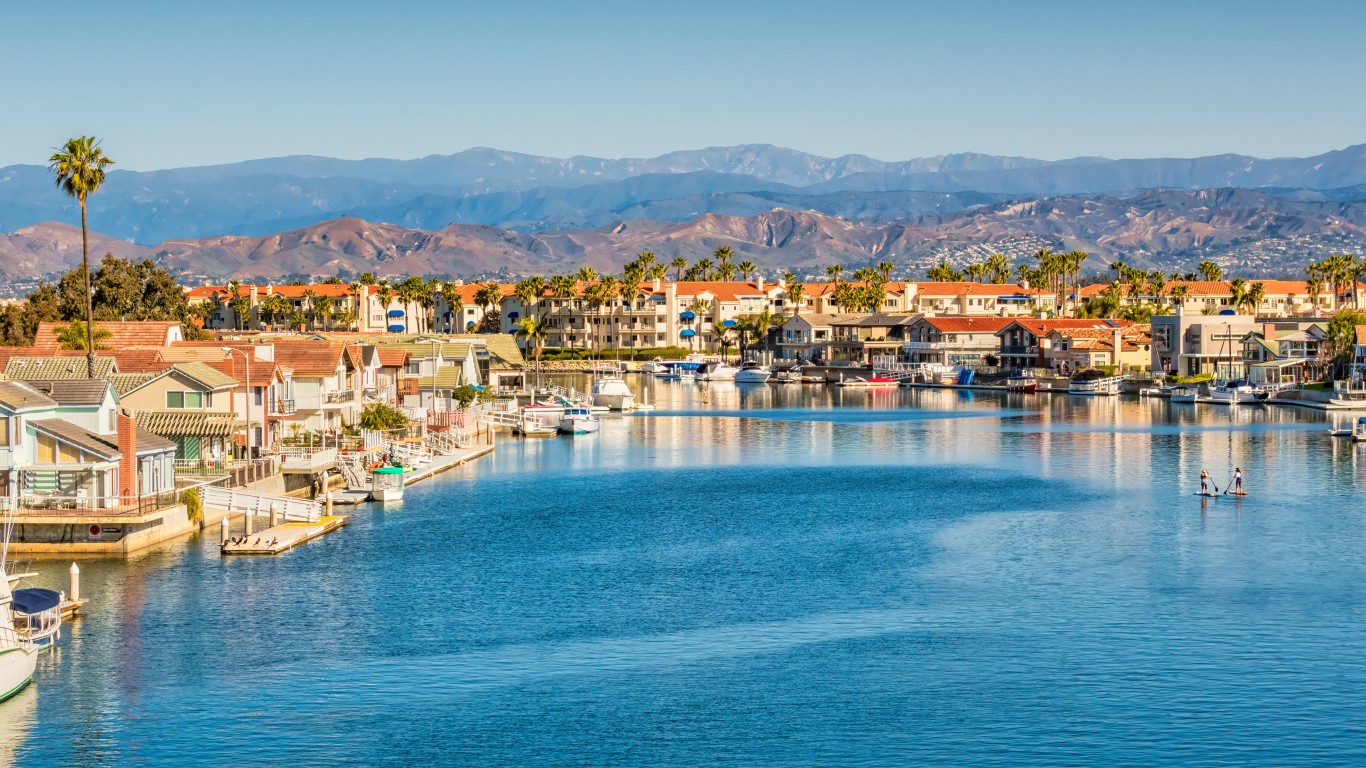
- Overall cost of living, 2022: 14.4% higher than U.S. average
- Median household income, 2022: $102,569 ($11,018 more than statewide median)
- Median home value, 2022: $796,300 ($80,400 more than statewide median)
- Metro area population: 832,605
4. San Diego-Chula Vista-Carlsbad, CA
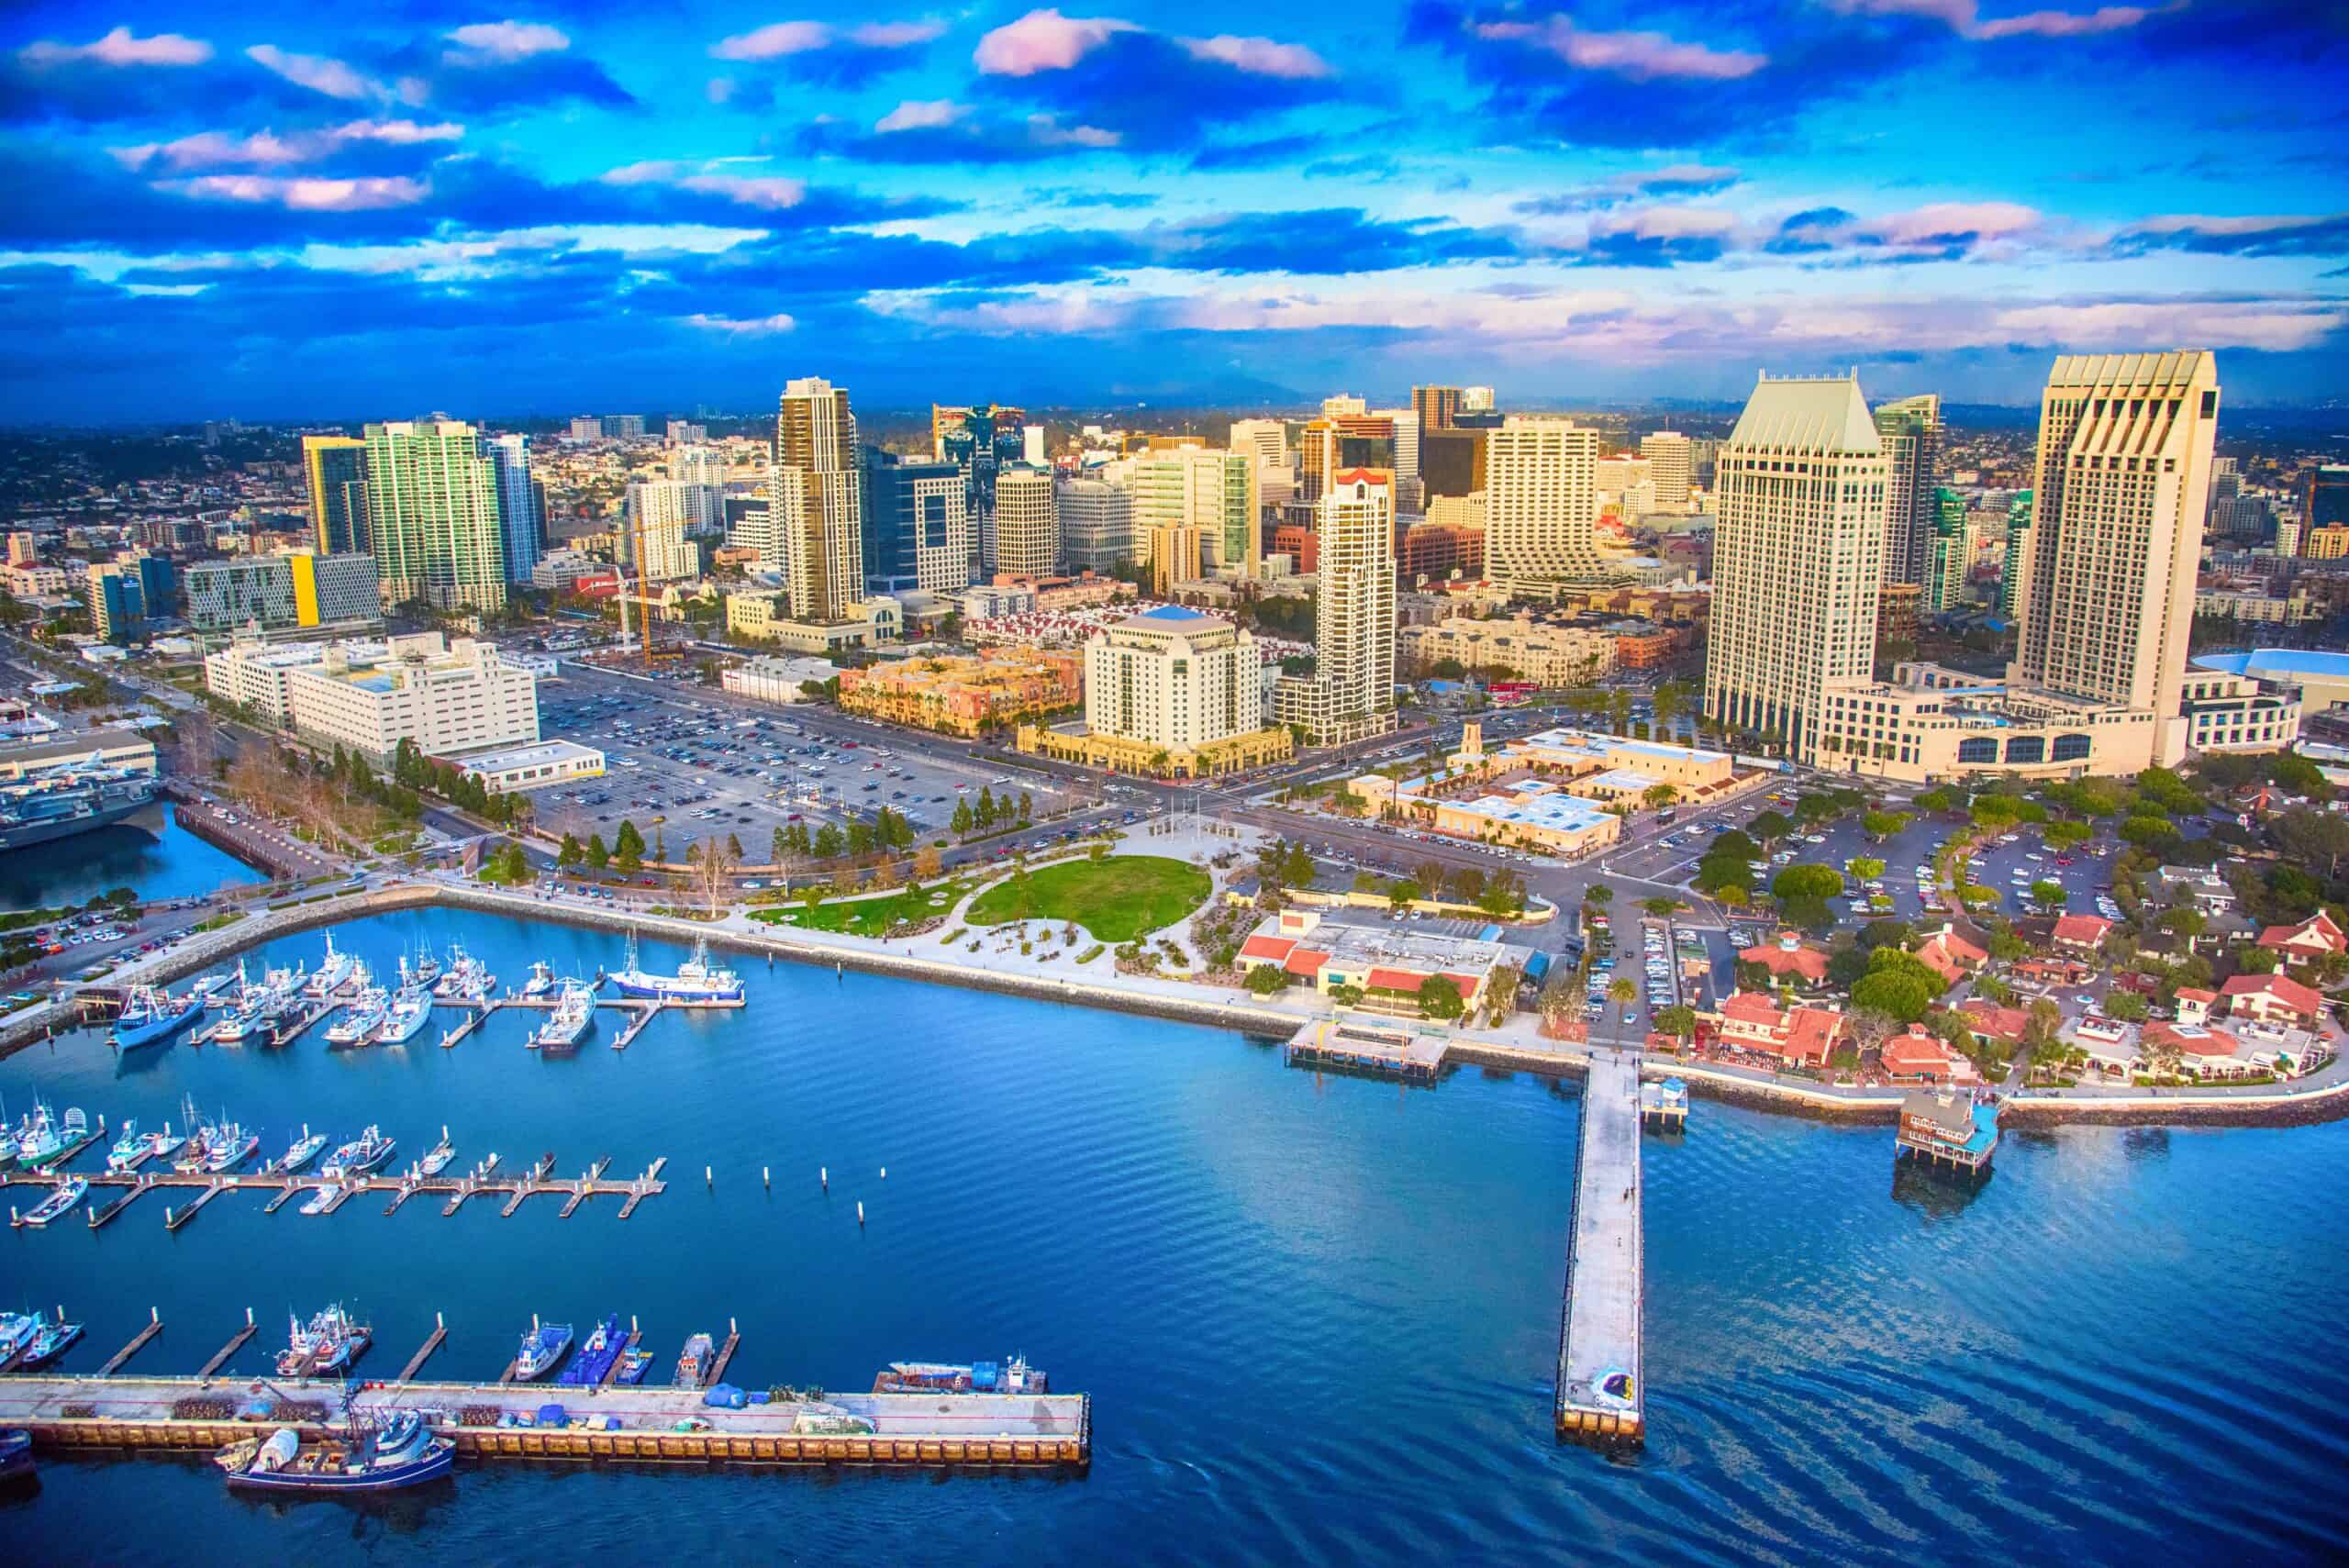
- Overall cost of living, 2022: 14.5% higher than U.S. average
- Median household income, 2022: $98,928 ($7,377 more than statewide median)
- Median home value, 2022: $846,600 ($130,700 more than statewide median)
- Metro area population: 3,276,208
3. Santa Cruz-Watsonville, CA

- Overall cost of living, 2022: 14.7% higher than U.S. average
- Median household income, 2022: $102,146 ($10,595 more than statewide median)
- Median home value, 2022: $1,013,900 ($298,000 more than statewide median)
- Metro area population: 264,370
2. San Jose-Sunnyvale-Santa Clara, CA
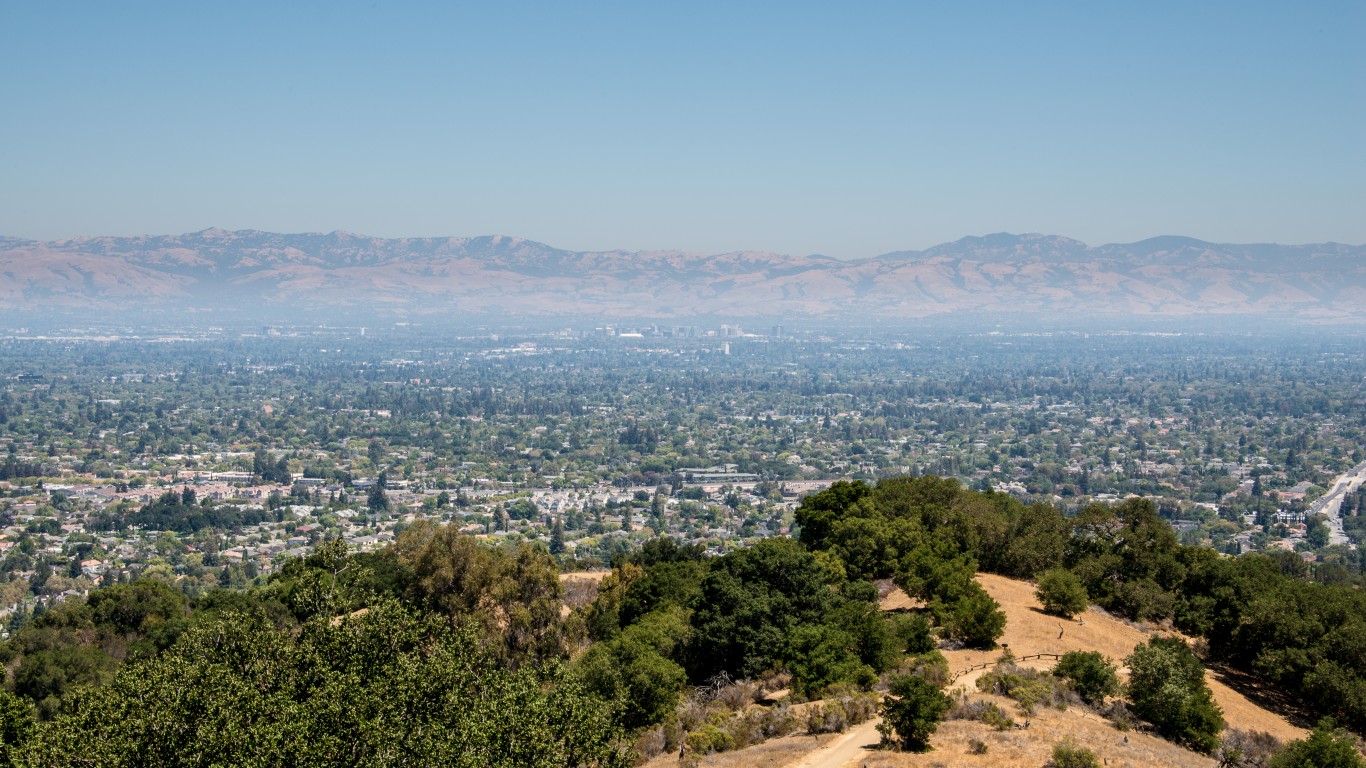
- Overall cost of living, 2022: 15.3% higher than U.S. average
- Median household income, 2022: $148,900 ($57,349 more than statewide median)
- Median home value, 2022: $1,422,600 ($706,700 more than statewide median)
- Metro area population: 1,938,524
1. San Francisco-Oakland-Berkeley, CA

- Overall cost of living, 2022: 17.9% higher than U.S. average
- Median household income, 2022: $128,151 ($36,600 more than statewide median)
- Median home value, 2022: $1,135,500 ($419,600 more than statewide median)
- Metro area population: 4,579,599
Get Ready To Retire (Sponsored)
Start by taking a quick retirement quiz from SmartAsset that will match you with up to 3 financial advisors that serve your area and beyond in 5 minutes, or less.
Each advisor has been vetted by SmartAsset and is held to a fiduciary standard to act in your best interests.
Here’s how it works:
1. Answer SmartAsset advisor match quiz
2. Review your pre-screened matches at your leisure. Check out the advisors’ profiles.
3. Speak with advisors at no cost to you. Have an introductory call on the phone or introduction in person and choose whom to work with in the future
Thank you for reading! Have some feedback for us?
Contact the 24/7 Wall St. editorial team.
Latest from 24/7


Our expert who first called NVIDIA in 2009 is predicting 2025 will see a historic AI breakthrough.
You can follow him investing $500,000 of his own money on our top AI stocks for free.