
24/7 Wall St. Insights
- Nationwide, the cost of living tends to be higher in cities than in places outside of major metro areas
- Still, consumer prices can vary considerably from one city to another, and some Michigan metro areas are more affordable for a broader range of incomes than others
- Also: 2 Dividend Legends To Hold Forever
The cost of living has skyrocketed across the United States in recent years — and rising prices are weighing heavily on the minds and pocketbooks of American families. According to a recent survey conducted by the U.S. Census Bureau, more than 57% of American households have had at least some difficulty affording their usual expenses in the last week, and over 93% of American adults reported stress related to higher prices in the last two months.
The rate of inflation began to surge in early 2021, and ultimately peaked in June 2022, when the price of goods and services were 9.1% higher than they were 12 months earlier, according to the Consumer Price Index. While inflation has cooled in the last two years, the CPI remains above the Federal Reserve’s target rate of 2%.
While no one was spared from rising consumer prices, in relative terms, the overall cost of living varies considerably across the country. In Michigan, for example, goods and services were about 6.6% less expensive, on average, than they were nationwide in 2022 — the latest year of available data. Despite a lower cost of living, 55.3% of Michigan households had difficulty paying for household expenses in the last week, and 92.7% of adults in the state reported stress resulting from rising prices. (Here is a look at the most expensive states to live in.)
Generally, Americans living in major cities are saddled with a higher cost of living than those in smaller, rural communities. According to the Bureau of Economic Analysis, goods and services are about 11.4% more expensive within U.S. metro areas than they are outside of metro areas.
In keeping with this pattern, goods and services are only about 5.3% less expensive than average across all 14 Michigan metro areas, and 12.3% less expensive in non-metro areas. Still, the overall cost of living can vary meaningfully between one Michigan city and another. In the state’s least expensive metro area, consumer prices are about 13.0% lower than they are nationwide on average. Meanwhile, in the state’s most expensive city, prices are only about 2.3% lower than average. (Here is a look at the most affordable town in every state.)
Consumer prices tend to rise when demand for goods and services outpaces supply. Because cost of living is closely tied to consumer spending, it is no coincidence that more affluent areas are typically more expensive places to live than lower income communities. While there are exceptions, the median household income in some of the most expensive cities on this list is higher than the comparable statewide median income of $66,986.
This is the cost of living in every Michigan metro area, ranked.
Why It Matters

Inflation, as measured by the Consumer Price Index, hit a multi-decade high in 2022, and as of July 2024, the CPI remains well above the Federal Reserve’s 2% target. Even though prices tend to be far higher in cities than in rural communities, the vast majority of Americans — 80% according to the U.S. Census Bureau — live in an urban area. Still, consumer prices can vary considerably from one city to another, and some Michigan metro areas are more affordable for a broader range of incomes than others.
14. Saginaw, MI

- Overall cost of living, 2022: 13.0% lower than U.S. average
- Median household income, 2022: $53,646 ($13,340 less than statewide median)
- Median home value, 2022: $146,600 ($77,800 less than statewide median)
- Metro area population: 188,330
13. Niles, MI

- Overall cost of living, 2022: 12.1% lower than U.S. average
- Median household income, 2022: $61,333 ($5,653 less than statewide median)
- Median home value, 2022: $221,700 ($2,700 less than statewide median)
- Metro area population: 152,900
11. Bay City, MI

- Overall cost of living, 2022: 12.0% lower than U.S. average
- Median household income, 2022: $55,134 ($11,852 less than statewide median)
- Median home value, 2022: $139,900 ($84,500 less than statewide median)
- Metro area population: 102,821
11. Midland, MI

- Overall cost of living, 2022: 12.0% lower than U.S. average
- Median household income, 2022: $78,487 ($11,501 more than statewide median)
- Median home value, 2022: $186,800 ($37,600 less than statewide median)
- Metro area population: 83,674
10. Battle Creek, MI
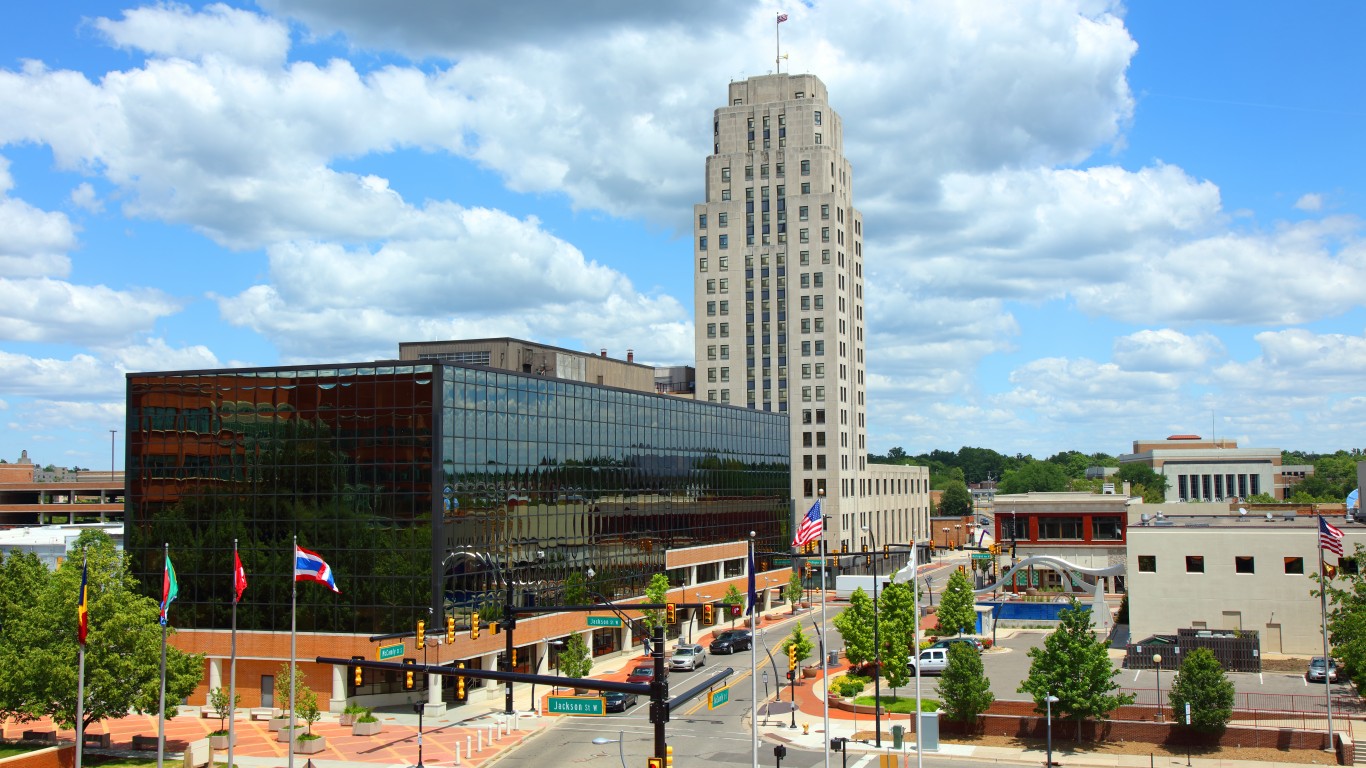
- Overall cost of living, 2022: 10.7% lower than U.S. average
- Median household income, 2022: $59,522 ($7,464 less than statewide median)
- Median home value, 2022: $156,300 ($68,100 less than statewide median)
- Metro area population: 133,289
9. Flint, MI
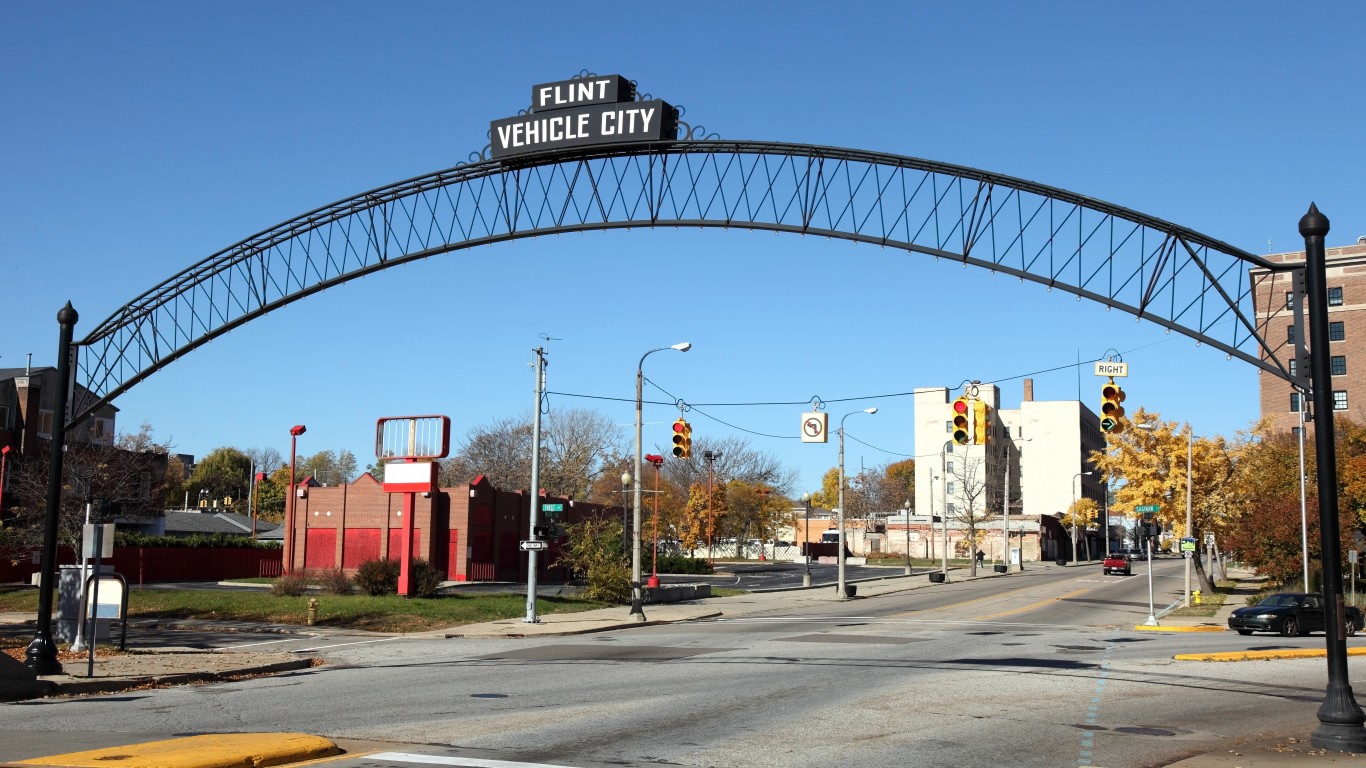
- Overall cost of living, 2022: 9.3% lower than U.S. average
- Median household income, 2022: $57,003 ($9,983 less than statewide median)
- Median home value, 2022: $174,200 ($50,200 less than statewide median)
- Metro area population: 401,983
8. Jackson, MI
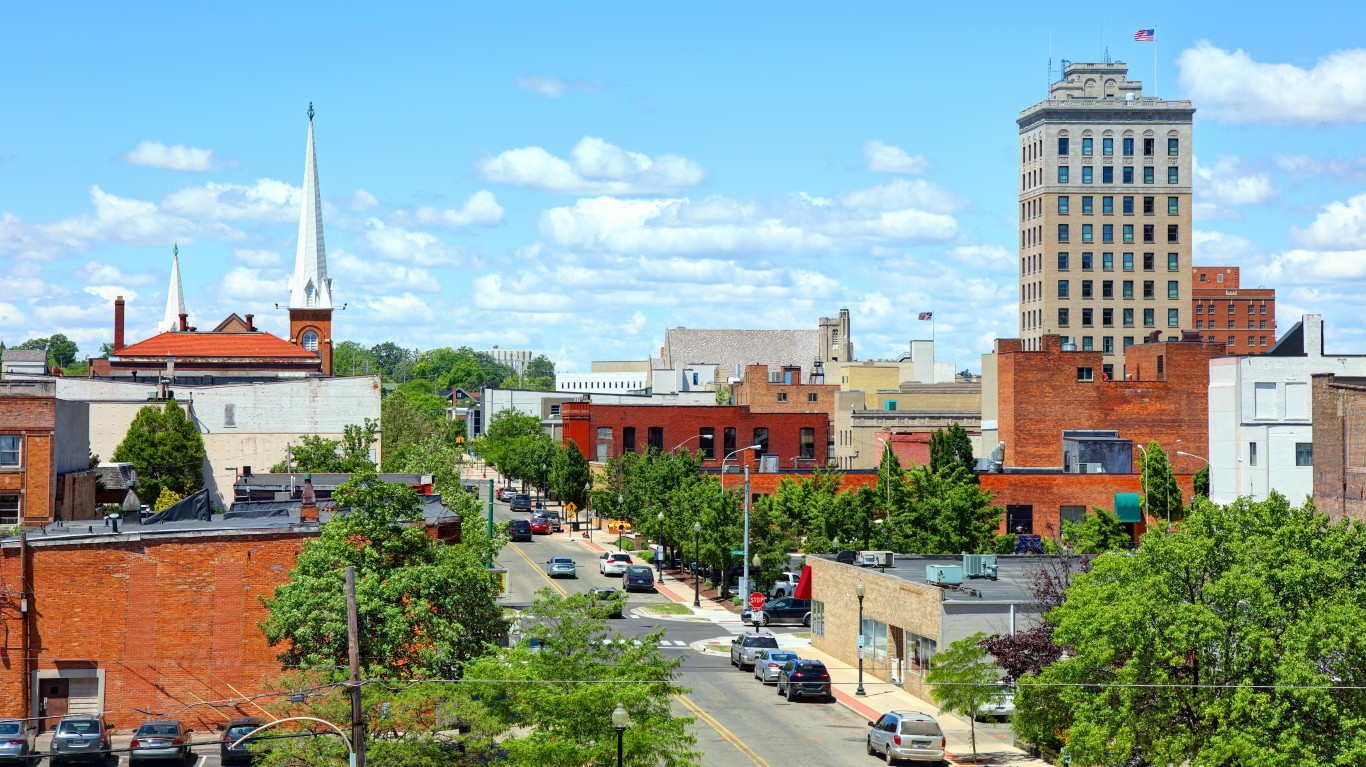
- Overall cost of living, 2022: 8.7% lower than U.S. average
- Median household income, 2022: $59,059 ($7,927 less than statewide median)
- Median home value, 2022: $173,000 ($51,400 less than statewide median)
- Metro area population: 160,066
7. Muskegon, MI

- Overall cost of living, 2022: 8.3% lower than U.S. average
- Median household income, 2022: $58,074 ($8,912 less than statewide median)
- Median home value, 2022: $182,400 ($42,000 less than statewide median)
- Metro area population: 176,565
6. Monroe, MI

- Overall cost of living, 2022: 6.9% lower than U.S. average
- Median household income, 2022: $69,563 ($2,577 more than statewide median)
- Median home value, 2022: $212,800 ($11,600 less than statewide median)
- Metro area population: 155,609
5. Lansing-East Lansing, MI
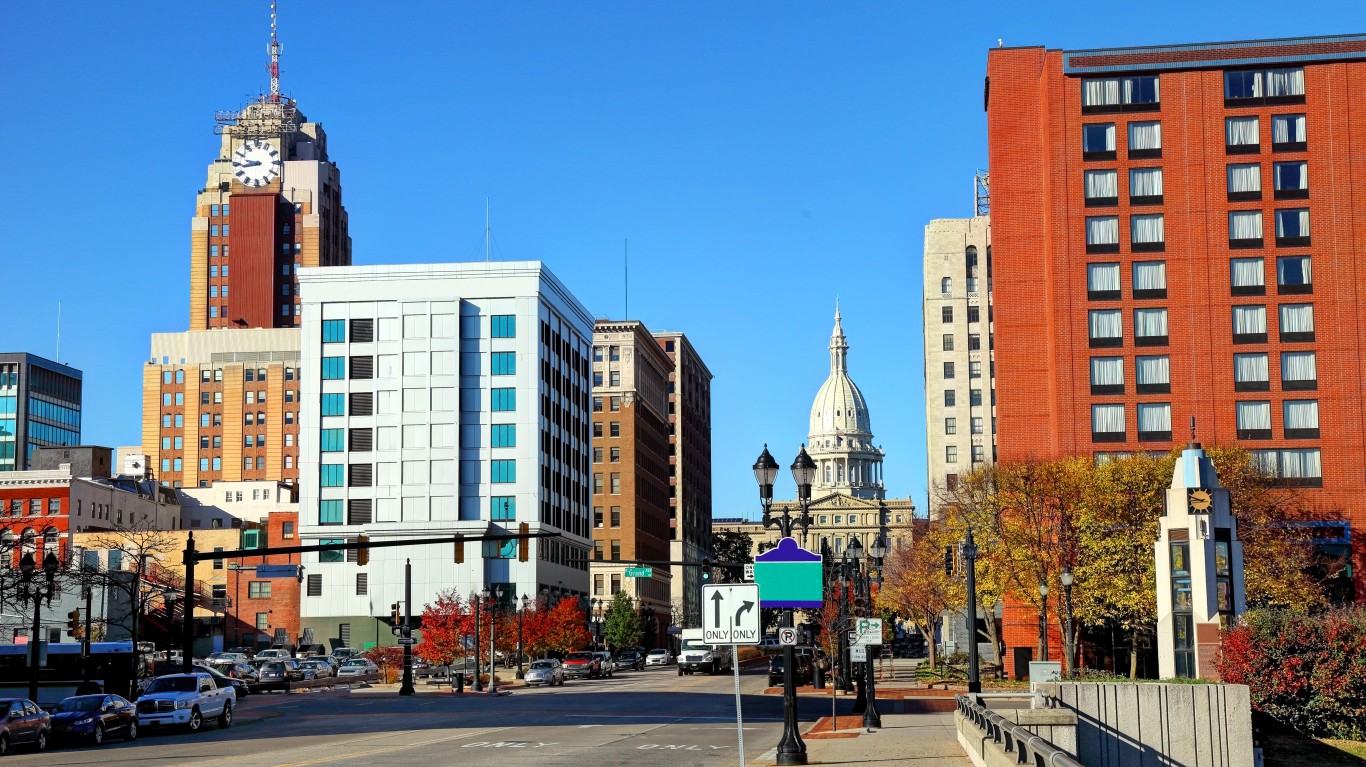
- Overall cost of living, 2022: 6.2% lower than U.S. average
- Median household income, 2022: $64,478 ($2,508 less than statewide median)
- Median home value, 2022: $194,700 ($29,700 less than statewide median)
- Metro area population: 540,870
4. Grand Rapids-Kentwood, MI

- Overall cost of living, 2022: 5.8% lower than U.S. average
- Median household income, 2022: $77,771 ($10,785 more than statewide median)
- Median home value, 2022: $279,100 ($54,700 more than statewide median)
- Metro area population: 1,094,198
3. Kalamazoo-Portage, MI

- Overall cost of living, 2022: 5.4% lower than U.S. average
- Median household income, 2022: $69,584 ($2,598 more than statewide median)
- Median home value, 2022: $236,300 ($11,900 more than statewide median)
- Metro area population: 261,173
2. Detroit-Warren-Dearborn, MI
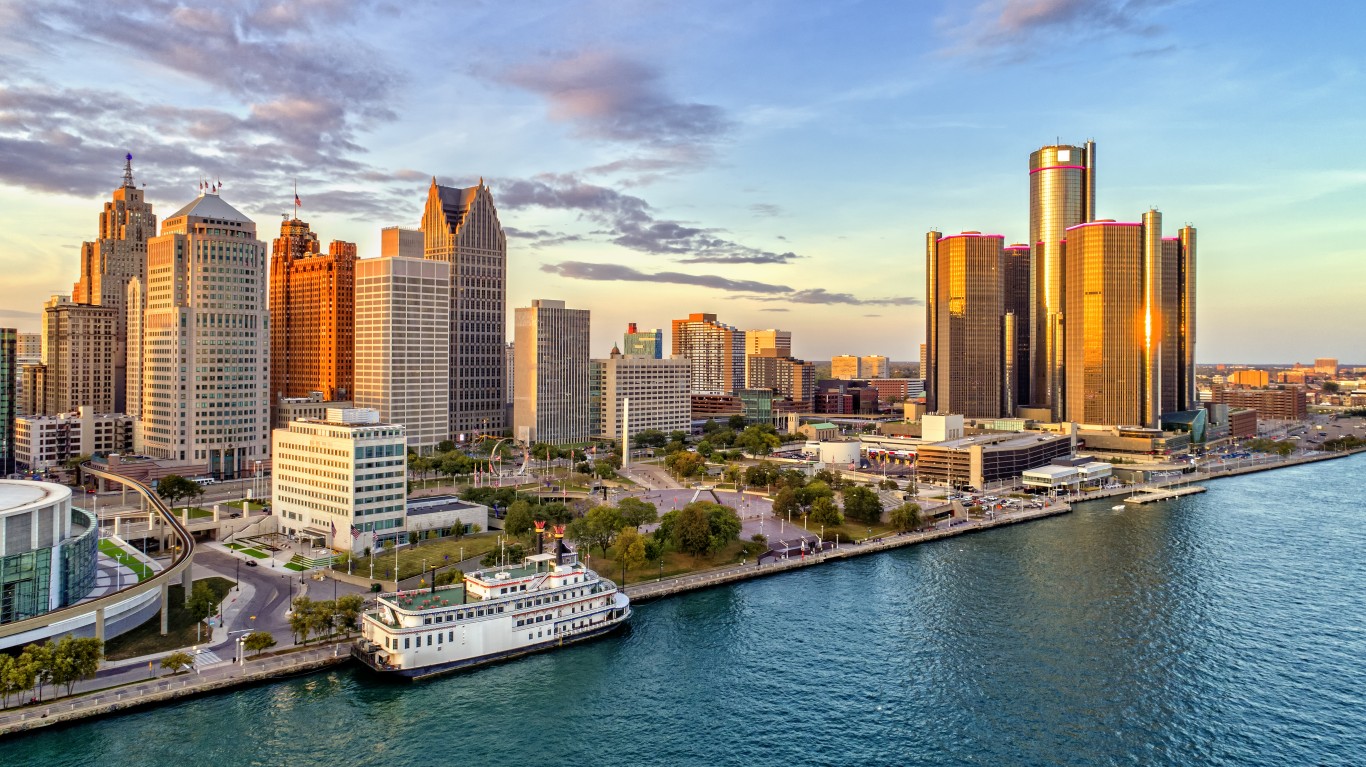
- Overall cost of living, 2022: 3.9% lower than U.S. average
- Median household income, 2022: $71,265 ($4,279 more than statewide median)
- Median home value, 2022: $245,500 ($21,100 more than statewide median)
- Metro area population: 4,345,761
1. Ann Arbor, MI
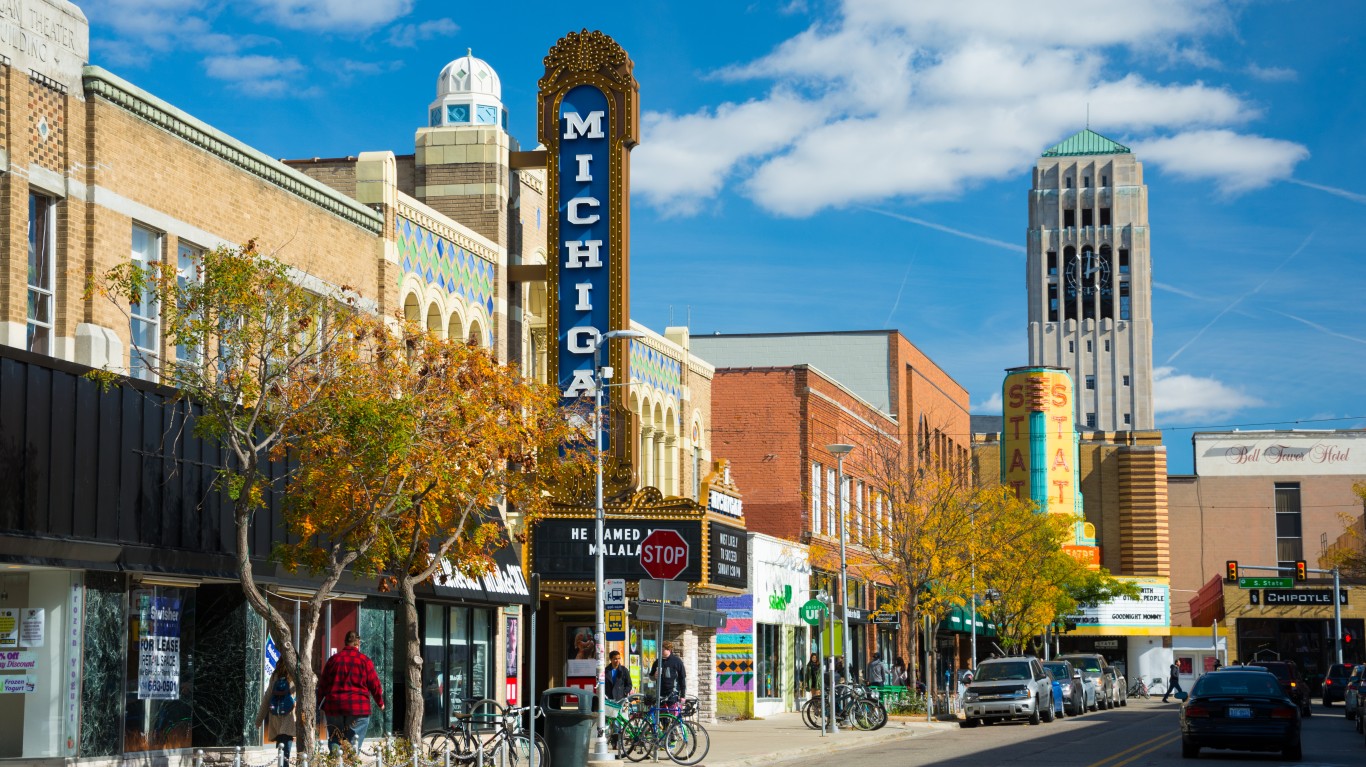
- Overall cost of living, 2022: 2.3% lower than U.S. average
- Median household income, 2022: $79,665 ($12,679 more than statewide median)
- Median home value, 2022: $364,600 ($140,200 more than statewide median)
- Metro area population: 366,376
Thank you for reading! Have some feedback for us?
Contact the 24/7 Wall St. editorial team.


