
24/7 Wall St. Insights
- Coastal states tend to be the most expensive to live in.
- States are ranked based on five consumer categories—groceries, housing, utilities, transportation, and health care.
Also, Discover “The Next NVIDIA”
America is a huge country, with dozens of sprawling states. The U.S. is also notorious for its income equality. According to a global survey, 26 western countries score higher on equality than America. There is great variety across states in terms of home prices, food costs, and general cost of living.
To identify the most expensive states to live in, 24/7 Wall St. reviewed data from the Composite Cost of Living Index published by the Missouri Economic Research and Information Center. States and the District of Columbia are ranked based on their cost-of-living index in 2023 from the least to most expensive state to live in. The index is relative to the national average of 100, so lower values are cheaper and higher values are more expensive.
Coastal states tend to be the most expensive to live in. Out of the top 10 most costly states, three are on the West Coast (California, Oregon, and Washington), while five are on the East Coast (Vermont, Massachusetts, Maryland, New York, and D.C.). The last two are Alaska and Hawaii, the latter being the priciest state in the nation.
In addition to the overall cost of living index, MERIC provided cost of living in five consumer categories– groceries, housing, utilities, transportation, and health care. While housing is the cheapest category in the 27 least expensive states, it is the most expensive category in the 10 most expensive places, with housing costs ranging anywhere from 28% to 213% more expensive than the national average.
Incomes tend to reflect differences in cost of living adst the state level. In 17 of the 23 states (and DC) with a higher cost of living than the national average, the median household income is higher than the national median of $74,755. Conversely, only two of the 28 states with a lower cost of living have a higher median income than the national average.
Supplemental data on median household income and poverty rate came from the Census Bureau’s 2022 American Community survey, while regional annual inflation rate (consumer price index change) for February 2024 came from the Bureau of Labor Statistics.
Why We Are Mentioning This

Money and cost of living are big issues for many Americans, with 77% of the national population concerned about their financial future, according to a Mind Over Money survey by Capital One and The Decision Lab. Though living in high-cost areas generally means receiving a higher salary, this bump in income is not an option for all residents, including those who lack a high school or college degree.
51. Oklahoma

- Avg. cost of living in 2023: 86.2, or 13.8% less than avg
- Most expensive category: Utilities — 98.2, or 1.8% less than avg
- Least expensive category: Housing — 68.5, or 31.5% less than avg
- Median household income, 2022: $59,673 (6th lowest)
- Poverty rate, 2022: 15.7% (8th highest)
- Inflation rate, Feb 2024: 3.5% (for West South-Central region)
50. Mississippi

- Avg. cost of living in 2023: 86.3, or 13.7% less than avg
- Most expensive category: Health — 98.4, or 1.6% less than avg
- Least expensive category: Housing — 70.9, or 29.1% less than avg
- Median household income, 2022: $52,719 (the lowest)
- Poverty rate, 2022: 19.1% (the highest)
- Inflation rate, Feb 2024: 3.5% (for East South-Central region)
49. Kansas

- Avg. cost of living in 2023: 87.1, or 12.9% less than avg
- Most expensive category: Utilities — 106.6, or 6.6% more than avg
- Least expensive category: Housing — 67.4, or 32.6% less than avg
- Median household income, 2022: $68,925 (17th lowest)
- Poverty rate, 2022: 12.0% (25th lowest)
- Inflation rate, Feb 2024: 3.0% (for West North-Central region)
48. West Virginia

- Avg. cost of living in 2023: 87.7, or 12.3% less than avg
- Most expensive category: Grocery — 98.4, or 1.6% less than avg
- Least expensive category: Housing — 66.9, or 33.1% less than avg
- Median household income, 2022: $54,329 (2nd lowest)
- Poverty rate, 2022: 17.9% (3rd highest)
- Inflation rate, Feb 2024: 3.9% (for South Atlantic region)
47. Alabama

- Avg. cost of living in 2023: 88.3, or 11.7% less than avg
- Most expensive category: Utilities — 102.4, or 2.4% more than avg
- Least expensive category: Housing — 70, or 30% less than avg
- Median household income, 2022: $59,674 (7th lowest)
- Poverty rate, 2022: 16.2% (7th highest)
- Inflation rate, Feb 2024: 3.5% (for East South-Central region)
46. Missouri

- Avg. cost of living in 2023: 88.5, or 11.5% less than avg
- Most expensive category: Utilities — 98.6, or 1.4% less than avg
- Least expensive category: Housing — 77, or 23% less than avg
- Median household income, 2022: $64,811 (10th lowest)
- Poverty rate, 2022: 13.2% (16th highest)
- Inflation rate, Feb 2024: 3.0% (for West North-Central region)
45. Arkansas

- Avg. cost of living in 2023: 89.0, or 11.0% less than avg
- Most expensive category: Grocery — 95.3, or 4.7% less than avg
- Least expensive category: Housing — 74.6, or 25.4% less than avg
- Median household income, 2022: $55,432 (4th lowest)
- Poverty rate, 2022: 16.8% (5th highest)
- Inflation rate, Feb 2024: 3.5% (for West South-Central region)
44. Tennessee

- Avg. cost of living in 2023: 90.3, or 9.7% less than avg
- Most expensive category: Grocery — 97.7, or 2.3% less than avg
- Least expensive category: Housing — 82.4, or 17.6% less than avg
- Median household income, 2022: $65,254 (11th lowest)
- Poverty rate, 2022: 13.3% (15th highest)
- Inflation rate, Feb 2024: 3.5% (for East South-Central region)
43. Iowa

- Avg. cost of living in 2023: 90.3, or 9.7% less than avg
- Most expensive category: Health — 99.4, or 0.6% less than avg
- Least expensive category: Housing — 74.1, or 25.9% less than avg
- Median household income, 2022: $69,588 (20th lowest)
- Poverty rate, 2022: 11.0% (18th lowest)
- Inflation rate, Feb 2024: 3.0% (for West North-Central region)
42. Michigan

- Avg. cost of living in 2023: 90.6, or 9.4% less than avg
- Most expensive category: Utilities — 101.1, or 1.1% more than avg
- Least expensive category: Housing — 77.1, or 22.9% less than avg
- Median household income, 2022: $66,986 (14th lowest)
- Poverty rate, 2022: 13.4% (13th highest)
- Inflation rate, Feb 2024: 2.6% (for East North-Central region)
41. Georgia

- Avg. cost of living in 2023: 90.8, or 9.2% less than avg
- Most expensive category: Health — 100.3, or 0.3% more than avg
- Least expensive category: Housing — 78.2, or 21.8% less than avg
- Median household income, 2022: $72,837 (22nd highest)
- Poverty rate, 2022: 12.7% (19th highest)
- Inflation rate, Feb 2024: 3.9% (for South Atlantic region)
40. Nebraska

- Avg. cost of living in 2023: 90.9, or 9.1% less than avg
- Most expensive category: Transportation — 100, or 0% average
- Least expensive category: Housing — 78.6, or 21.4% less than avg
- Median household income, 2022: $69,597 (21st lowest)
- Poverty rate, 2022: 11.2% (20th lowest)
- Inflation rate, Feb 2024: 3.0% (for West North-Central region)
39. Louisiana

- Avg. cost of living in 2023: 91.0, or 9.0% less than avg
- Most expensive category: Health — 98.7, or 1.3% less than avg
- Least expensive category: Housing — 81.6, or 18.4% less than avg
- Median household income, 2022: $55,416 (3rd lowest)
- Poverty rate, 2022: 18.6% (2nd highest)
- Inflation rate, Feb 2024: 3.5% (for West South-Central region)
38. Indiana

- Avg. cost of living in 2023: 91.0, or 9.0% less than avg
- Most expensive category: Utilities — 106.7, or 6.7% more than avg
- Least expensive category: Housing — 75.8, or 24.2% less than avg
- Median household income, 2022: $66,785 (13th lowest)
- Poverty rate, 2022: 12.6% (20th highest)
- Inflation rate, Feb 2024: 2.6% (for East North-Central region)
37. Kentucky

- Avg. cost of living in 2023: 92.0, or 8.0% less than avg
- Most expensive category: Utilities — 104.4, or 4.4% more than avg
- Least expensive category: Housing — 73.7, or 26.3% less than avg
- Median household income, 2022: $59,341 (5th lowest)
- Poverty rate, 2022: 16.5% (6th highest)
- Inflation rate, Feb 2024: 3.5% (for East South-Central region)
36. Illinois

- Avg. cost of living in 2023: 92.1, or 7.9% less than avg
- Most expensive category: Transportation — 103, or 3% more than avg
- Least expensive category: Housing — 79.8, or 20.2% less than avg
- Median household income, 2022: $76,708 (18th highest)
- Poverty rate, 2022: 11.9% (24th lowest)
- Inflation rate, Feb 2024: 2.6% (for East North-Central region)
35. South Dakota
- Avg. cost of living in 2023: 92.4, or 7.6% less than avg
- Most expensive category: Health — 97.9, or 2.1% less than avg
- Least expensive category: Housing — 87.1, or 12.9% less than avg
- Median household income, 2022: $69,728 (22nd lowest)
- Poverty rate, 2022: 12.5% (21st highest)
- Inflation rate, Feb 2024: 3.0% (for West North-Central region)
34. Wyoming

- Avg. cost of living in 2023: 92.4, or 7.6% less than avg
- Most expensive category: Grocery — 102.3, or 2.3% more than avg
- Least expensive category: Housing — 80, or 20% less than avg
- Median household income, 2022: $70,042 (23rd lowest)
- Poverty rate, 2022: 11.8% (22nd lowest)
- Inflation rate, Feb 2024: 2.5% (for Mountain region)
33. Texas

- Avg. cost of living in 2023: 92.7, or 7.3% less than avg
- Most expensive category: Utilities — 104, or 4% more than avg
- Least expensive category: Housing — 83.1, or 16.9% less than avg
- Median household income, 2022: $72,284 (25th highest)
- Poverty rate, 2022: 14.0% (10th highest)
- Inflation rate, Feb 2024: 3.5% (for West South-Central region)
32. New Mexico

- Avg. cost of living in 2023: 94.0, or 6.0% less than avg
- Most expensive category: Health — 99.3, or 0.7% less than avg
- Least expensive category: Housing — 87.3, or 12.7% less than avg
- Median household income, 2022: $59,726 (8th lowest)
- Poverty rate, 2022: 17.6% (4th highest)
- Inflation rate, Feb 2024: 2.5% (for Mountain region)
31. Minnesota

- Avg. cost of living in 2023: 94.1, or 5.9% less than avg
- Most expensive category: Health — 109.2, or 9.2% more than avg
- Least expensive category: Housing — 82.1, or 17.9% less than avg
- Median household income, 2022: $82,338 (14th highest)
- Poverty rate, 2022: 9.6% (6th lowest)
- Inflation rate, Feb 2024: 3.0% (for West North-Central region)
30. North Dakota

- Avg. cost of living in 2023: 94.6, or 5.4% less than avg
- Most expensive category: Health — 111.2, or 11.2% more than avg
- Least expensive category: Housing — 83.4, or 16.6% less than avg
- Median household income, 2022: $71,970 (26th highest)
- Poverty rate, 2022: 11.5% (21st lowest)
- Inflation rate, Feb 2024: 3.0% (for West North-Central region)
29. Ohio

- Avg. cost of living in 2023: 94.7, or 5.3% less than avg
- Most expensive category: Grocery — 101.4, or 1.4% more than avg
- Least expensive category: Housing — 81.2, or 18.8% less than avg
- Median household income, 2022: $65,720 (12th lowest)
- Poverty rate, 2022: 13.4% (12th highest)
- Inflation rate, Feb 2024: 2.6% (for East North-Central region)
28. Wisconsin

- Avg. cost of living in 2023: 95.1, or 4.9% less than avg
- Most expensive category: Health — 112.3, or 12.3% more than avg
- Least expensive category: Housing — 84.7, or 15.3% less than avg
- Median household income, 2022: $70,996 (24th lowest)
- Poverty rate, 2022: 10.7% (14th lowest)
- Inflation rate, Feb 2024: 2.6% (for East North-Central region)
27. South Carolina

- Avg. cost of living in 2023: 95.3, or 4.7% less than avg
- Most expensive category: Utilities — 106.5, or 6.5% more than avg
- Least expensive category: Housing — 86.5, or 13.5% less than avg
- Median household income, 2022: $64,115 (9th lowest)
- Poverty rate, 2022: 14.0% (11th highest)
- Inflation rate, Feb 2024: 3.9% (for South Atlantic region)
26. North Carolina

- Avg. cost of living in 2023: 95.3, or 4.7% less than avg
- Most expensive category: Health — 108.1, or 8.1% more than avg
- Least expensive category: Housing — 90.2, or 9.8% less than avg
- Median household income, 2022: $67,481 (15th lowest)
- Poverty rate, 2022: 12.8% (17th highest)
- Inflation rate, Feb 2024: 3.9% (for South Atlantic region)
25. Pennsylvania

- Avg. cost of living in 2023: 95.6, or 4.4% less than avg
- Most expensive category: Utilities — 107.3, or 7.3% more than avg
- Least expensive category: Housing — 81.9, or 18.1% less than avg
- Median household income, 2022: $71,798 (25th lowest)
- Poverty rate, 2022: 11.8% (23rd lowest)
- Inflation rate, Feb 2024: 2.6% (for Middle Atlantic region)
24. Idaho

- Avg. cost of living in 2023: 98.6, or 1.4% less than avg
- Most expensive category: Transportation — 105.2, or 5.2% more than avg
- Least expensive category: Utilities — 85.7, or 14.3% less than avg
- Median household income, 2022: $72,785 (23rd highest)
- Poverty rate, 2022: 10.7% (15th lowest)
- Inflation rate, Feb 2024: 2.5% (for Mountain region)
23. Florida
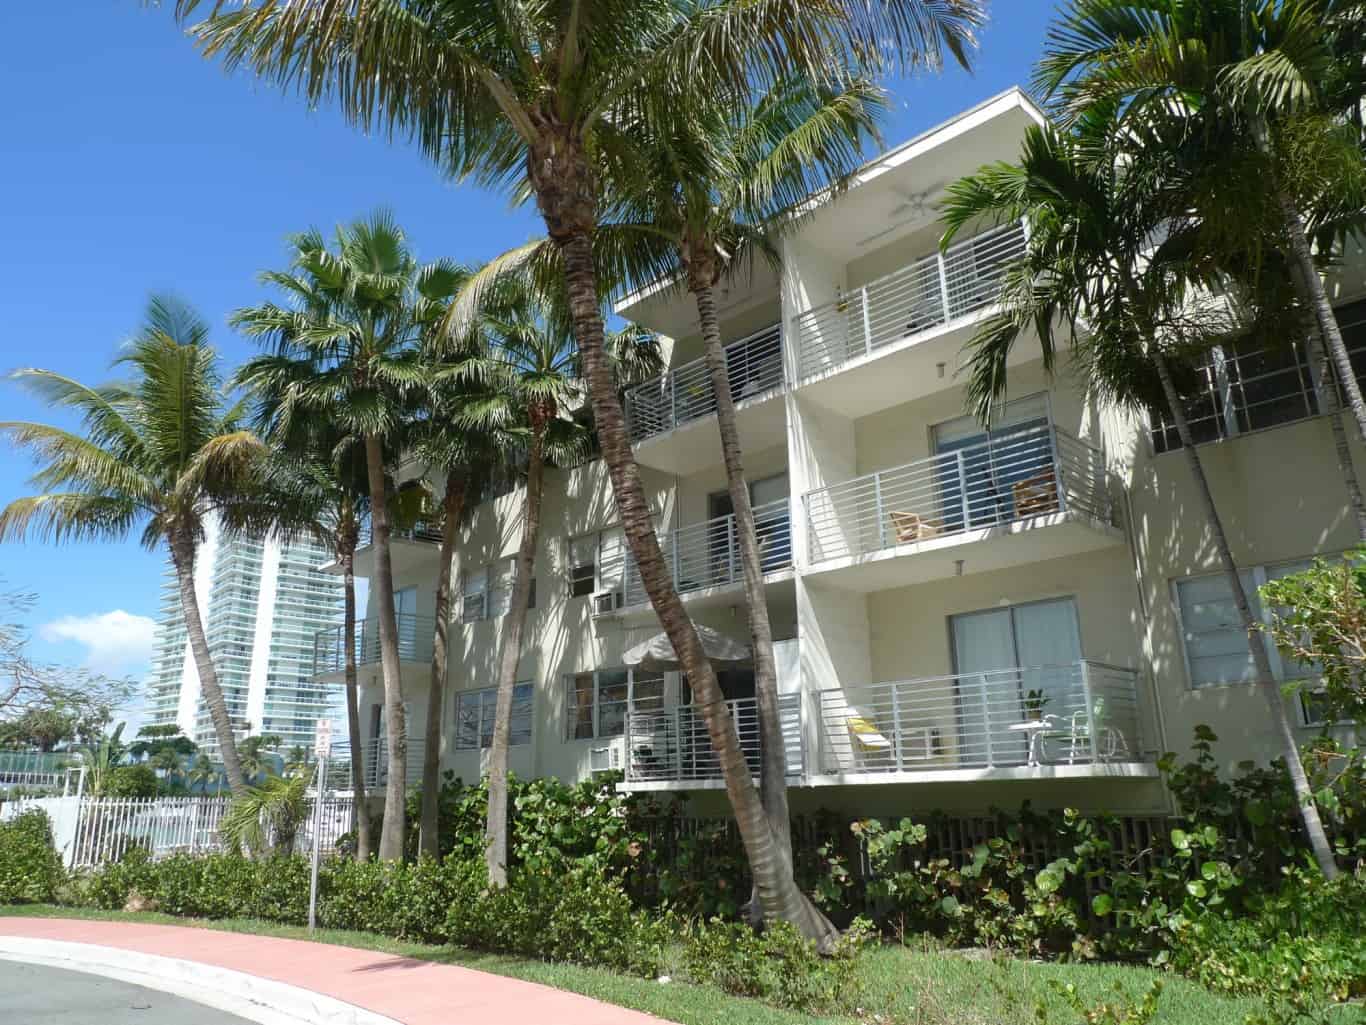
- Avg. cost of living in 2023: 100.7, or 0.7% more than avg
- Most expensive category: Housing — 106.3, or 6.3% more than avg
- Least expensive category: Health — 96.5, or 3.5% less than avg
- Median household income, 2022: $69,303 (18th lowest)
- Poverty rate, 2022: 12.7% (18th highest)
- Inflation rate, Feb 2024: 3.9% (for South Atlantic region)
22. Nevada

- Avg. cost of living in 2023: 101.0, or 1.0% more than avg
- Most expensive category: Transportation — 116.6, or 16.6% more than avg
- Least expensive category: Health — 91.7, or 8.3% less than avg
- Median household income, 2022: $72,333 (24th highest)
- Poverty rate, 2022: 12.5% (23rd highest)
- Inflation rate, Feb 2024: 2.5% (for Mountain region)
21. Delaware

- Avg. cost of living in 2023: 101.1, or 1.1% more than avg
- Most expensive category: Health — 103.2, or 3.2% more than avg
- Least expensive category: Housing — 97, or 3% less than avg
- Median household income, 2022: $82,174 (15th highest)
- Poverty rate, 2022: 9.4% (3rd lowest)
- Inflation rate, Feb 2024: 3.9% (for South Atlantic region)
20. Virginia

- Avg. cost of living in 2023: 101.9, or 1.9% more than avg
- Most expensive category: Housing — 105.7, or 5.7% more than avg
- Least expensive category: Transportation — 94.8, or 5.2% less than avg
- Median household income, 2022: $85,873 (13th highest)
- Poverty rate, 2022: 10.6% (13th lowest)
- Inflation rate, Feb 2024: 3.9% (for South Atlantic region)
19. Montana

- Avg. cost of living in 2023: 102.9, or 2.9% more than avg
- Most expensive category: Transportation — 109, or 9% more than avg
- Least expensive category: Utilities — 92.8, or 7.2% less than avg
- Median household income, 2022: $67,631 (16th lowest)
- Poverty rate, 2022: 12.1% (25th highest)
- Inflation rate, Feb 2024: 2.5% (for Mountain region)
18. Utah
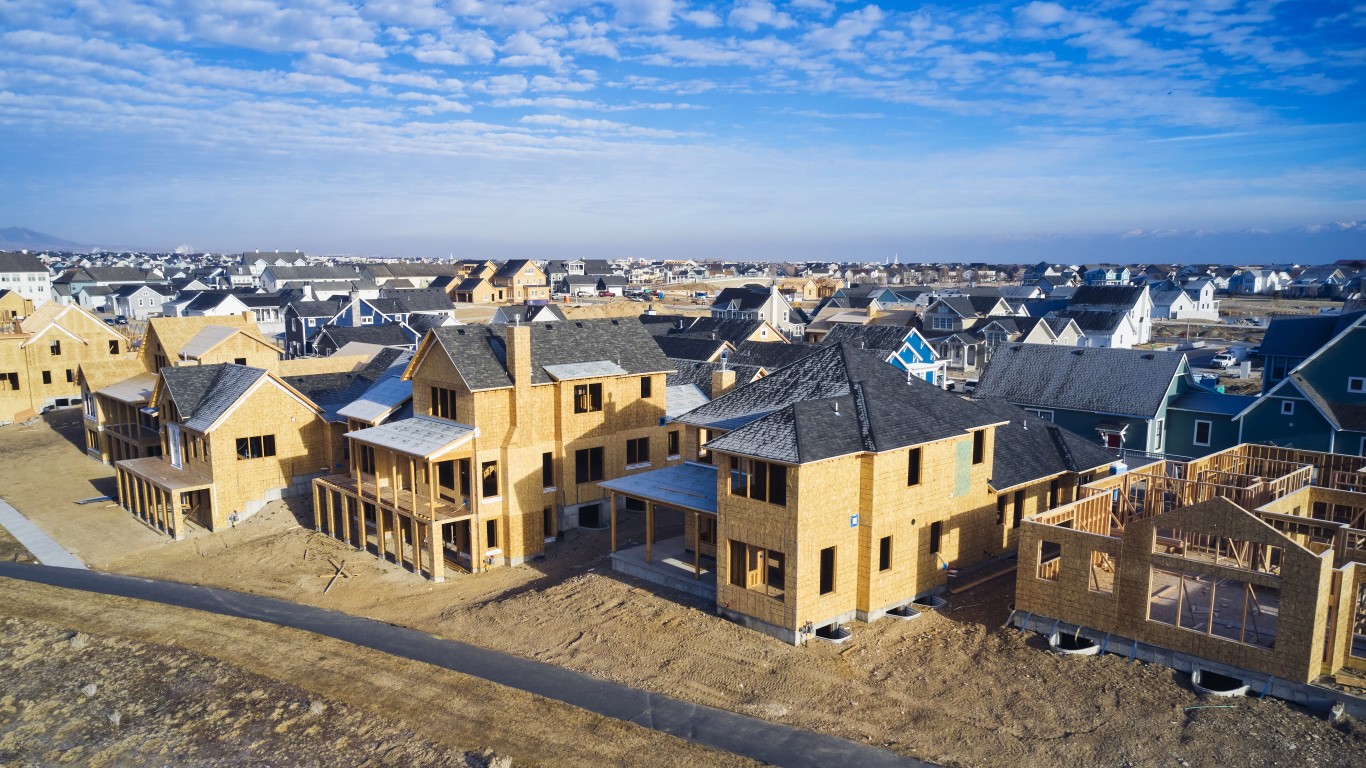
- Avg. cost of living in 2023: 103.2, or 3.2% more than avg
- Most expensive category: Housing — 110.7, or 10.7% more than avg
- Least expensive category: Health — 91, or 9% less than avg
- Median household income, 2022: $89,168 (10th highest)
- Poverty rate, 2022: 8.2% (2nd lowest)
- Inflation rate, Feb 2024: 2.5% (for Mountain region)
17. Colorado

- Avg. cost of living in 2023: 105.1, or 5.1% more than avg
- Most expensive category: Housing — 113.6, or 13.6% more than avg
- Least expensive category: Utilities — 91.3, or 8.7% less than avg
- Median household income, 2022: $89,302 (9th highest)
- Poverty rate, 2022: 9.4% (4th lowest)
- Inflation rate, Feb 2024: 2.5% (for Mountain region)
16. Arizona

- Avg. cost of living in 2023: 108.4, or 8.4% more than avg
- Most expensive category: Housing — 124.1, or 24.1% more than avg
- Least expensive category: Health — 93.8, or 6.2% less than avg
- Median household income, 2022: $74,568 (20th highest)
- Poverty rate, 2022: 12.5% (22nd highest)
- Inflation rate, Feb 2024: 2.5% (for Mountain region)
15. Maine

- Avg. cost of living in 2023: 109.9, or 9.9% more than avg
- Most expensive category: Housing — 117.4, or 17.4% more than avg
- Least expensive category: Grocery — 101.8, or 1.8% more than avg
- Median household income, 2022: $69,543 (19th lowest)
- Poverty rate, 2022: 10.8% (16th lowest)
- Inflation rate, Feb 2024: 2.1% (for New England region)
14. Rhode Island

- Avg. cost of living in 2023: 110.7, or 10.7% more than avg
- Most expensive category: Housing — 116.8, or 16.8% more than avg
- Least expensive category: Transportation — 92.5, or 7.5% less than avg
- Median household income, 2022: $81,854 (16th highest)
- Poverty rate, 2022: 10.8% (17th lowest)
- Inflation rate, Feb 2024: 2.1% (for New England region)
13. Connecticut

- Avg. cost of living in 2023: 112.8, or 12.8% more than avg
- Most expensive category: Utilities — 130.4, or 30.4% more than avg
- Least expensive category: Transportation — 100.4, or 0.4% more than avg
- Median household income, 2022: $88,429 (11th highest)
- Poverty rate, 2022: 9.8% (8th lowest)
- Inflation rate, Feb 2024: 2.1% (for New England region)
12. New Jersey

- Avg. cost of living in 2023: 113.9, or 13.9% more than avg
- Most expensive category: Housing — 135.8, or 35.8% more than avg
- Least expensive category: Health — 99.3, or 0.7% less than avg
- Median household income, 2022: $96,346 (2nd highest)
- Poverty rate, 2022: 9.7% (7th lowest)
- Inflation rate, Feb 2024: 2.6% (for Middle Atlantic region)
11. New Hampshire

- Avg. cost of living in 2023: 114.1, or 14.1% more than avg
- Most expensive category: Utilities — 131, or 31% more than avg
- Least expensive category: Grocery — 102, or 2% more than avg
- Median household income, 2022: $89,992 (8th highest)
- Poverty rate, 2022: 7.2% (the lowest)
- Inflation rate, Feb 2024: 2.1% (for New England region)
10. Oregon

- Avg. cost of living in 2023: 114.7, or 14.7% more than avg
- Most expensive category: Housing — 136.3, or 36.3% more than avg
- Least expensive category: Utilities — 95.9, or 4.1% less than avg
- Median household income, 2022: $75,657 (19th highest)
- Poverty rate, 2022: 12.1% (26th highest)
- Inflation rate, Feb 2024: 3.5% (for Pacific region)
9. Vermont

- Avg. cost of living in 2023: 115.3, or 15.3% more than avg
- Most expensive category: Housing — 133.1, or 33.1% more than avg
- Least expensive category: Grocery — 104.8, or 4.8% more than avg
- Median household income, 2022: $73,991 (21st highest)
- Poverty rate, 2022: 10.4% (12th lowest)
- Inflation rate, Feb 2024: 2.1% (for New England region)
8. Washington

- Avg. cost of living in 2023: 116.0, or 16.0% more than avg
- Most expensive category: Housing — 128.7, or 28.7% more than avg
- Least expensive category: Utilities — 92.1, or 7.9% less than avg
- Median household income, 2022: $91,306 (7th highest)
- Poverty rate, 2022: 10.0% (9th lowest)
- Inflation rate, Feb 2024: 3.5% (for Pacific region)
7. Maryland

- Avg. cost of living in 2023: 116.5, or 16.5% more than avg
- Most expensive category: Housing — 146.4, or 46.4% more than avg
- Least expensive category: Health — 97.4, or 2.6% less than avg
- Median household income, 2022: $94,991 (3rd highest)
- Poverty rate, 2022: 9.6% (5th lowest)
- Inflation rate, Feb 2024: 3.9% (for South Atlantic region)
6. Alaska

- Avg. cost of living in 2023: 125.2, or 25.2% more than avg
- Most expensive category: Utilities — 157.9, or 57.9% more than avg
- Least expensive category: Transportation — 115.3, or 15.3% more than avg
- Median household income, 2022: $88,121 (12th highest)
- Poverty rate, 2022: 11.0% (19th lowest)
- Inflation rate, Feb 2024: 3.5% (for Pacific region)
5. New York

- Avg. cost of living in 2023: 125.9, or 25.9% more than avg
- Most expensive category: Housing — 176, or 76% more than avg
- Least expensive category: Utilities — 103.1, or 3.1% more than avg
- Median household income, 2022: $79,557 (17th highest)
- Poverty rate, 2022: 14.3% (9th highest)
- Inflation rate, Feb 2024: 2.6% (for Middle Atlantic region)
4. California

- Avg. cost of living in 2023: 138.5, or 38.5% more than avg
- Most expensive category: Housing — 198.8, or 98.8% more than avg
- Least expensive category: Health — 108.5, or 8.5% more than avg
- Median household income, 2022: $91,551 (6th highest)
- Poverty rate, 2022: 12.2% (24th highest)
- Inflation rate, Feb 2024: 3.5% (for Pacific region}
3. Massachusetts

- Avg. cost of living in 2023: 146.5, or 46.5% more than avg
- Most expensive category: Housing — 218.5, or 118.5% more than avg
- Least expensive category: Grocery — 105.3, or 5.3% more than avg
- Median household income, 2022: $94,488 (4th highest)
- Poverty rate, 2022: 10.4% (11th lowest)
- Inflation rate, Feb 2024: 2.1% (for New England region)
2. District of Columbia

- Avg. cost of living in 2023: 146.8, or 46.8% more than avg
- Most expensive category: Housing — 237.7, or 137.7% more than avg
- Least expensive category: Grocery — 105.4, or 5.4% more than avg
- Median household income, 2022: $101,027 (the highest)
- Poverty rate, 2022: 13.3% (14th highest)
- Inflation rate, Feb 2024: 3.9% (for South Atlantic region)
1. Hawaii

- Avg. cost of living in 2023: 180.3, or 80.3% more than avg
- Most expensive category: Housing — 313.1, or 213.1% more than avg
- Least expensive category: Grocery — 116.7, or 16.7% more than avg
- Median household income, 2022: $92,458 (5th highest)
- Poverty rate, 2022: 10.2% (10th lowest)
- Inflation rate, Feb 2024: 3.5% (for Pacific region)
Thank you for reading! Have some feedback for us?
Contact the 24/7 Wall St. editorial team.


