
24/7 Wall St. Insights
- Lifetime earnings and job security tend to increase with education levels
- In many parts of the country, fewer than half of all adults have completed high school
- Also: Discover the next Nvidia
It is no secret that education has long been a key driver of financial stability and prosperity in the United States. According to the Bureau of Labor Statistics, the typical full-time worker with a bachelor’s degree earns about $77,600 a year. Meanwhile, the typical worker with no more than a high school diploma earns about $46,700 a year, or $9,900 more than the median annual earnings among those who did not complete high school.
Americans with greater levels of educational attainment are also better insulated from economic downturns. During the Great Recession, unemployment among workers with a bachelor’s degree or higher never exceeded 5%. Over the same period, the unemployment rate for workers with only a high school diploma peaked at 10%, while the jobless rate for those who did not complete high school surged to 15.6%. (Here is a look at the jobs going away due to automation.)
The latest estimates from the U.S. Census Bureau’s American Community Survey show that 89.1% of American adults 25 and older have at least a high school diploma, and 34.3% have a bachelor’s degree or higher. Still, despite the clear advantages education offers American workers, there are many parts of the country where the majority of adults have not completed high school, and even fewer have earned a college degree.
Using five-year estimates from the 2022 ACS, 24/7 Wall St. identified the least educated ZIP codes in the United States. Rankings were calculated with an equally weighted index consisting of the share of adults with at least a high school diploma and the share with a bachelor’s degree or higher. All supplemental data are five-year estimates from the 2022 ACS. Only ZIP codes home to at least 1,000 people aged 25 and older were considered.
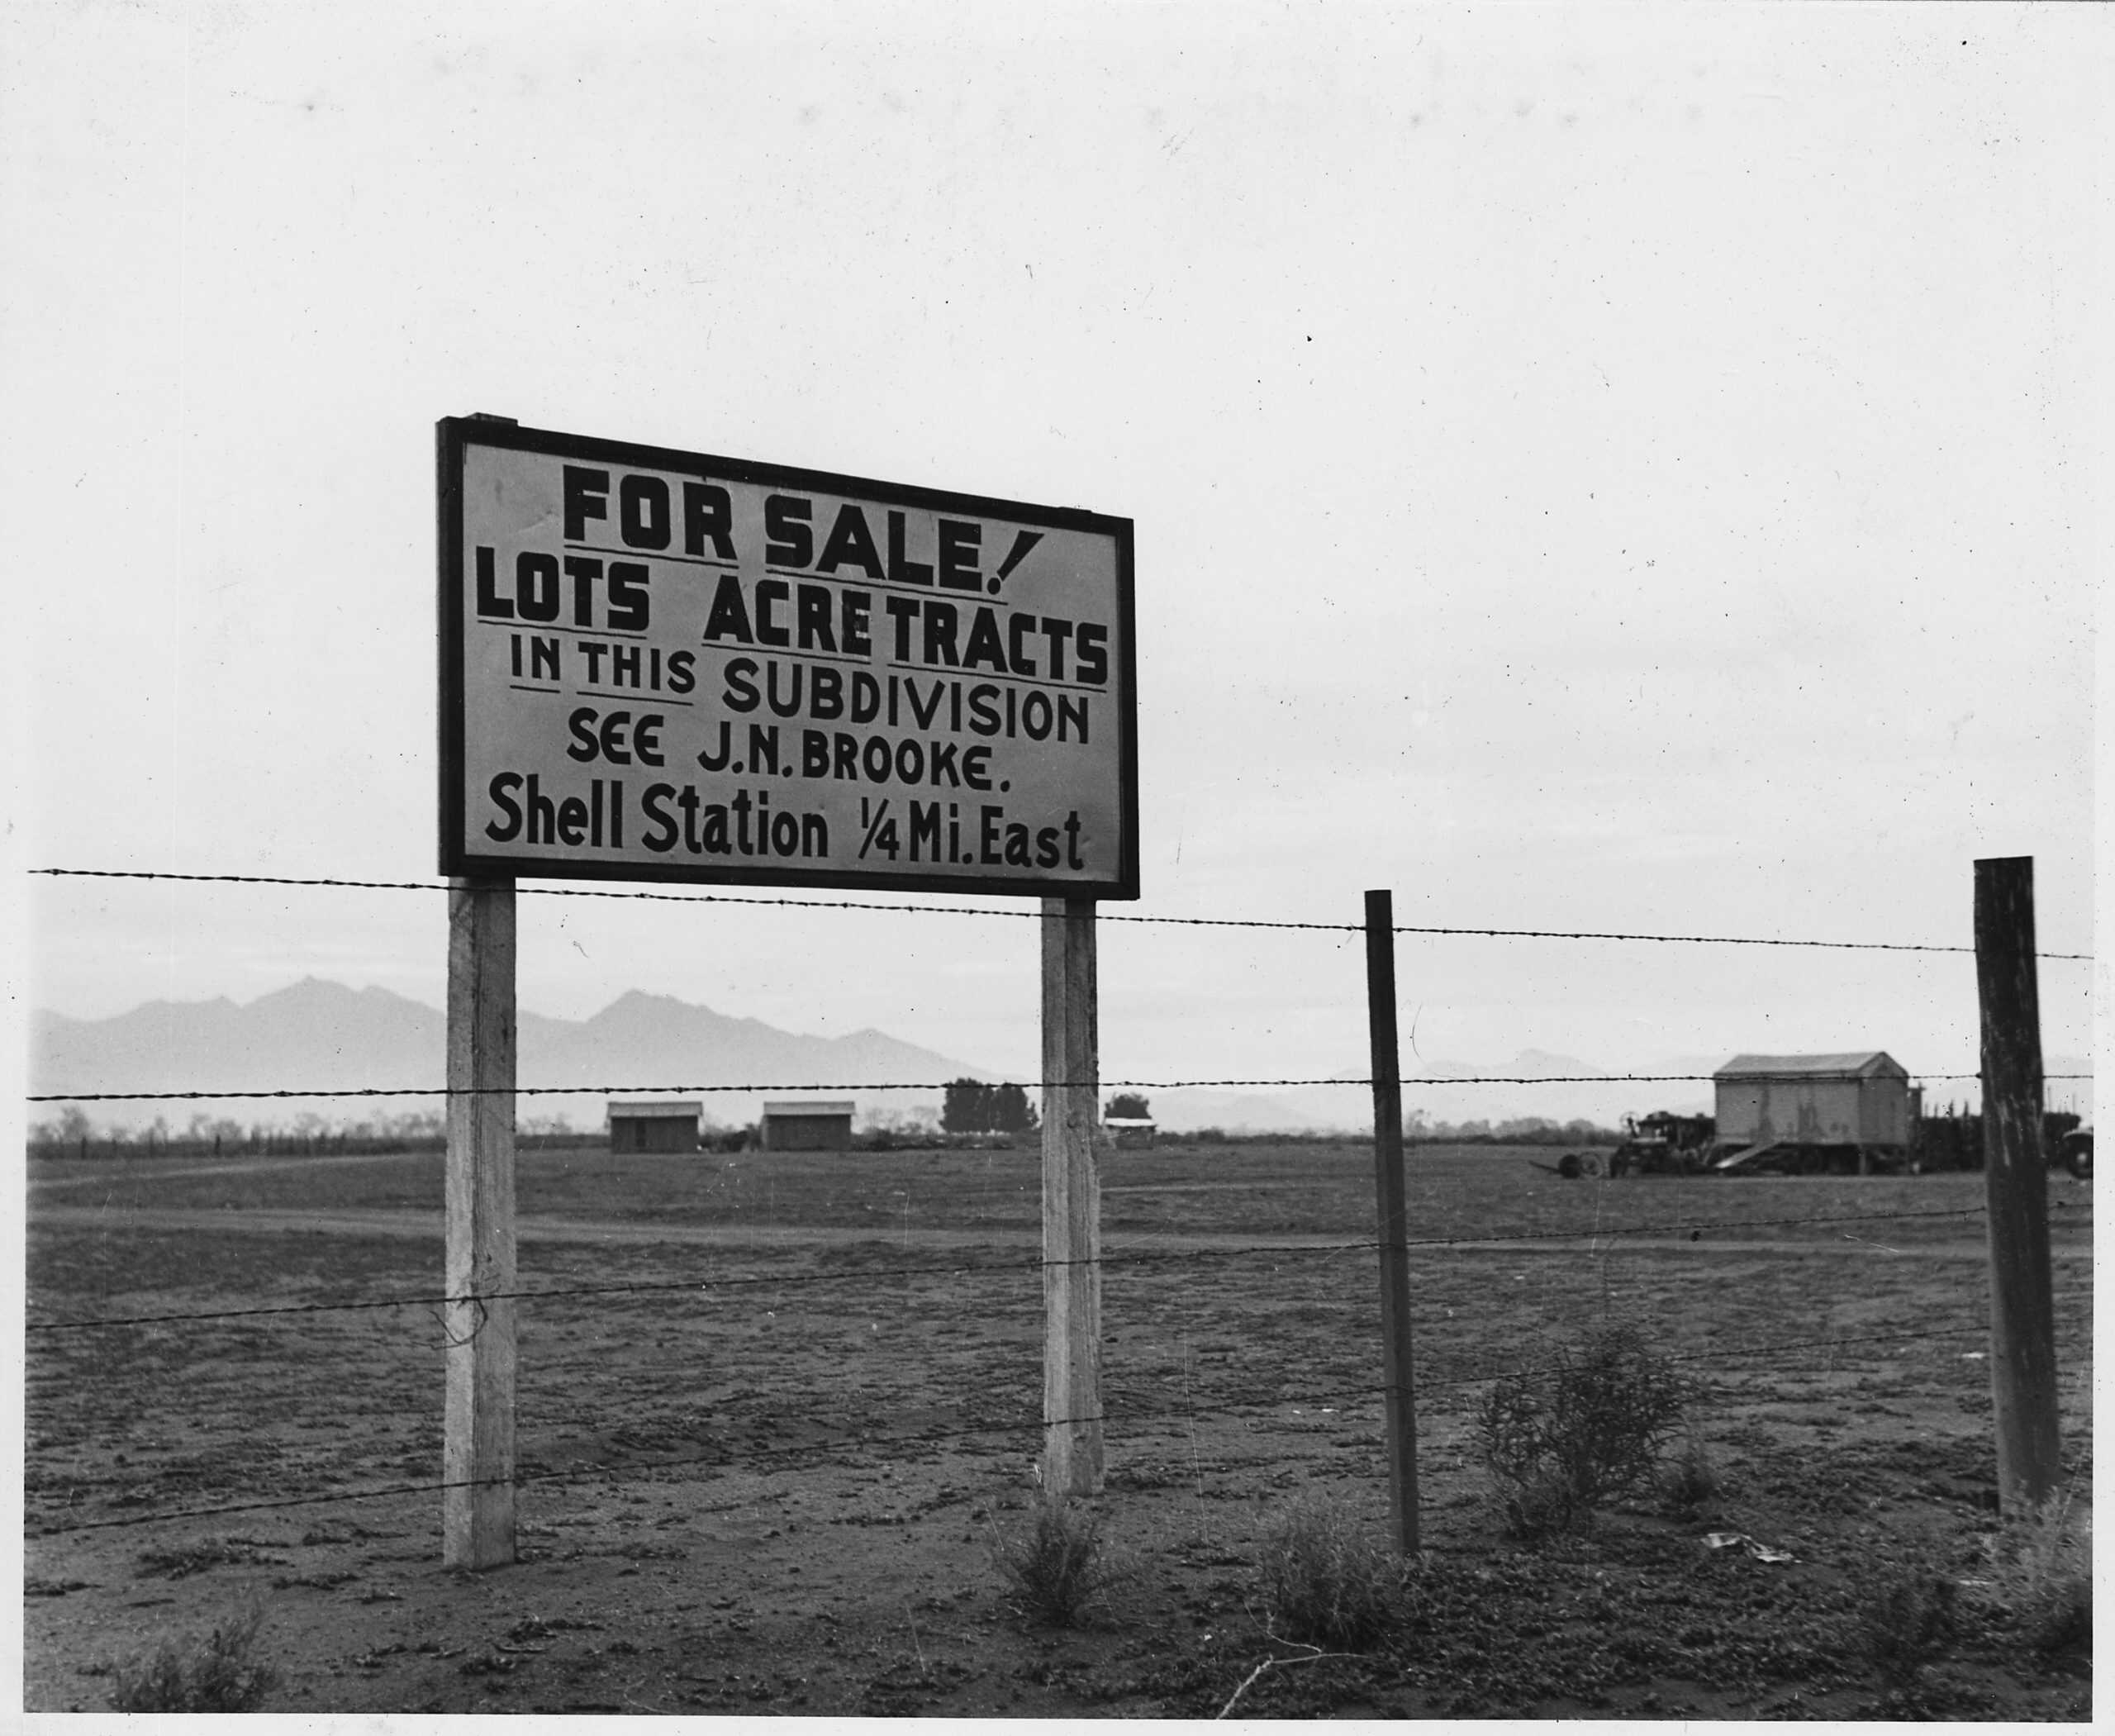
Among the 30 ZIP codes on this list, the share of adults with a high school diploma ranges from 52.4% to just 26.6%. In these same places, bachelor’s degree attainment rates are anywhere from 10.6% to 0%. These ZIP codes are spread across eight states, including California and Texas, which are home to 17 and five ZIP codes on this list, respectively.
Given the direct relationship between educational attainment and income, it is little surprise that many of the ZIP codes on this list are home to low-earning populations. In all but three places on this list with available data, the typical household earns less than the national median household income of $75,149. Similarly, in 21 of the 30 least educated ZIP codes, the five-year average jobless rate exceeds the comparable 5.3% national unemployment rate, and in just over half of these places, the unemployment rate is higher than 10%. (Here is a look at the poorest towns in the United States.)
Why It Matters

In the United States, earning potential and job security tend to rise with educational attainment. While the cost of a college education has increased substantially in recent decades, the benefits that a bachelor’s degree can confer make it a worthwhile investment. Of course, most American adults today do not have a bachelor’s degree, and for many career paths, a college degree is by no means a necessary prerequisite — but with few exceptions, a high school diploma is. It is no coincidence that many parts of the U.S. with low educational attainment rates are also among the poorest places in the country.
30. ZIP Code: 85329 (Cashion, Arizona)
- Adults with a high school diploma or higher: 52.4% (36.7 ppt. less than nat’l rate)
- Adults with a bachelor’s degree or higher: 0.0% (34.3 ppt. less than nat’l rate)
- 5-yr. avg. unemployment rate: 10.7% (5.4 ppt. more than nat’l rate)
- Poverty rate: 26.9% (14.4 ppt. higher than nat’l rate)
- Median household income: $41,712 ($33,437 less than nat’l median)
- 25 and older population: 1,690
29. ZIP Code: 93615 (Cutler, California)

- Adults with a high school diploma or higher: 47.0% (42.1 ppt. less than nat’l rate)
- Adults with a bachelor’s degree or higher: 6.6% (27.7 ppt. less than nat’l rate)
- 5-yr. avg. unemployment rate: 13.0% (7.7 ppt. more than nat’l rate)
- Poverty rate: 22.4% (9.9 ppt. higher than nat’l rate)
- Median household income: $57,191 ($17,958 less than nat’l median)
- 25 and older population: 3,176
28. ZIP Code: 79845 (Presidio, Texas)
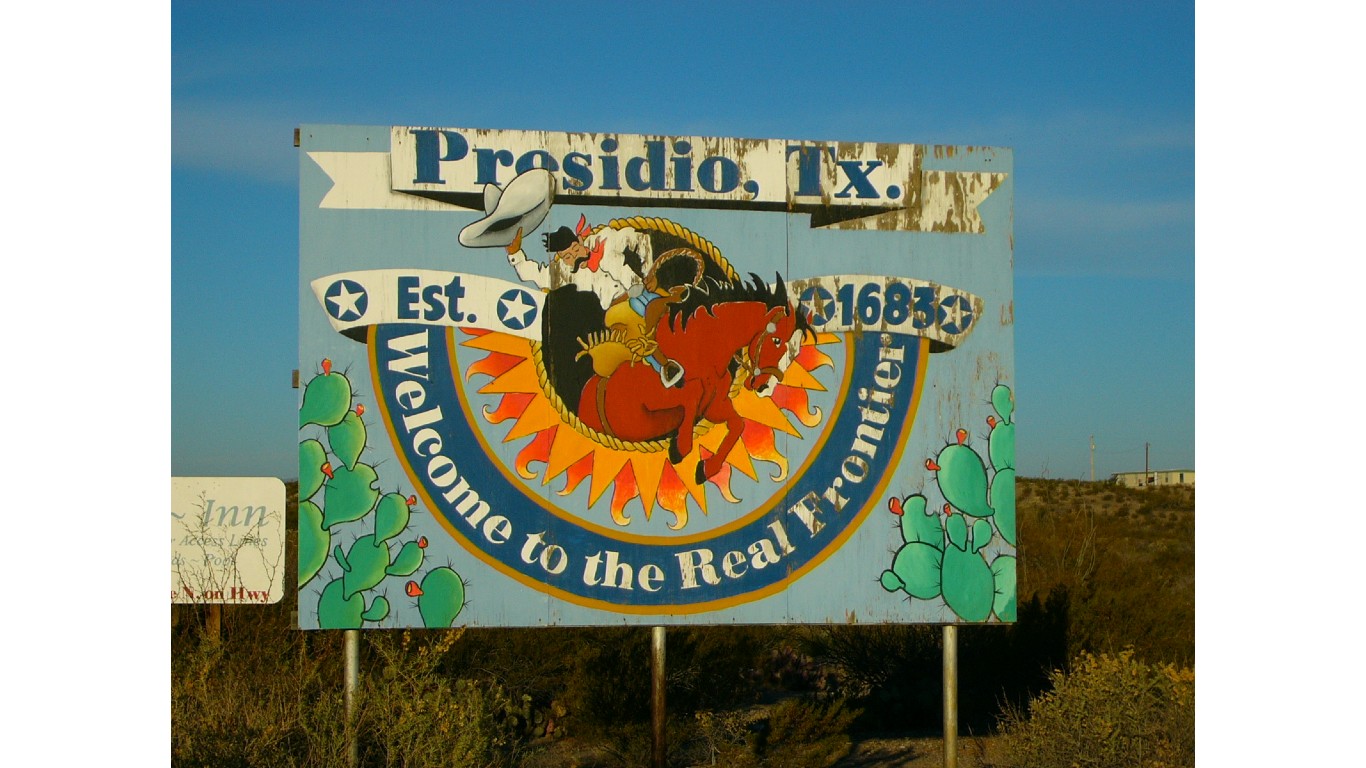
- Adults with a high school diploma or higher: 43.9% (45.2 ppt. less than nat’l rate)
- Adults with a bachelor’s degree or higher: 10.6% (23.7 ppt. less than nat’l rate)
- 5-yr. avg. unemployment rate: 30.0% (24.7 ppt. more than nat’l rate)
- Poverty rate: 50.2% (37.7 ppt. higher than nat’l rate)
- Median household income: $19,650 ($55,499 less than nat’l median)
- 25 and older population: 1,654
27. ZIP Code: 77037 (Houston, Texas)

- Adults with a high school diploma or higher: 46.9% (42.2 ppt. less than nat’l rate)
- Adults with a bachelor’s degree or higher: 6.0% (28.3 ppt. less than nat’l rate)
- 5-yr. avg. unemployment rate: 3.2% (2.1 ppt. less than nat’l rate)
- Poverty rate: 32.6% (20.1 ppt. higher than nat’l rate)
- Median household income: $47,381 ($27,768 less than nat’l median)
- 25 and older population: 10,471
26. ZIP Code: 79901 (El Paso, Texas)

- Adults with a high school diploma or higher: 45.8% (43.3 ppt. less than nat’l rate)
- Adults with a bachelor’s degree or higher: 7.3% (27.0 ppt. less than nat’l rate)
- 5-yr. avg. unemployment rate: 14.3% (9.0 ppt. more than nat’l rate)
- Poverty rate: 58.3% (45.8 ppt. higher than nat’l rate)
- Median household income: $14,142 ($61,007 less than nat’l median)
- 25 and older population: 6,154
25. ZIP Code: 98813 (Bridgeport, Washington)

- Adults with a high school diploma or higher: 49.0% (40.1 ppt. less than nat’l rate)
- Adults with a bachelor’s degree or higher: 3.0% (31.3 ppt. less than nat’l rate)
- 5-yr. avg. unemployment rate: 3.8% (1.5 ppt. less than nat’l rate)
- Poverty rate: 24.3% (11.8 ppt. higher than nat’l rate)
- Median household income: $52,333 ($22,816 less than nat’l median)
- 25 and older population: 1,813
24. ZIP Code: 79851 (Sierra Blanca, Texas)

- Adults with a high school diploma or higher: 44.2% (44.9 ppt. less than nat’l rate)
- Adults with a bachelor’s degree or higher: 7.5% (26.8 ppt. less than nat’l rate)
- 5-yr. avg. unemployment rate: 7.7% (2.4 ppt. more than nat’l rate)
- Poverty rate: 17.4% (4.9 ppt. higher than nat’l rate)
- Median household income: $56,563 ($18,586 less than nat’l median)
- 25 and older population: 1,042
23. ZIP Code: 95365 (Planada, California)
- Adults with a high school diploma or higher: 45.6% (43.5 ppt. less than nat’l rate)
- Adults with a bachelor’s degree or higher: 5.6% (28.7 ppt. less than nat’l rate)
- 5-yr. avg. unemployment rate: 12.3% (7.0 ppt. more than nat’l rate)
- Poverty rate: 34.3% (21.8 ppt. higher than nat’l rate)
- Median household income: $41,394 ($33,755 less than nat’l median)
- 25 and older population: 2,409
22. ZIP Code: 46565 (Shipshewana, Indiana)
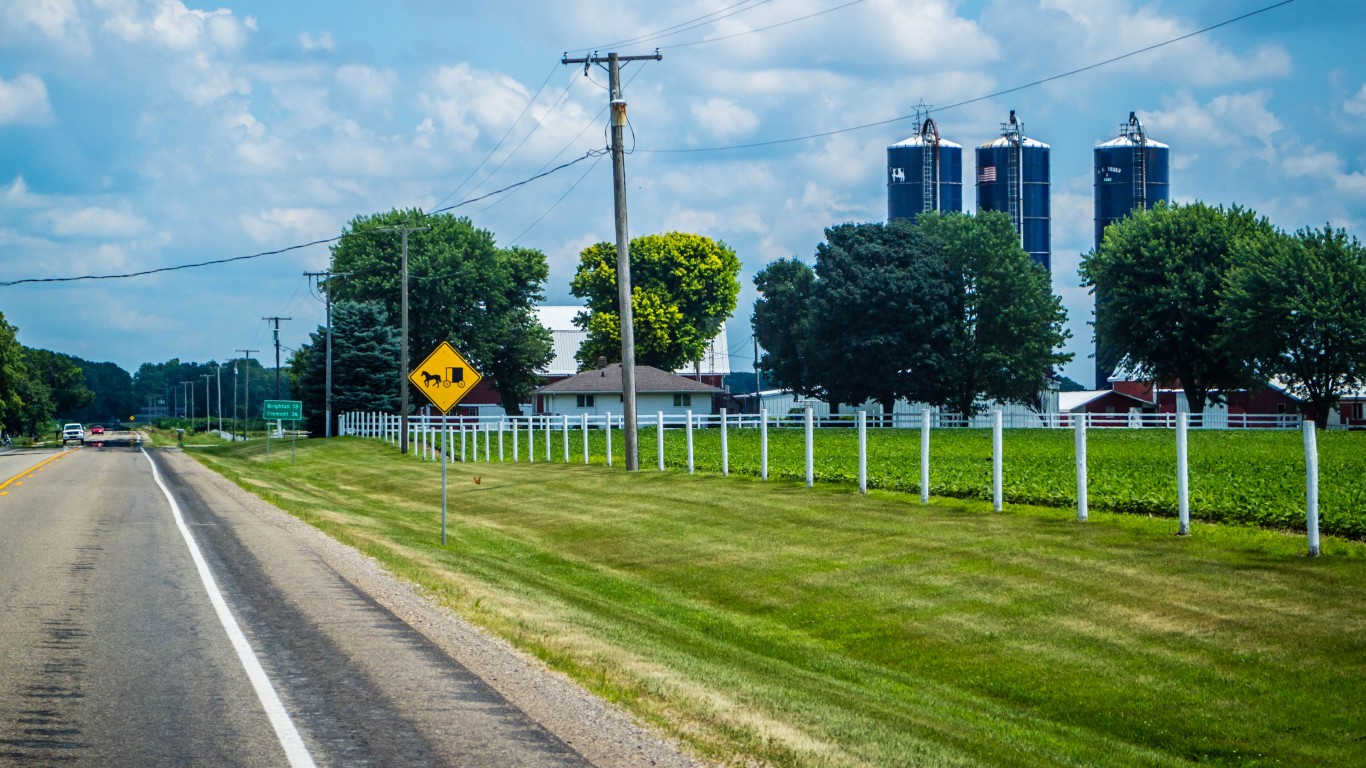
- Adults with a high school diploma or higher: 42.9% (46.2 ppt. less than nat’l rate)
- Adults with a bachelor’s degree or higher: 9.1% (25.2 ppt. less than nat’l rate)
- 5-yr. avg. unemployment rate: 1.2% (4.1 ppt. less than nat’l rate)
- Poverty rate: 7.6% (4.9 ppt. less than nat’l rate)
- Median household income: $91,250 ($16,101 more than nat’l median)
- 25 and older population: 4,712
21. ZIP Code: 43804 (Baltic, Ohio)
- Adults with a high school diploma or higher: 45.6% (43.5 ppt. less than nat’l rate)
- Adults with a bachelor’s degree or higher: 5.1% (29.2 ppt. less than nat’l rate)
- 5-yr. avg. unemployment rate: 0.8% (4.5 ppt. less than nat’l rate)
- Poverty rate: 6.7% (5.8 ppt. less than nat’l rate)
- Median household income: $68,300 ($6,849 less than nat’l median)
- 25 and older population: 2,123
20. ZIP Code: 93203 (Arvin, California)

- Adults with a high school diploma or higher: 46.1% (43.0 ppt. less than nat’l rate)
- Adults with a bachelor’s degree or higher: 4.0% (30.3 ppt. less than nat’l rate)
- 5-yr. avg. unemployment rate: 10.6% (5.3 ppt. more than nat’l rate)
- Poverty rate: 27.9% (15.4 ppt. higher than nat’l rate)
- Median household income: $47,991 ($27,158 less than nat’l median)
- 25 and older population: 10,430
19. ZIP Code: 90011 (Los Angeles, California)

- Adults with a high school diploma or higher: 43.7% (45.4 ppt. less than nat’l rate)
- Adults with a bachelor’s degree or higher: 6.9% (27.4 ppt. less than nat’l rate)
- 5-yr. avg. unemployment rate: 10.5% (5.2 ppt. more than nat’l rate)
- Poverty rate: 27.2% (14.7 ppt. higher than nat’l rate)
- Median household income: $51,819 ($23,330 less than nat’l median)
- 25 and older population: 62,769
18. ZIP Code: 93905 (Salinas, California)

- Adults with a high school diploma or higher: 44.0% (45.1 ppt. less than nat’l rate)
- Adults with a bachelor’s degree or higher: 5.9% (28.4 ppt. less than nat’l rate)
- 5-yr. avg. unemployment rate: 5.7% (0.4 ppt. more than nat’l rate)
- Poverty rate: 19.4% (6.9 ppt. higher than nat’l rate)
- Median household income: $68,795 ($6,354 less than nat’l median)
- 25 and older population: 34,537
17. ZIP Code: 93256 (Pixley, California)
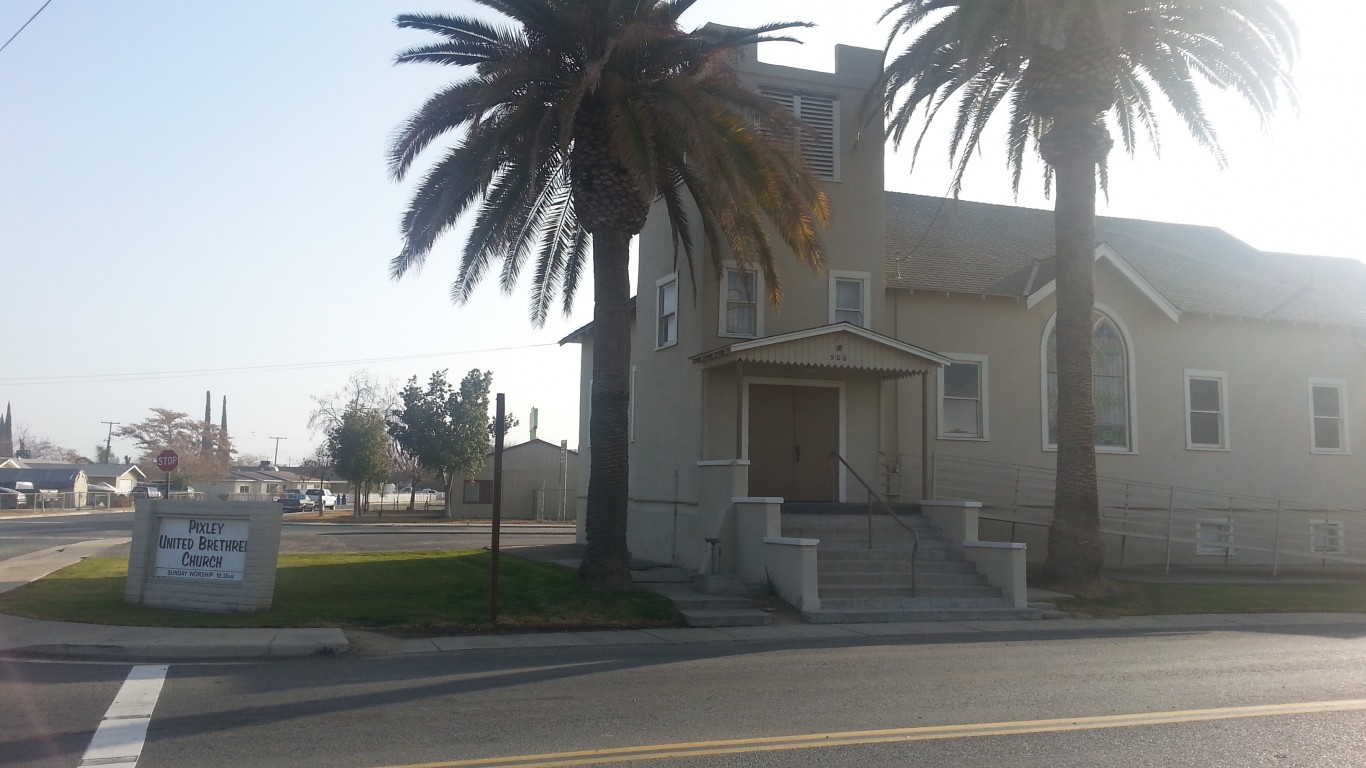
- Adults with a high school diploma or higher: 45.1% (44.0 ppt. less than nat’l rate)
- Adults with a bachelor’s degree or higher: 3.8% (30.5 ppt. less than nat’l rate)
- 5-yr. avg. unemployment rate: 13.4% (8.1 ppt. more than nat’l rate)
- Poverty rate: 18.3% (5.8 ppt. higher than nat’l rate)
- Median household income: $51,652 ($23,497 less than nat’l median)
- 25 and older population: 3,034
16. ZIP Code: 93219 (Earlimart, California)
- Adults with a high school diploma or higher: 45.1% (44.0 ppt. less than nat’l rate)
- Adults with a bachelor’s degree or higher: 3.3% (31.0 ppt. less than nat’l rate)
- 5-yr. avg. unemployment rate: 17.6% (12.3 ppt. more than nat’l rate)
- Poverty rate: 17.1% (4.6 ppt. higher than nat’l rate)
- Median household income: $46,707 ($28,442 less than nat’l median)
- 25 and older population: 5,122
15. ZIP Code: 93622 (Firebaugh, California)
- Adults with a high school diploma or higher: 44.2% (44.9 ppt. less than nat’l rate)
- Adults with a bachelor’s degree or higher: 4.3% (30.0 ppt. less than nat’l rate)
- 5-yr. avg. unemployment rate: 16.5% (11.2 ppt. more than nat’l rate)
- Poverty rate: 42.3% (29.8 ppt. higher than nat’l rate)
- Median household income: $36,788 ($38,361 less than nat’l median)
- 25 and older population: 5,271
14. ZIP Code: 92274 (Thermal, California)
- Adults with a high school diploma or higher: 44.2% (44.9 ppt. less than nat’l rate)
- Adults with a bachelor’s degree or higher: 3.8% (30.5 ppt. less than nat’l rate)
- 5-yr. avg. unemployment rate: 15.0% (9.7 ppt. more than nat’l rate)
- Poverty rate: 21.9% (9.4 ppt. higher than nat’l rate)
- Median household income: $30,489 ($44,660 less than nat’l median)
- 25 and older population: 11,301
13. ZIP Code: 93272 (Tipton, California)
- Adults with a high school diploma or higher: 41.4% (47.7 ppt. less than nat’l rate)
- Adults with a bachelor’s degree or higher: 7.1% (27.2 ppt. less than nat’l rate)
- 5-yr. avg. unemployment rate: 9.2% (3.9 ppt. more than nat’l rate)
- Poverty rate: 25.3% (12.8 ppt. higher than nat’l rate)
- Median household income: $49,961 ($25,188 less than nat’l median)
- 25 and older population: 2,343
12. ZIP Code: 93640 (Mendota, California)

- Adults with a high school diploma or higher: 40.9% (48.2 ppt. less than nat’l rate)
- Adults with a bachelor’s degree or higher: 4.2% (30.1 ppt. less than nat’l rate)
- 5-yr. avg. unemployment rate: 11.8% (6.5 ppt. more than nat’l rate)
- Poverty rate: 33.9% (21.4 ppt. higher than nat’l rate)
- Median household income: $40,692 ($34,457 less than nat’l median)
- 25 and older population: 7,537
11. ZIP Code: 93234 (Huron, California)

- Adults with a high school diploma or higher: 37.5% (51.6 ppt. less than nat’l rate)
- Adults with a bachelor’s degree or higher: 3.6% (30.7 ppt. less than nat’l rate)
- 5-yr. avg. unemployment rate: 12.0% (6.7 ppt. more than nat’l rate)
- Poverty rate: 32.3% (19.8 ppt. higher than nat’l rate)
- Median household income: $43,879 ($31,270 less than nat’l median)
- 25 and older population: 3,538
10. ZIP Code: 93239 (Kettleman City, California)
- Adults with a high school diploma or higher: 38.8% (50.3 ppt. less than nat’l rate)
- Adults with a bachelor’s degree or higher: 1.8% (32.5 ppt. less than nat’l rate)
- 5-yr. avg. unemployment rate: 6.0% (0.7 ppt. more than nat’l rate)
- Poverty rate: 20.5% (8.0 ppt. higher than nat’l rate)
- Median household income: $46,219 ($28,930 less than nat’l median)
- 25 and older population: 1,045
9. ZIP Code: 93261 (Richgrove, California)
- Adults with a high school diploma or higher: 39.5% (49.6 ppt. less than nat’l rate)
- Adults with a bachelor’s degree or higher: 0.0% (34.3 ppt. less than nat’l rate)
- 5-yr. avg. unemployment rate: 21.1% (15.8 ppt. more than nat’l rate)
- Poverty rate: 40.7% (28.2 ppt. higher than nat’l rate)
- Median household income: $26,635 ($48,514 less than nat’l median)
- 25 and older population: 1,094
8. ZIP Code: 93241 (Lamont, California)
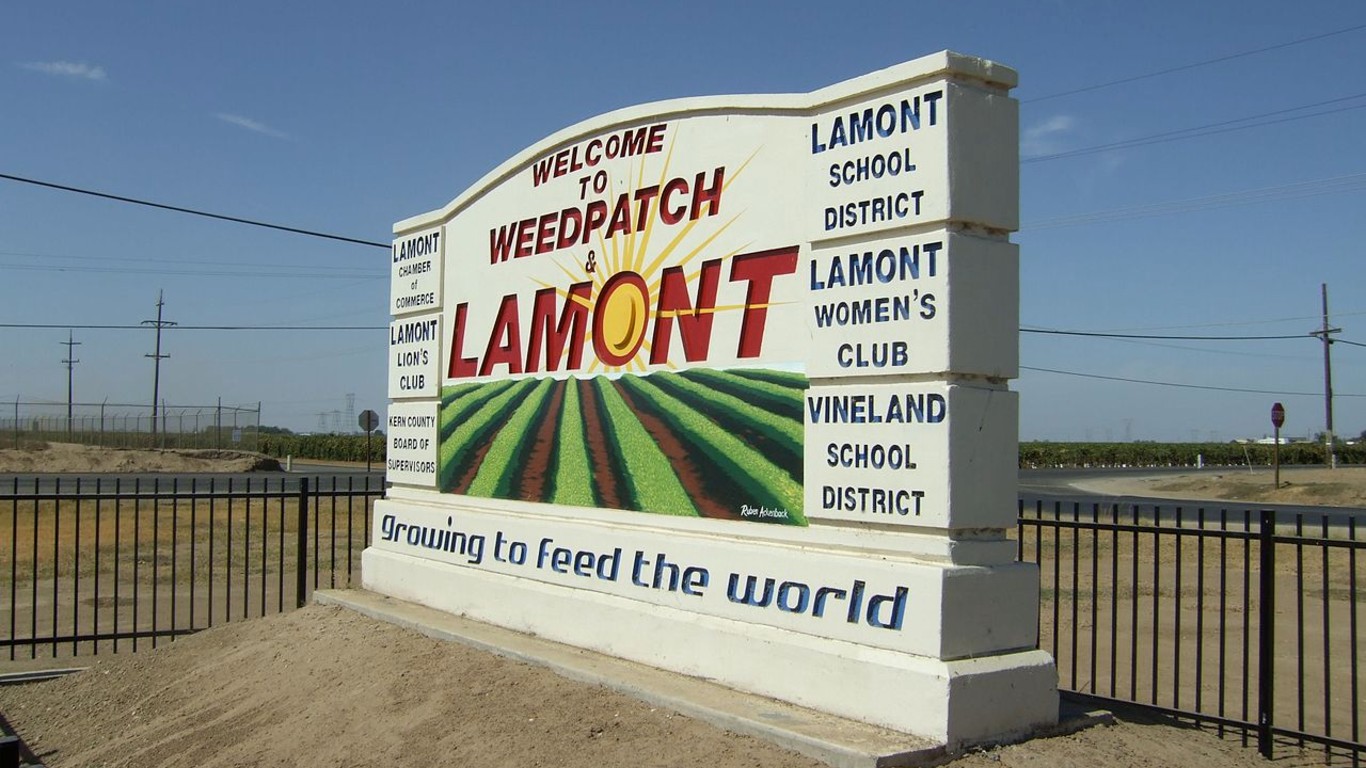
- Adults with a high school diploma or higher: 37.0% (52.1 ppt. less than nat’l rate)
- Adults with a bachelor’s degree or higher: 2.3% (32.0 ppt. less than nat’l rate)
- 5-yr. avg. unemployment rate: 11.8% (6.5 ppt. more than nat’l rate)
- Poverty rate: 36.0% (23.5 ppt. higher than nat’l rate)
- Median household income: $33,121 ($42,028 less than nat’l median)
- 25 and older population: 8,638
7. ZIP Code: 93249 (Lost Hills, California)
- Adults with a high school diploma or higher: 35.3% (53.8 ppt. less than nat’l rate)
- Adults with a bachelor’s degree or higher: 2.2% (32.1 ppt. less than nat’l rate)
- 5-yr. avg. unemployment rate: 5.4% (0.1 ppt. more than nat’l rate)
- Poverty rate: 20.9% (8.4 ppt. higher than nat’l rate)
- Median household income: $41,534 ($33,615 less than nat’l median)
- 25 and older population: 1,001
6. ZIP Code: 44627 (Fredericksburg, Ohio)

- Adults with a high school diploma or higher: 32.5% (56.6 ppt. less than nat’l rate)
- Adults with a bachelor’s degree or higher: 5.0% (29.3 ppt. less than nat’l rate)
- 5-yr. avg. unemployment rate: 0.1% (5.2 ppt. less than nat’l rate)
- Poverty rate: 9.4% (3.1 ppt. less than nat’l rate)
- Median household income: $80,606 ($5,457 more than nat’l median)
- 25 and older population: 3,567
5. ZIP Code: 92254 (Mecca, California)

- Adults with a high school diploma or higher: 34.5% (54.6 ppt. less than nat’l rate)
- Adults with a bachelor’s degree or higher: 1.5% (32.8 ppt. less than nat’l rate)
- 5-yr. avg. unemployment rate: 10.4% (5.1 ppt. more than nat’l rate)
- Poverty rate: 17.4% (4.9 ppt. higher than nat’l rate)
- Median household income: $38,103 ($37,046 less than nat’l median)
- 25 and older population: 6,423
4. ZIP Code: 46571 (Topeka, Indiana)

- Adults with a high school diploma or higher: 32.0% (57.1 ppt. less than nat’l rate)
- Adults with a bachelor’s degree or higher: 3.9% (30.4 ppt. less than nat’l rate)
- 5-yr. avg. unemployment rate: 4.8% (0.5 ppt. less than nat’l rate)
- Poverty rate: 5.4% (7.1 ppt. less than nat’l rate)
- Median household income: $80,036 ($4,887 more than nat’l median)
- 25 and older population: 3,183
3. ZIP Code: 25140 (Naoma, West Virginia)
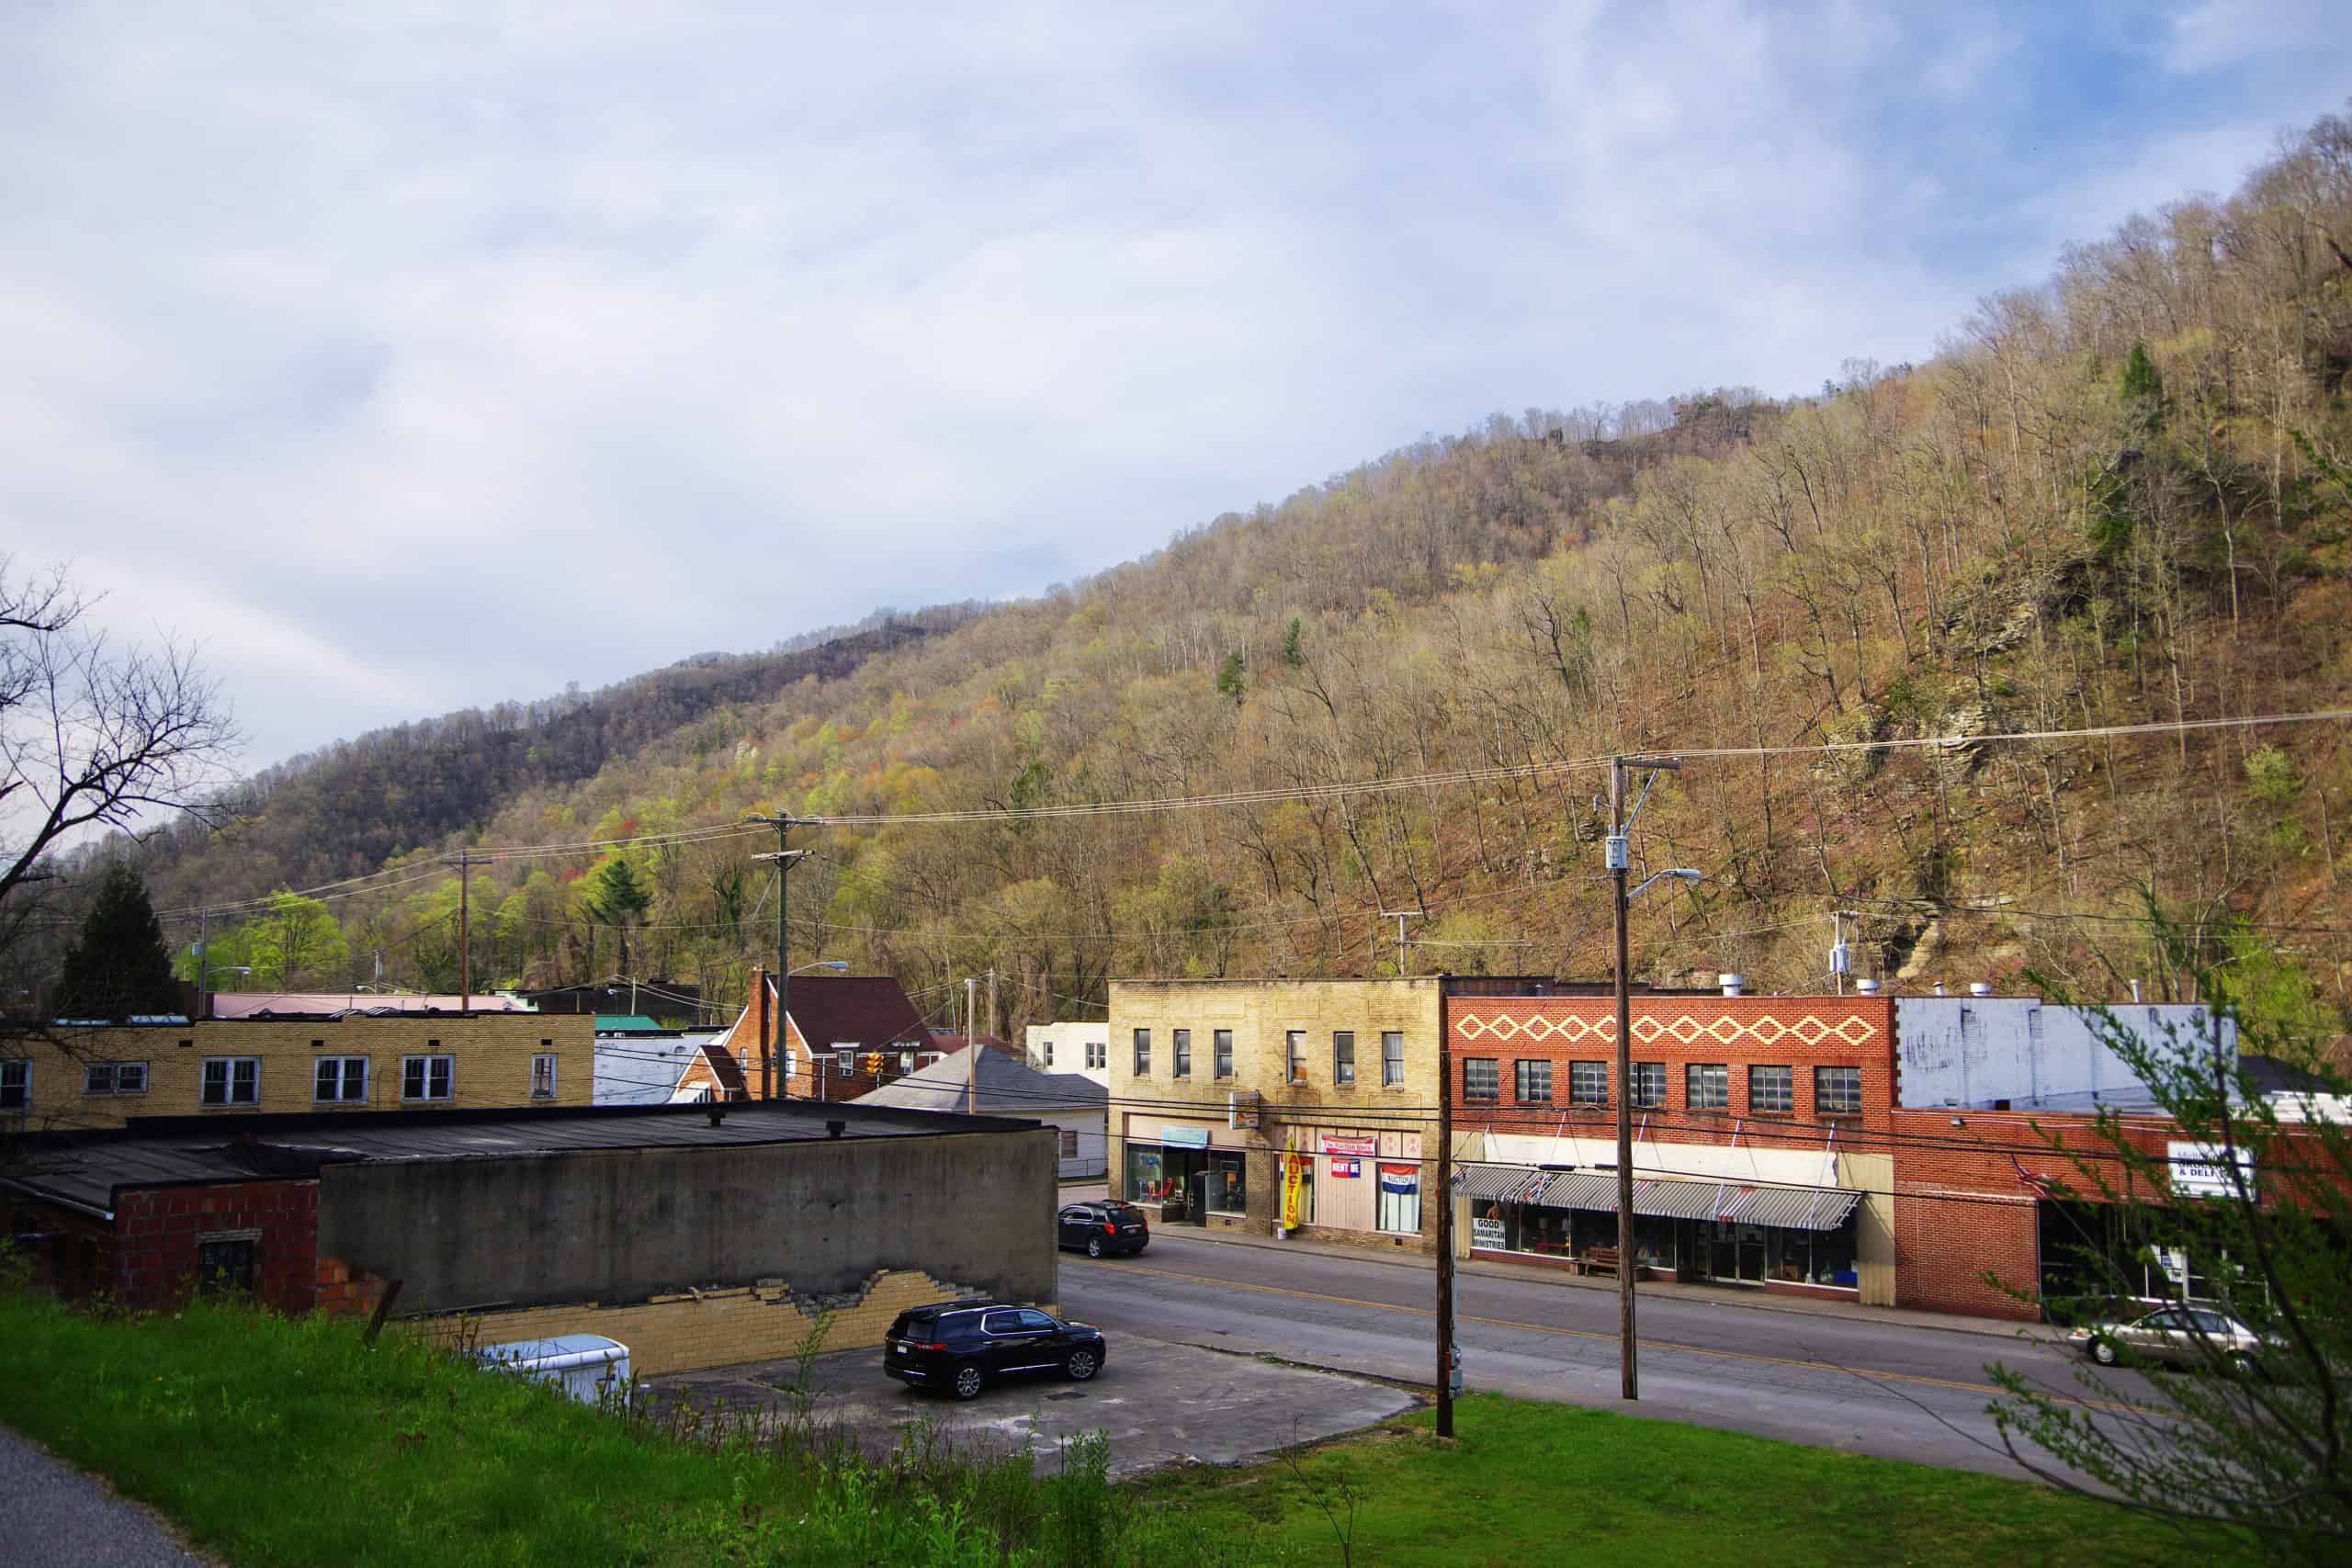
- Adults with a high school diploma or higher: 32.0% (57.1 ppt. less than nat’l rate)
- Adults with a bachelor’s degree or higher: 3.1% (31.2 ppt. less than nat’l rate)
- 5-yr. avg. unemployment rate: 0.0% (5.3 ppt. less than nat’l rate)
- Poverty rate: 52.8% (40.3 ppt. higher than nat’l rate)
- Median household income: $22,790 ($52,359 less than nat’l median)
- 25 and older population: 1,007
2. ZIP Code: 13024 (Auburn, New York)

- Adults with a high school diploma or higher: 32.8% (56.3 ppt. less than nat’l rate)
- Adults with a bachelor’s degree or higher: 0.5% (33.8 ppt. less than nat’l rate)
- 5-yr. avg. unemployment rate: N/A
- Poverty rate: N/A
- Median household income: N/A
- 25 and older population: 1,298
1. ZIP Code: 79013 (Cactus, Texas)

- Adults with a high school diploma or higher: 26.6% (62.5 ppt. less than nat’l rate)
- Adults with a bachelor’s degree or higher: 0.7% (33.6 ppt. less than nat’l rate)
- 5-yr. avg. unemployment rate: 2.8% (2.5 ppt. less than nat’l rate)
- Poverty rate: 12.6% (0.1 ppt. higher than nat’l rate)
- Median household income: $49,013 ($26,136 less than nat’l median)
- 25 and older population: 1,611
Are You Still Paying With a Debit Card?
The average American spends $17,274 on debit cards a year, and it’s a HUGE mistake. First, debit cards don’t have the same fraud protections as credit cards. Once your money is gone, it’s gone. But more importantly you can actually get something back from this spending every time you swipe.
Issuers are handing out wild bonuses right now. With some you can earn up to 5% back on every purchase. That’s like getting a 5% discount on everything you buy!
Our top pick is kind of hard to imagine. Not only does it pay up to 5% back, it also includes a $200 cash back reward in the first six months, a 0% intro APR, and…. $0 annual fee. It’s quite literally free money for any one that uses a card regularly. Click here to learn more!
Flywheel Publishing has partnered with CardRatings to provide coverage of credit card products. Flywheel Publishing and CardRatings may receive a commission from card issuers.
Thank you for reading! Have some feedback for us?
Contact the 24/7 Wall St. editorial team.

Our expert who first called NVIDIA in 2009 is predicting 2025 will see a historic AI breakthrough.
You can follow him investing $500,000 of his own money on our top AI stocks for free.