NYMEX Natural gas futures for April were down by almost 6% on Monday to $4.715. This sent the United States Natural Gas (NYSEArca: UNG) down almost 5.7% to $26.12 as well, but the volume behind this drop was strong that it feels like the hot money is exiting natural gas maybe even faster than it took the fast money crowd to decide that natural gas could finally go higher again.
The 46.5 million shares trading hands on Monday was on what feels like a selling inflection point. Average volume on the exchange-traded product is back up to about 14 million shares, but this was the strongest day in trading volume of this exchange-traded product in 2014 with the exception of one other down day.
As a comparison, some 44.1 million shares of this exchange-traded product traded on February 19, but that was an up day of only about 2.9%. The only other more active day was January 30 when the shares fell by almost 9.3% down to $24.25.
Monday’s move is even worse when you consider that the exchange-traded product hit a year high of $27.89. This means that the product tried to gap up marginally and it slid and slid, with heavy selling volume.
Traders have been talking up natural gas, and the options volume and price strength had been skewing heavily to the call options. If weather is going to break, perhaps all the reasons to remain extremely bullish will be a bit less bullish than you had previously expected.
Keep in mind that the move up had been more than 50% in just three months. That is reminiscent of the oil and gas spike of 2008. The difference there was there had not really been net energy supply misses. Even then that was when oil rose toward $150 as the fast money just kept buying for the same reason each day.
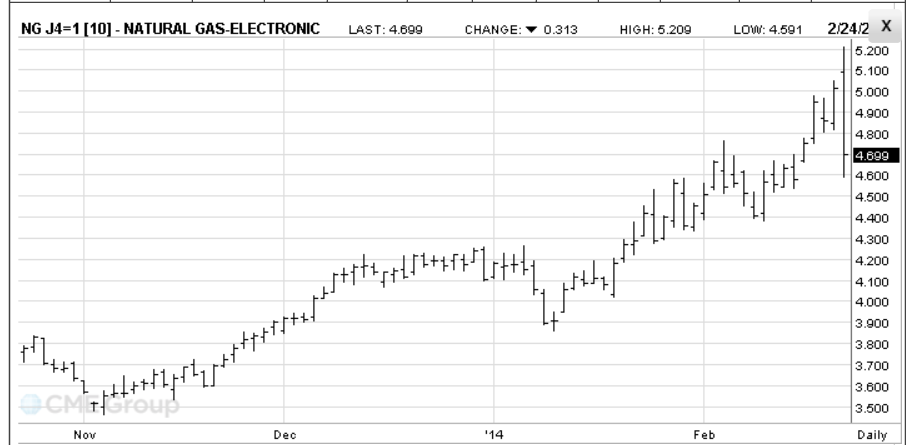
This time just feels different as well. There is no reason to believe that natural gas and the United States Natural Gas exchange-traded product cannot rally again. We have seen drops like his with the price to only turn around to go higher. That being said, a lot of fast money will not at all like the chart that they see on Monday. A lot of overhang was just created in the futures market at $4.80 to $5.00, and the drop from the high to the low before a slight recovery was actually about 11.5% in the April futures (see chart below).
The NYMEX chart pretty much says it all. Again, natural gas can still rise. This just felt like a capitulation day if you just look at charts and take the emotions out of it.