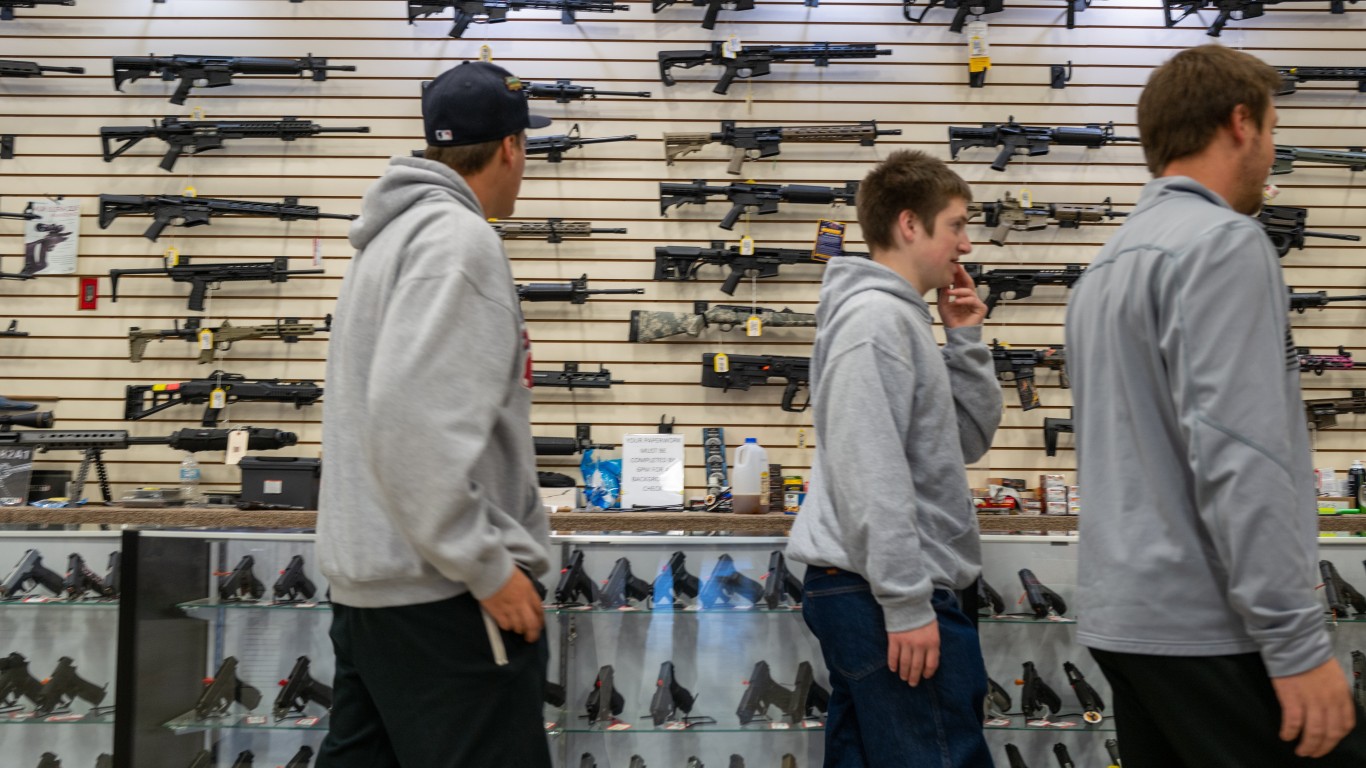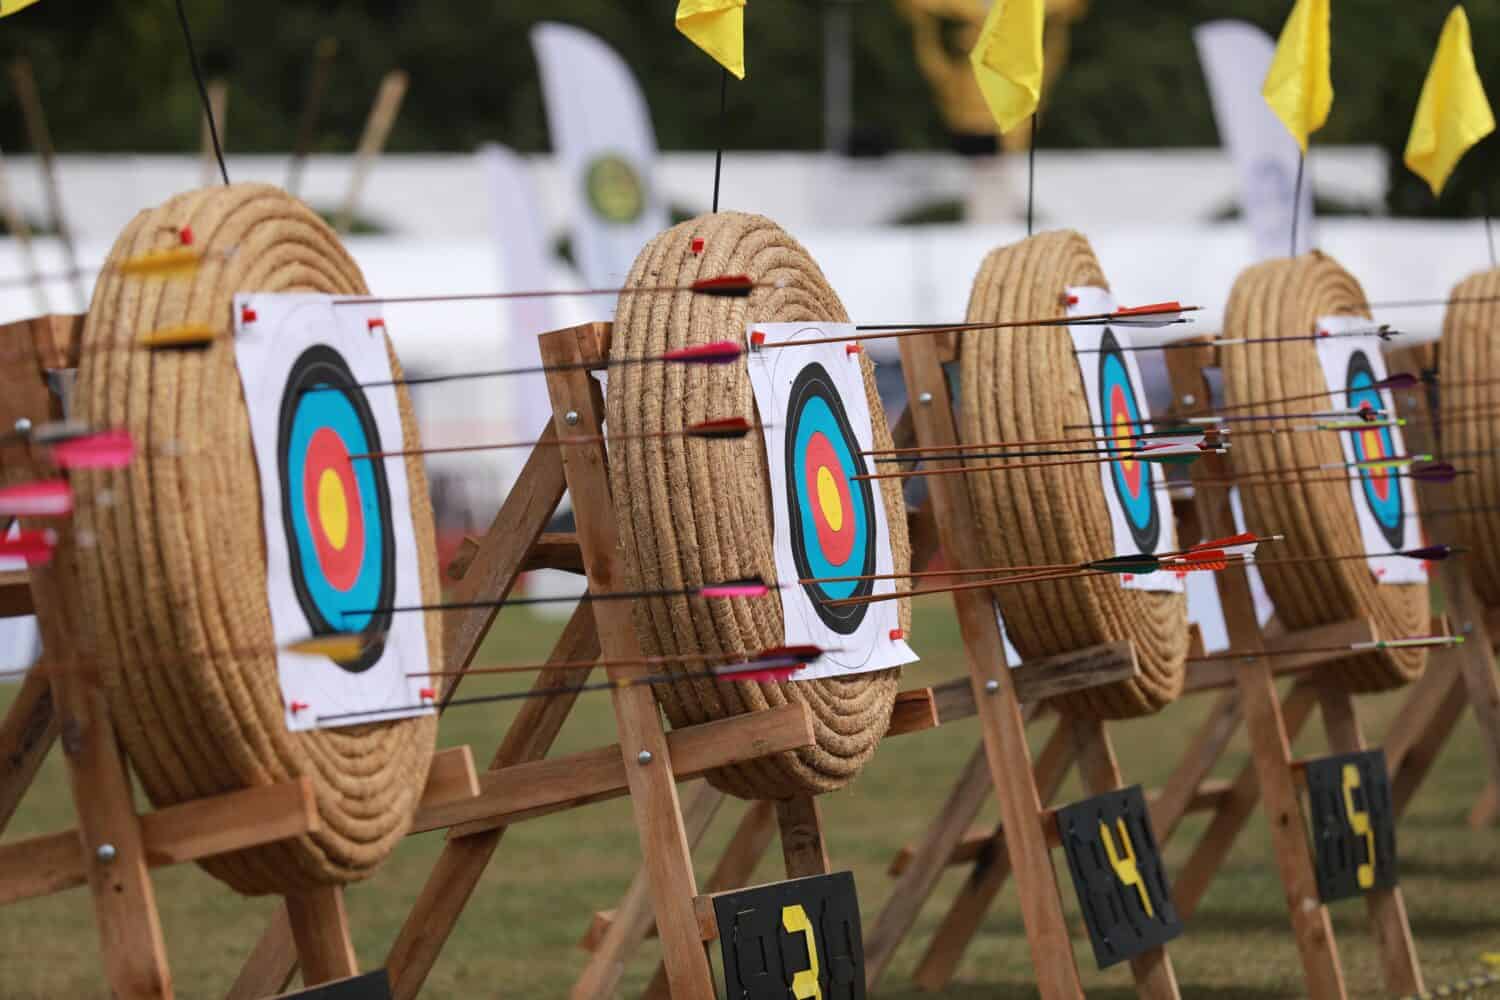
There were more than 15.9 million hunters in the United States in 2022, and the majority of them hunt with a firearm. Still, a meaningful subset of hunters in the U.S. use a bow. According to the National Deer Association, a wildlife and habitat preservation organization, 25% of the nearly 6.2 million deer harvested in 2022 were taken with a bow or crossbow.
Bowhunting is typically done with a compound bow, recurve bow, longbow, or, somewhat controversially, a crossbow. Complete with a gunstock and a trigger, crossbows function more like a firearm — giving weight to the derisive nickname, “gross-gun.” Compound bows, meanwhile, are modern bows that use a system of levers and pulleys and are capable of generating more power with a similarly weighted pull than a more traditional recurve bow or longbow.
Reasons why millions of Americans choose to hunt with a bow vary. For one, bow hunting is generally more challenging than hunting with a firearm. Unlike many hunting rifles, which can be effective at several hundred yards, bows generally have a maximum range of only about 40 yards. Bowhunters also benefit from a longer hunting season in much of the country. Additionally, many states have restrictions on the types of firearms that can be used for hunting, making bows a more practical option. (Here is a look at the 30 most powerful hunting rifles you can buy.)
Using data from the NDA, 24/7 Wall St. identified the states where the most people hunt with bows. States are ranked on the share of deer harvested with a bow or crossbow in 2022. Only the 43 states with available data were included. In the case of a tie, the state with more hunters per 1,000 people ranks higher. Supplemental data on deer harvest totals is also from the NDA, while the total number of paid hunting license holders per 1,000 people was calculated using data from the U.S. Fish and Wildlife Service and the U.S. Census Bureau’s 2022 American Community Survey.
Depending on the state, the share of deer harvested with a bow in 2022 ranges from 6% to 65%. The highest ranking states on this list tend to be small and densely populated. Several of these states, including Massachusetts and New Jersey, prohibit deer hunting with a rifle. In other states where a high-percentage of deer are harvested with a bow, including Illinois and Ohio, only specific rifles are approved for hunting — such as single-shot rifles or those that fire straight-wall ammunition.
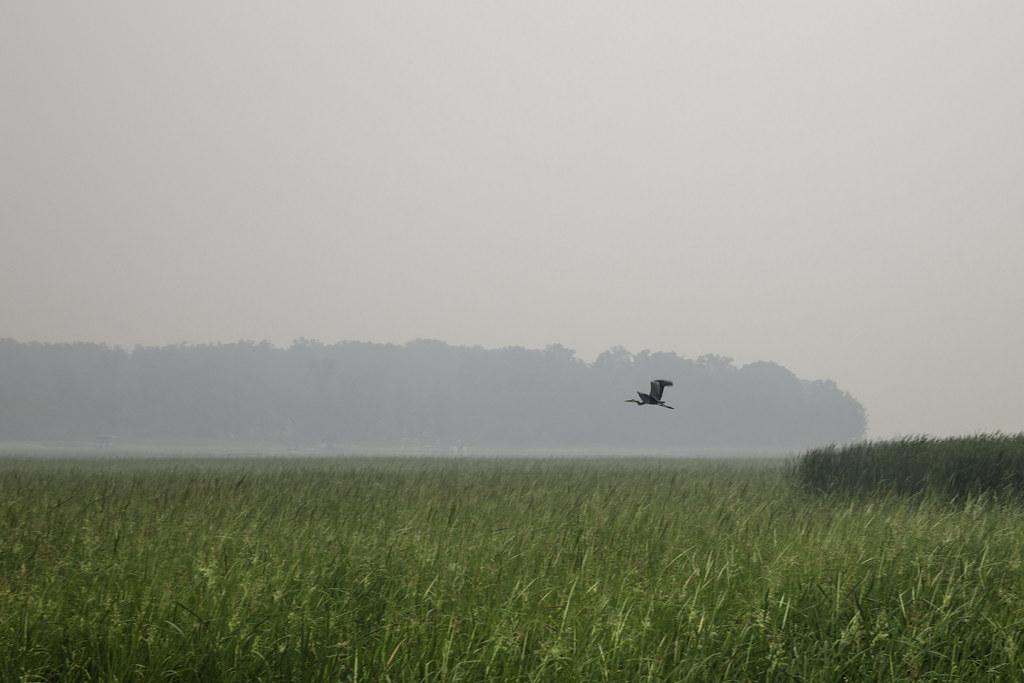
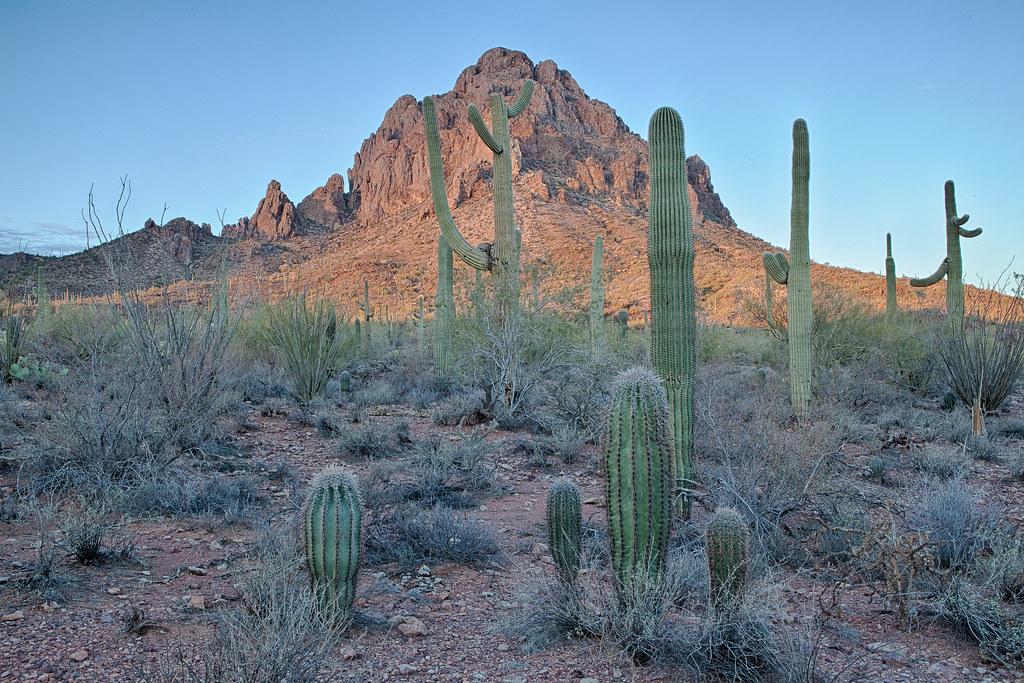
Conversely, the lowest ranking states on this list are typically not densely populated places. These states, concentrated in the West, often have large swathes of public land where long-range shots are more common. (Here is a look at the most versatile hunting rifle cartridges.)
Why It Matters
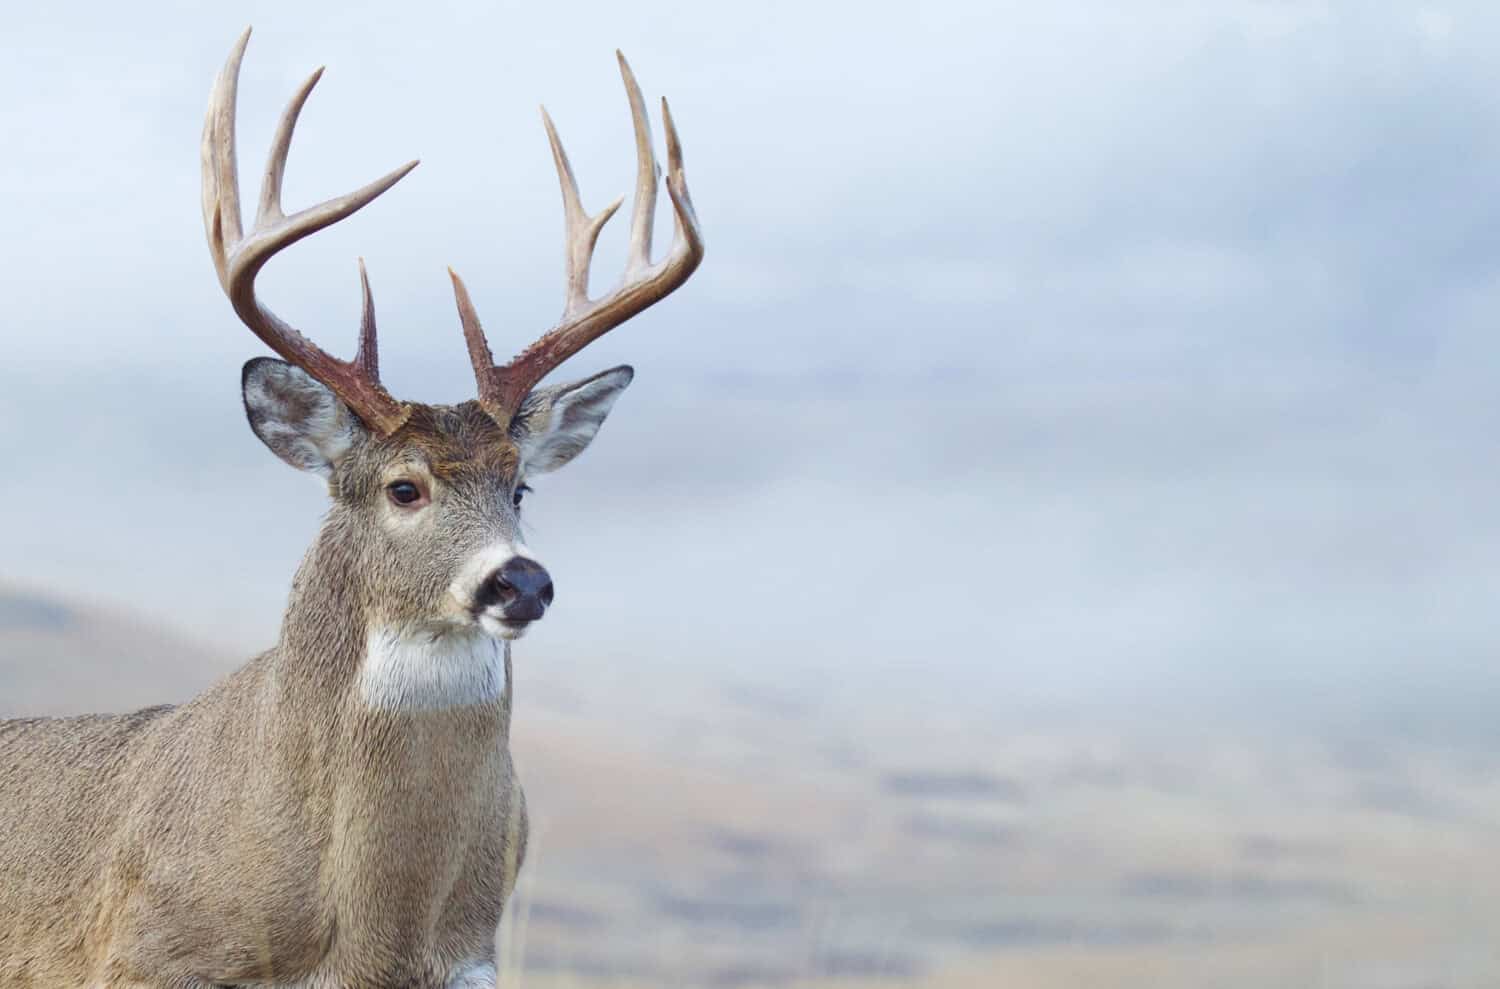
Hunting is an increasingly popular pastime in the United States. According to the FWS, the number of licensed hunters hit a 35-year high in 2021, topping 15.9 million for the first time since 1987. Hunting is also big business in the United States. Americans spent a combined $1.1 billion on hunting licenses, stamps, tags, and permits in 2022 alone. Deer are by far the most commonly hunted game in the U.S., and while most deer are harvested with a rifle or a shotgun, more than 1.5 million deer were taken with a bow in 2022.
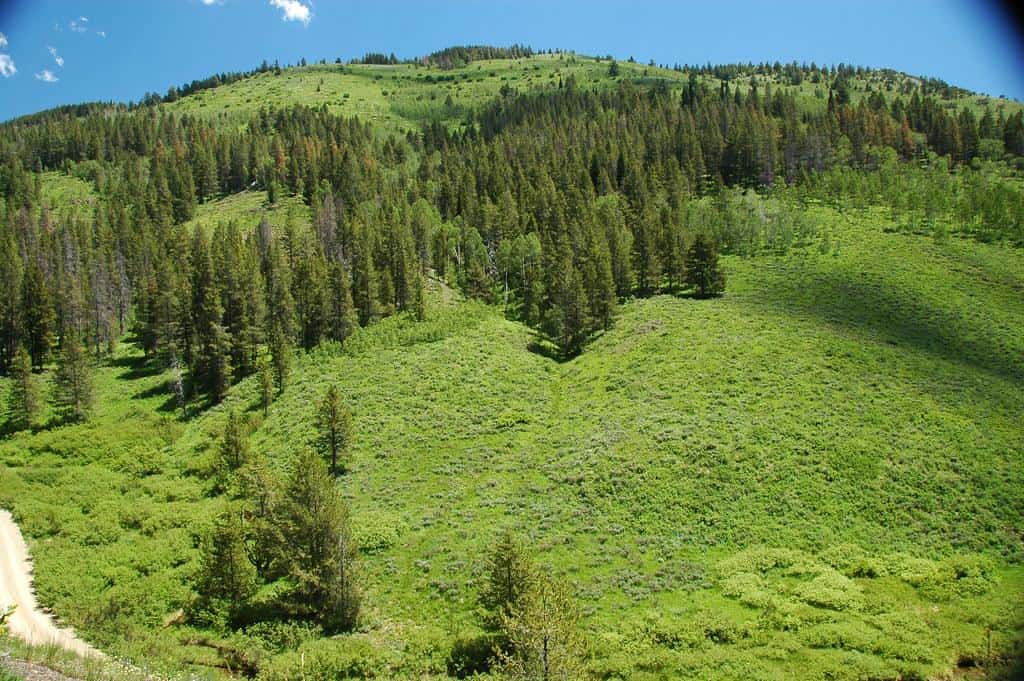
43. Idaho
- Share of deer harvested with a bow or crossbow, 2022: 6% (approx. 2,566 deer)
- Total deer harvested, 2022: 42,770 (76.0% antlered buck, 24.0% antlerless deer)
- Paid hunting license holders, 2022: 150.0 per 1,000 people (290,834 total)
42. Montana

- Share of deer harvested with a bow or crossbow, 2022: 6% (approx. 2,722 deer)
- Total deer harvested, 2022: 45,369 (58.8% antlered buck, 41.2% antlerless deer)
- Paid hunting license holders, 2022: 211.3 per 1,000 people (237,312 total)
41. Wyoming

- Share of deer harvested with a bow or crossbow, 2022: 6% (approx. 1,759 deer)
- Total deer harvested, 2022: 29,315 (74.4% antlered buck, 25.6% antlerless deer)
- Paid hunting license holders, 2022: 227.4 per 1,000 people (132,185 total)
40. South Carolina

- Share of deer harvested with a bow or crossbow, 2022: 8% (approx. 14,353 deer)
- Total deer harvested, 2022: 179,414 (50.2% antlered buck, 49.8% antlerless deer)
- Paid hunting license holders, 2022: 40.8 per 1,000 people (215,340 total)
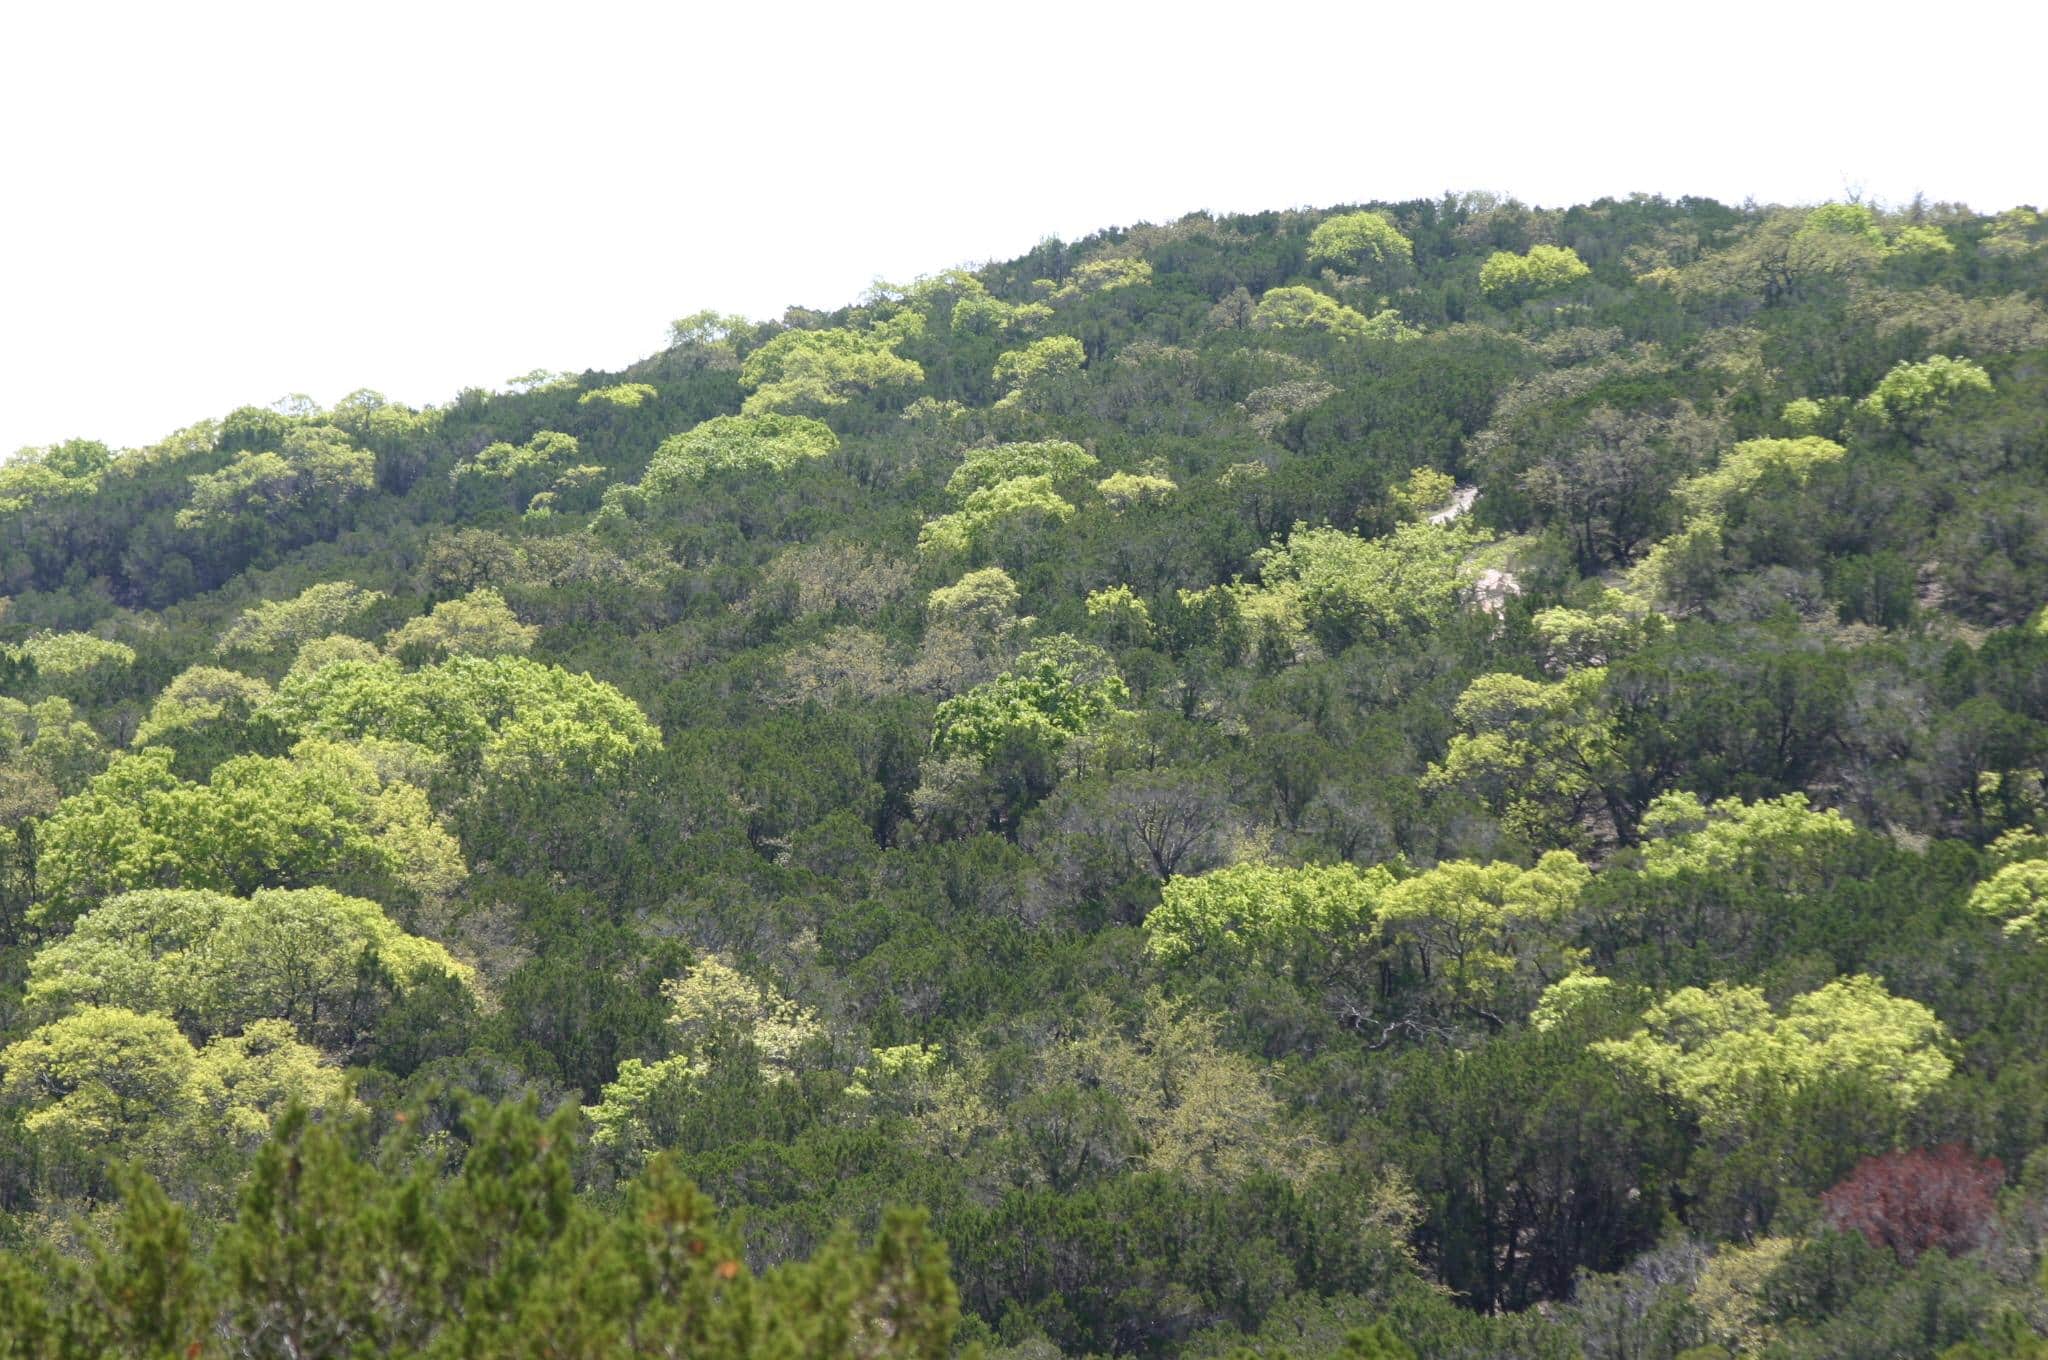
39. Texas
- Share of deer harvested with a bow or crossbow, 2022: 9% (approx. 61,260 deer)
- Total deer harvested, 2022: 680,671 (55.4% antlered buck, 44.6% antlerless deer)
- Paid hunting license holders, 2022: 37.7 per 1,000 people (1,132,186 total)
38. Louisiana
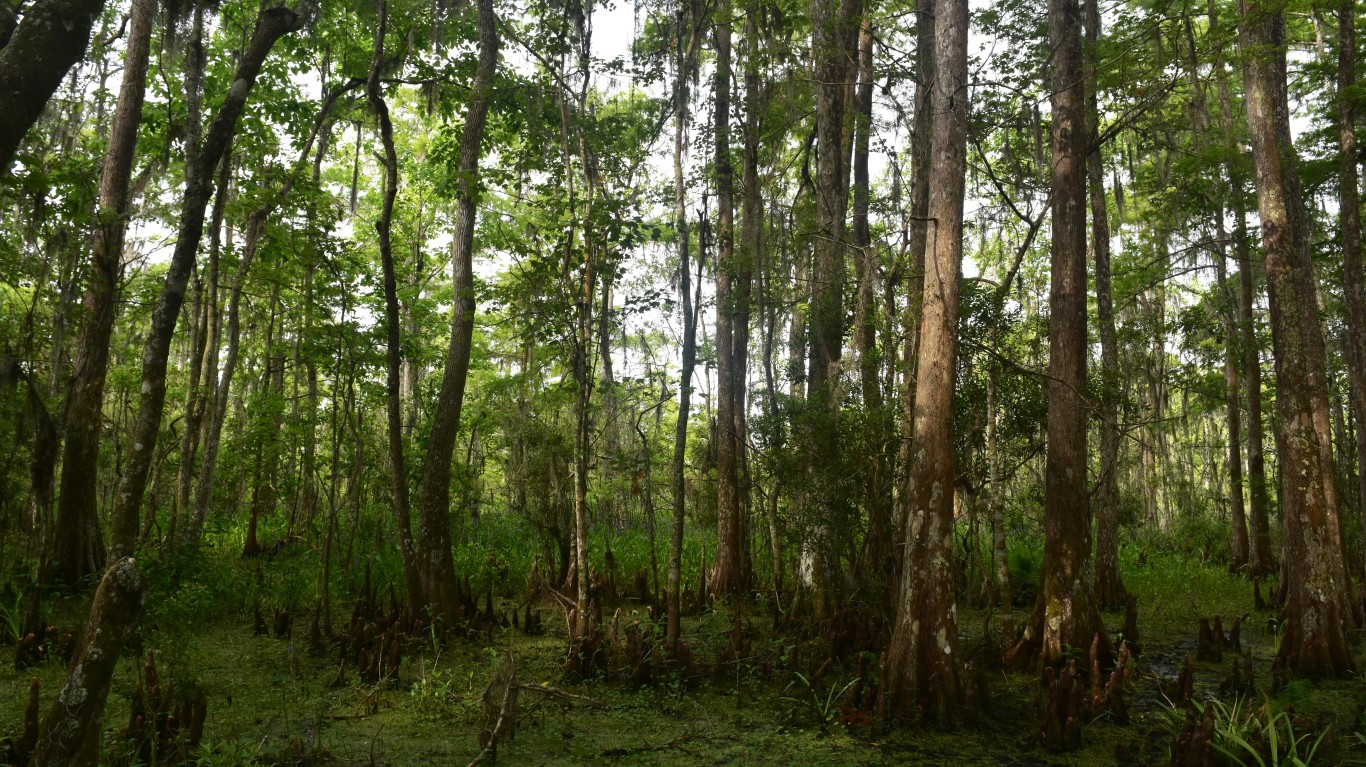
- Share of deer harvested with a bow or crossbow, 2022: 9% (approx. 19,593 deer)
- Total deer harvested, 2022: 217,700 (55.5% antlered buck, 44.5% antlerless deer)
- Paid hunting license holders, 2022: 94.4 per 1,000 people (433,219 total)
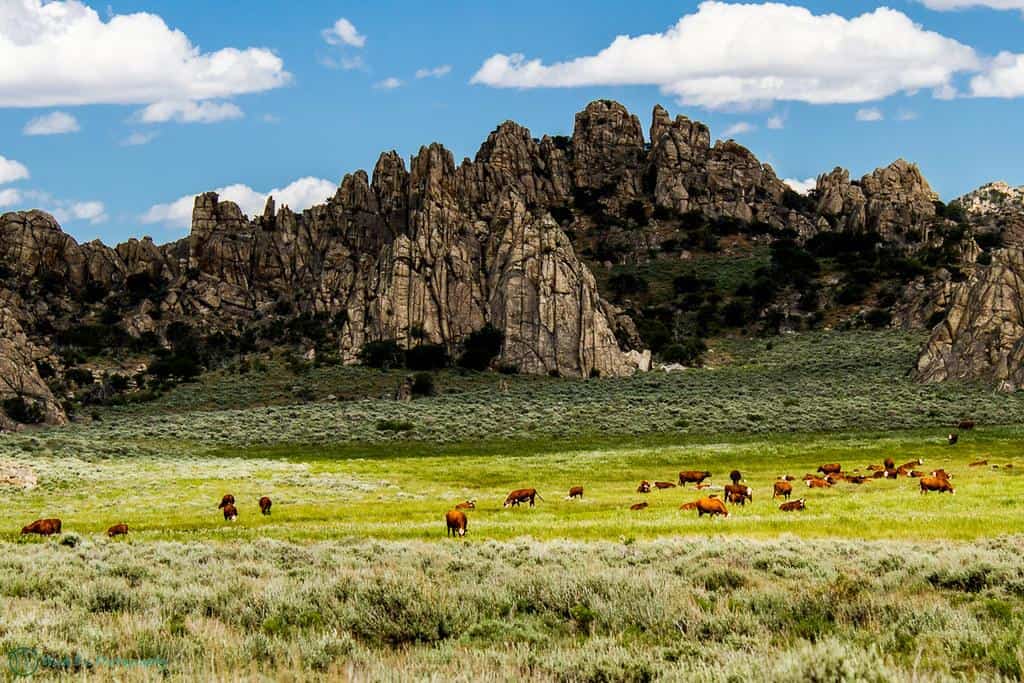
37. Utah
- Share of deer harvested with a bow or crossbow, 2022: 10% (approx. 2,754 deer)
- Total deer harvested, 2022: 27,536 (92.9% antlered buck, 7.1% antlerless deer)
- Paid hunting license holders, 2022: 79.0 per 1,000 people (267,238 total)
36. Maine

- Share of deer harvested with a bow or crossbow, 2022: 11% (approx. 4,817 deer)
- Total deer harvested, 2022: 43,787 (54.4% antlered buck, 45.6% antlerless deer)
- Paid hunting license holders, 2022: 154.2 per 1,000 people (213,686 total)
35. Nebraska
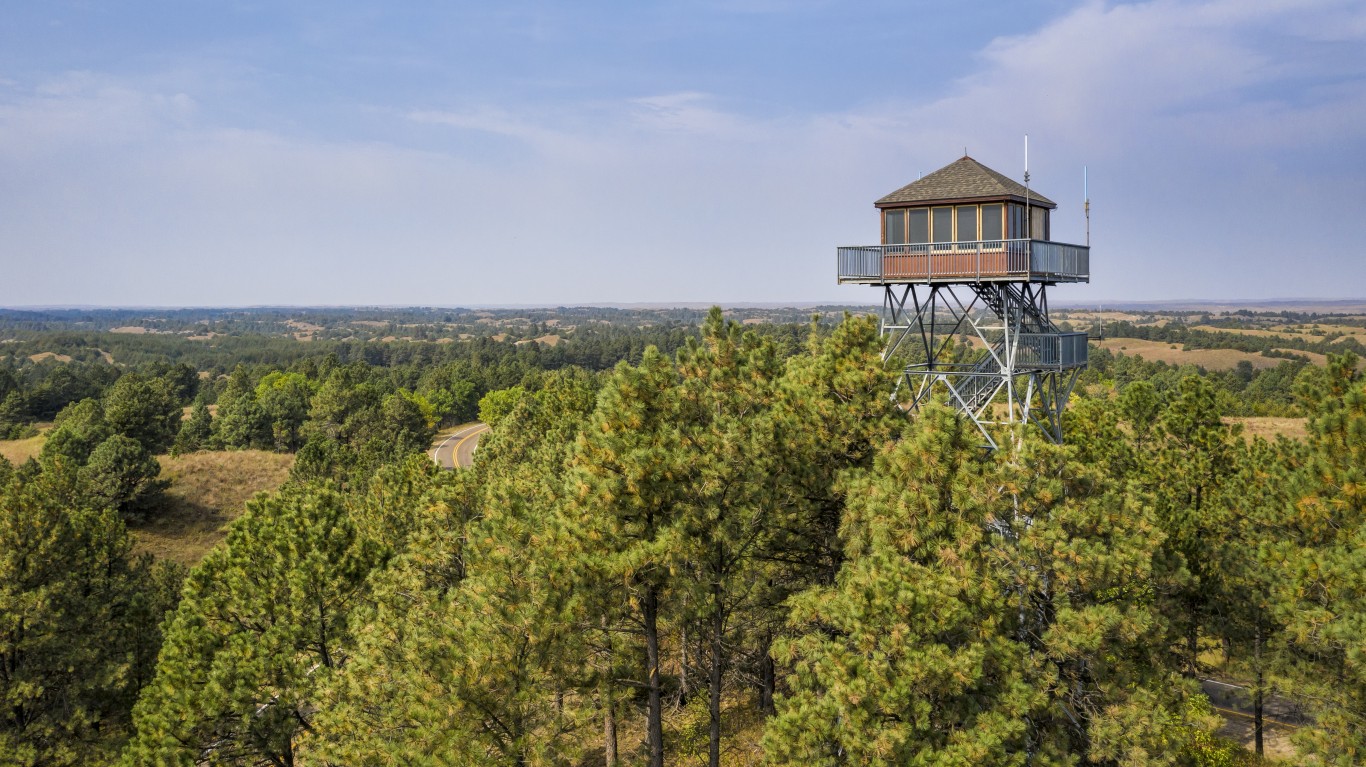
- Share of deer harvested with a bow or crossbow, 2022: 12% (approx. 4,835 deer)
- Total deer harvested, 2022: 40,289 (58.1% antlered buck, 41.9% antlerless deer)
- Paid hunting license holders, 2022: 122.6 per 1,000 people (241,271 total)
34. North Carolina

- Share of deer harvested with a bow or crossbow, 2022: 13% (approx. 21,298 deer)
- Total deer harvested, 2022: 163,831 (52.6% antlered buck, 47.4% antlerless deer)
- Paid hunting license holders, 2022: 60.8 per 1,000 people (650,361 total)
33. Tennessee
- Share of deer harvested with a bow or crossbow, 2022: 13% (approx. 21,222 deer)
- Total deer harvested, 2022: 163,244 (52.9% antlered buck, 47.1% antlerless deer)
- Paid hunting license holders, 2022: 119.7 per 1,000 people (844,172 total)
32. Nevada
- Share of deer harvested with a bow or crossbow, 2022: 14% (approx. 770 deer)
- Total deer harvested, 2022: 5,500 (87.0% antlered buck, 13.0% antlerless deer)
- Paid hunting license holders, 2022: 34.0 per 1,000 people (107,978 total)
31. Minnesota
- Share of deer harvested with a bow or crossbow, 2022: 14% (approx. 24,117 deer)
- Total deer harvested, 2022: 172,265 (51.2% antlered buck, 48.8% antlerless deer)
- Paid hunting license holders, 2022: 94.8 per 1,000 people (542,085 total)
30. Arizona
- Share of deer harvested with a bow or crossbow, 2022: 15% (approx. 1,028 deer)
- Total deer harvested, 2022: 6,856 (99.3% antlered buck, 0.7% antlerless deer)
- Paid hunting license holders, 2022: 39.0 per 1,000 people (287,033 total)
29. New Mexico
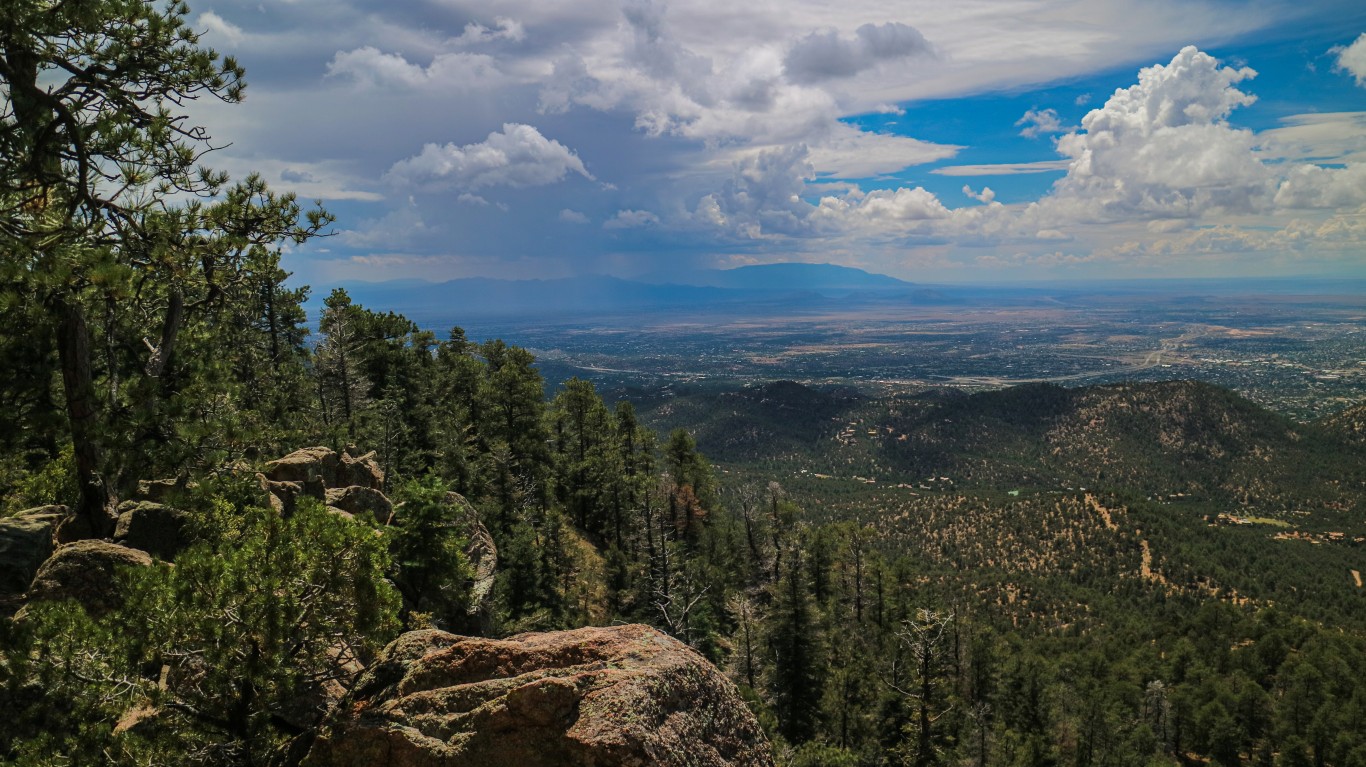
- Share of deer harvested with a bow or crossbow, 2022: 15% (approx. 1,390 deer)
- Total deer harvested, 2022: 9,266 (98.1% antlered buck, 1.9% antlerless deer)
- Paid hunting license holders, 2022: 75.9 per 1,000 people (160,322 total)
28. Arkansas
- Share of deer harvested with a bow or crossbow, 2022: 15% (approx. 27,837 deer)
- Total deer harvested, 2022: 185,579 (48.4% antlered buck, 51.6% antlerless deer)
- Paid hunting license holders, 2022: 114.1 per 1,000 people (347,418 total)
27. Virginia
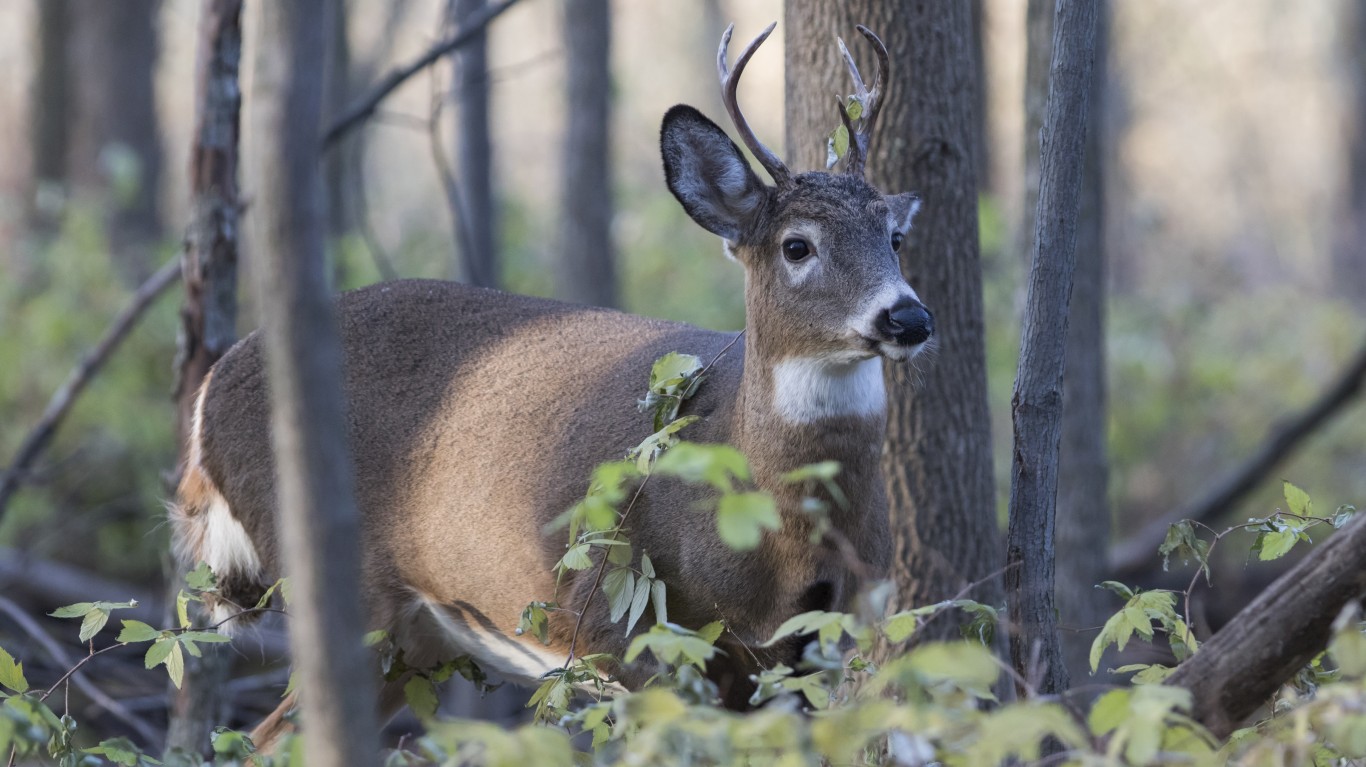
- Share of deer harvested with a bow or crossbow, 2022: 16% (approx. 29,886 deer)
- Total deer harvested, 2022: 186,788 (49.0% antlered buck, 51.0% antlerless deer)
- Paid hunting license holders, 2022: 28.7 per 1,000 people (248,951 total)
26. South Dakota
- Share of deer harvested with a bow or crossbow, 2022: 16% (approx. 8,861 deer)
- Total deer harvested, 2022: 55,380 (61.5% antlered buck, 38.5% antlerless deer)
- Paid hunting license holders, 2022: 249.8 per 1,000 people (227,312 total)
25. Georgia
- Share of deer harvested with a bow or crossbow, 2022: 18% (approx. 48,818 deer)
- Total deer harvested, 2022: 271,211 (35.5% antlered buck, 64.5% antlerless deer)
- Paid hunting license holders, 2022: 75.1 per 1,000 people (819,893 total)
24. Missouri

- Share of deer harvested with a bow or crossbow, 2022: 19% (approx. 56,947 deer)
- Total deer harvested, 2022: 299,719 (47.0% antlered buck, 53.0% antlerless deer)
- Paid hunting license holders, 2022: 82.5 per 1,000 people (509,942 total)
23. Mississippi
- Share of deer harvested with a bow or crossbow, 2022: 19% (approx. 49,938 deer)
- Total deer harvested, 2022: 262,830 (45.3% antlered buck, 54.7% antlerless deer)
- Paid hunting license holders, 2022: 93.5 per 1,000 people (274,879 total)
22. Delaware
- Share of deer harvested with a bow or crossbow, 2022: 20% (approx. 3,370 deer)
- Total deer harvested, 2022: 16,848 (25.9% antlered buck, 74.1% antlerless deer)
- Paid hunting license holders, 2022: 15.7 per 1,000 people (16,034 total)
21. Kentucky

- Share of deer harvested with a bow or crossbow, 2022: 20% (approx. 28,899 deer)
- Total deer harvested, 2022: 144,493 (49.2% antlered buck, 50.8% antlerless deer)
- Paid hunting license holders, 2022: 70.7 per 1,000 people (318,869 total)
20. North Dakota

- Share of deer harvested with a bow or crossbow, 2022: 21% (approx. 6,307 deer)
- Total deer harvested, 2022: 30,031 (58.3% antlered buck, 41.7% antlerless deer)
- Paid hunting license holders, 2022: 190.1 per 1,000 people (148,101 total)
19. Alabama

- Share of deer harvested with a bow or crossbow, 2022: 22% (approx. 67,920 deer)
- Total deer harvested, 2022: 308,729 (44.6% antlered buck, 55.4% antlerless deer)
- Paid hunting license holders, 2022: 95.9 per 1,000 people (486,674 total)
18. Florida
- Share of deer harvested with a bow or crossbow, 2022: 24% (approx. 22,436 deer)
- Total deer harvested, 2022: 93,484 (69.5% antlered buck, 30.5% antlerless deer)
- Paid hunting license holders, 2022: 9.8 per 1,000 people (219,074 total)
17. New York

- Share of deer harvested with a bow or crossbow, 2022: 24% (approx. 55,671 deer)
- Total deer harvested, 2022: 231,961 (50.2% antlered buck, 49.8% antlerless deer)
- Paid hunting license holders, 2022: 28.1 per 1,000 people (553,475 total)
16. Indiana
- Share of deer harvested with a bow or crossbow, 2022: 26% (approx. 31,682 deer)
- Total deer harvested, 2022: 121,854 (56.6% antlered buck, 43.4% antlerless deer)
- Paid hunting license holders, 2022: 39.3 per 1,000 people (268,630 total)
15. West Virginia

- Share of deer harvested with a bow or crossbow, 2022: 28% (approx. 33,180 deer)
- Total deer harvested, 2022: 118,499 (60.4% antlered buck, 39.6% antlerless deer)
- Paid hunting license holders, 2022: 149.3 per 1,000 people (265,103 total)
14. Wisconsin
- Share of deer harvested with a bow or crossbow, 2022: 29% (approx. 98,682 deer)
- Total deer harvested, 2022: 340,282 (48.1% antlered buck, 51.9% antlerless deer)
- Paid hunting license holders, 2022: 112.8 per 1,000 people (664,738 total)
13. Michigan

- Share of deer harvested with a bow or crossbow, 2022: 31% (approx. 105,149 deer)
- Total deer harvested, 2022: 339,189 (60.1% antlered buck, 39.9% antlerless deer)
- Paid hunting license holders, 2022: 63.2 per 1,000 people (634,627 total)
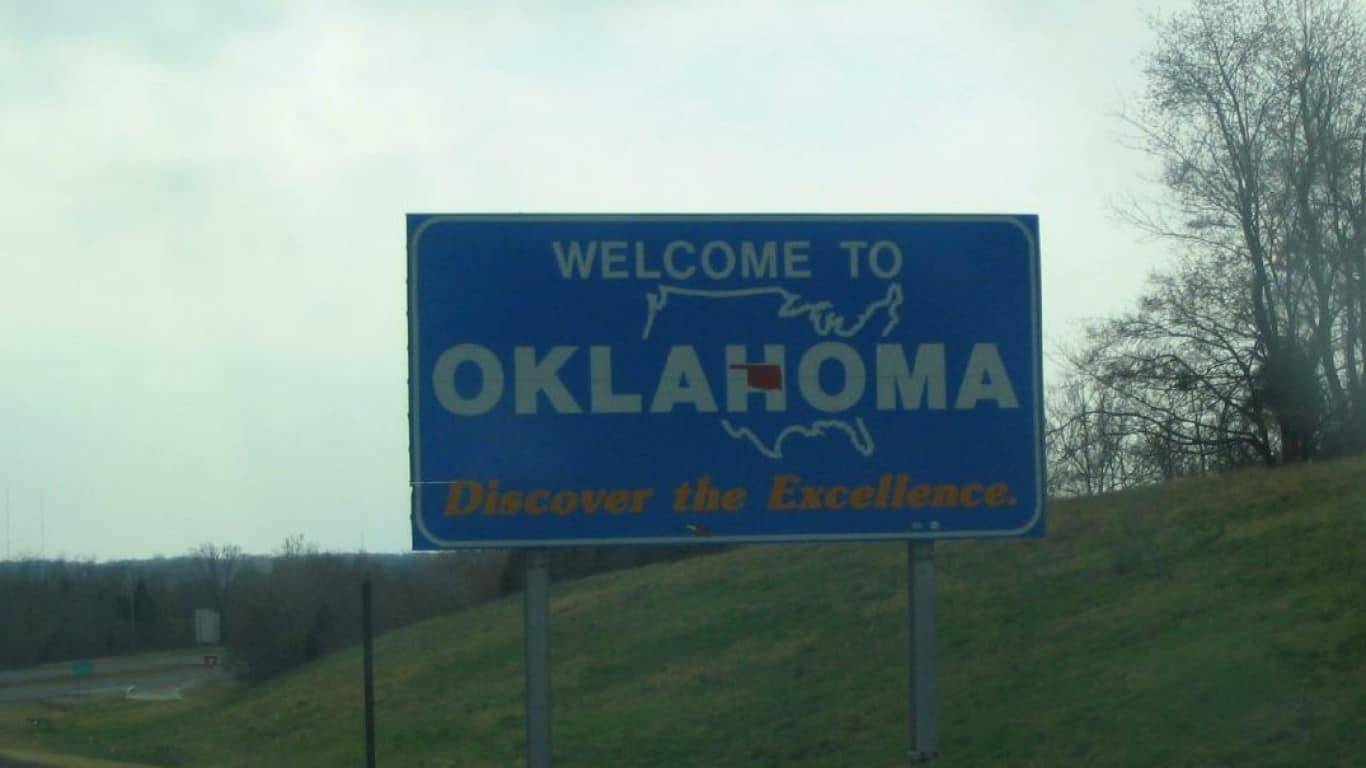
12. Oklahoma
- Share of deer harvested with a bow or crossbow, 2022: 31% (approx. 41,589 deer)
- Total deer harvested, 2022: 134,158 (54.5% antlered buck, 45.5% antlerless deer)
- Paid hunting license holders, 2022: 92.7 per 1,000 people (372,663 total)
11. New Hampshire

- Share of deer harvested with a bow or crossbow, 2022: 33% (approx. 4,647 deer)
- Total deer harvested, 2022: 14,082 (59.2% antlered buck, 40.8% antlerless deer)
- Paid hunting license holders, 2022: 43.2 per 1,000 people (60,323 total)
10. Vermont

- Share of deer harvested with a bow or crossbow, 2022: 34% (approx. 5,937 deer)
- Total deer harvested, 2022: 17,461 (55.1% antlered buck, 44.9% antlerless deer)
- Paid hunting license holders, 2022: 93.8 per 1,000 people (60,719 total)
9. Pennsylvania
- Share of deer harvested with a bow or crossbow, 2022: 35% (approx. 148,036 deer)
- Total deer harvested, 2022: 422,960 (38.8% antlered buck, 61.2% antlerless deer)
- Paid hunting license holders, 2022: 75.6 per 1,000 people (981,320 total)
8. Iowa

- Share of deer harvested with a bow or crossbow, 2022: 36% (approx. 39,456 deer)
- Total deer harvested, 2022: 109,600 (42.4% antlered buck, 57.6% antlerless deer)
- Paid hunting license holders, 2022: 68.6 per 1,000 people (219,432 total)
7. Kansas
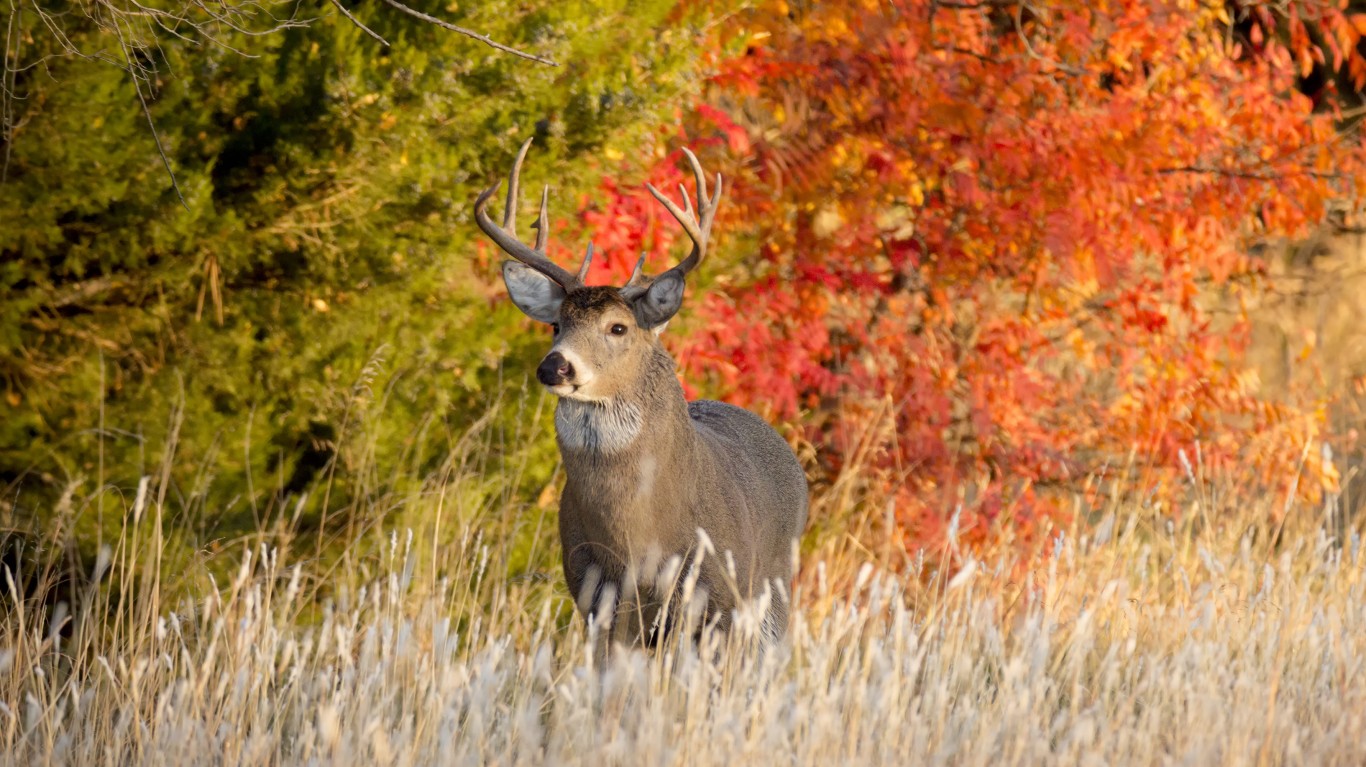
- Share of deer harvested with a bow or crossbow, 2022: 40% (approx. 32,326 deer)
- Total deer harvested, 2022: 80,815 (51.9% antlered buck, 48.1% antlerless deer)
- Paid hunting license holders, 2022: 94.3 per 1,000 people (277,050 total)
6. Rhode Island
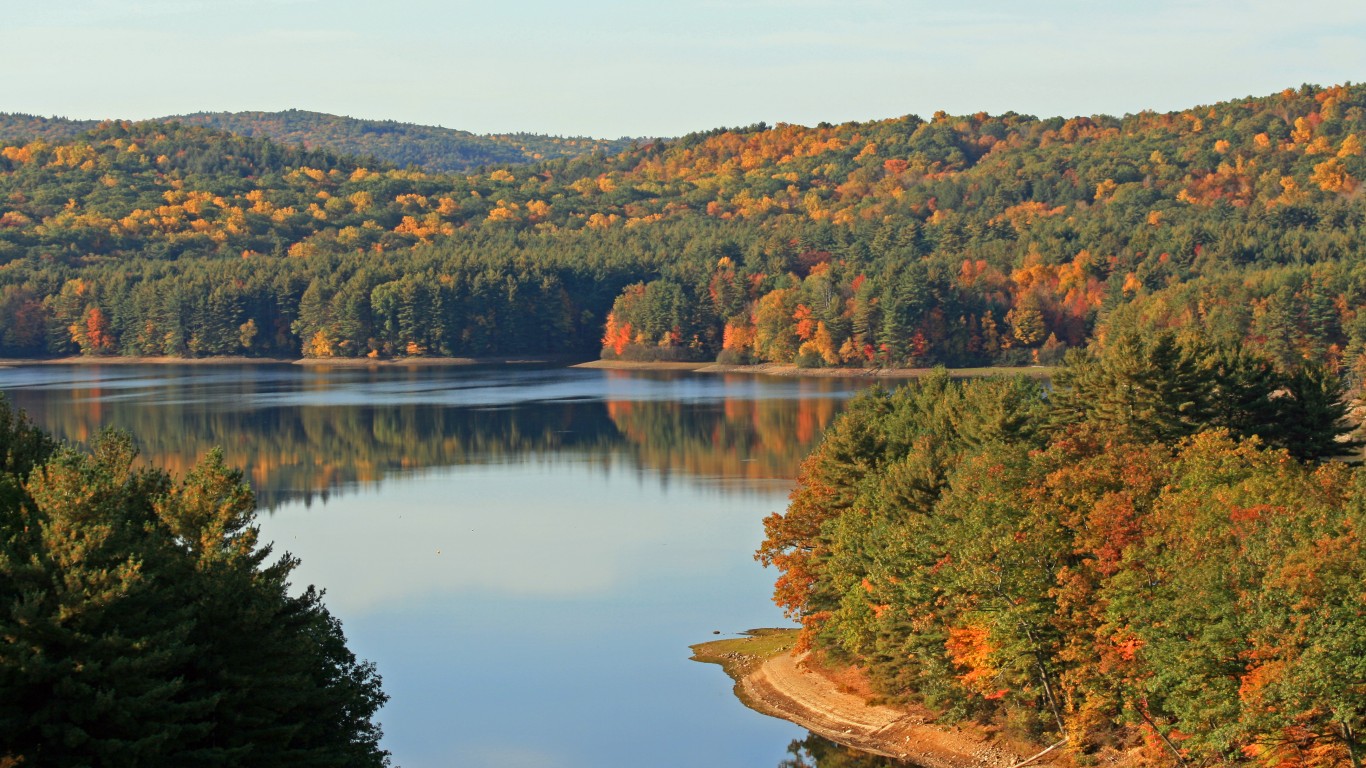
- Share of deer harvested with a bow or crossbow, 2022: 42% (approx. 1,136 deer)
- Total deer harvested, 2022: 2,705 (48.1% antlered buck, 51.9% antlerless deer)
- Paid hunting license holders, 2022: 7.4 per 1,000 people (8,099 total)
5. Illinois
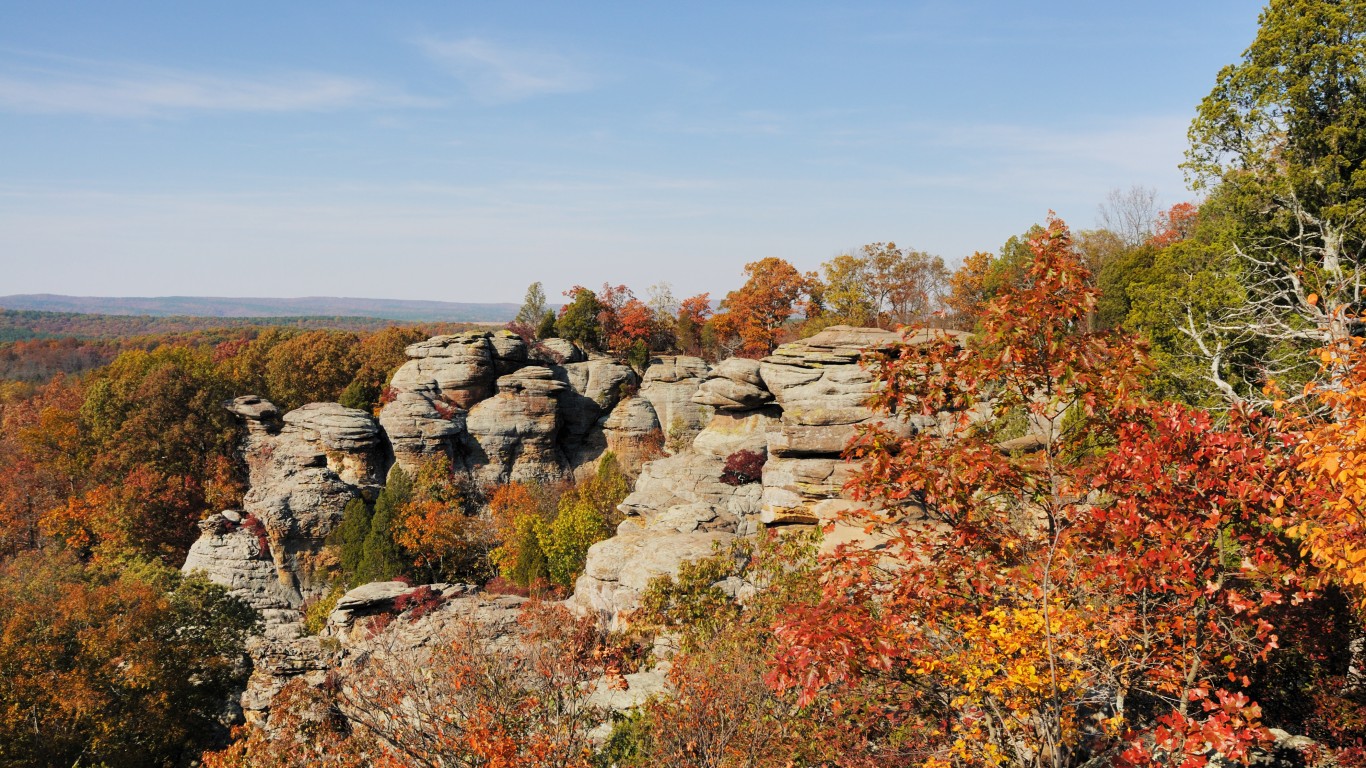
- Share of deer harvested with a bow or crossbow, 2022: 43% (approx. 67,877 deer)
- Total deer harvested, 2022: 157,854 (46.4% antlered buck, 53.6% antlerless deer)
- Paid hunting license holders, 2022: 22.8 per 1,000 people (287,438 total)
4. Massachusetts
- Share of deer harvested with a bow or crossbow, 2022: 46% (approx. 7,292 deer)
- Total deer harvested, 2022: 15,853 (57.3% antlered buck, 42.7% antlerless deer)
- Paid hunting license holders, 2022: 8.9 per 1,000 people (61,865 total)
3. Connecticut
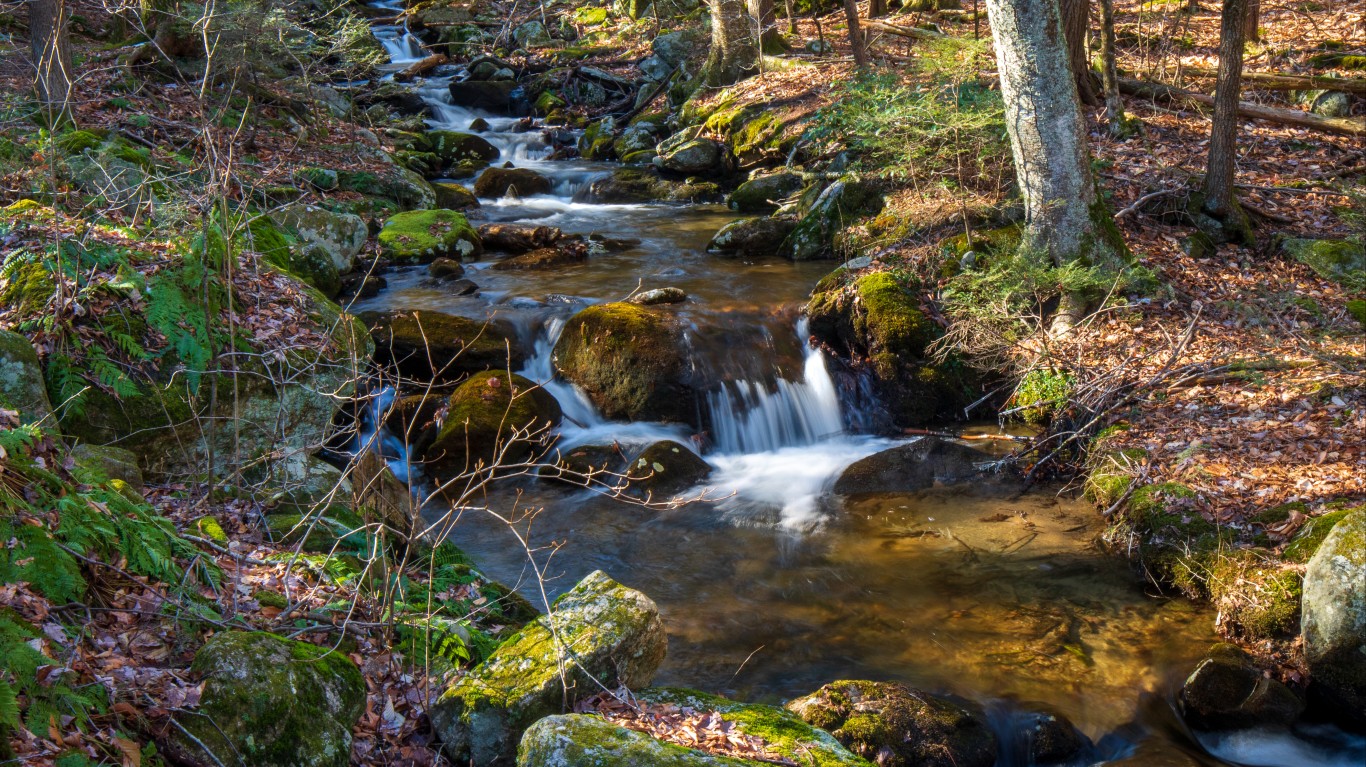
- Share of deer harvested with a bow or crossbow, 2022: 47% (approx. 4,909 deer)
- Total deer harvested, 2022: 10,445 (53.6% antlered buck, 46.4% antlerless deer)
- Paid hunting license holders, 2022: 7.9 per 1,000 people (28,670 total)
2. Ohio
- Share of deer harvested with a bow or crossbow, 2022: 47% (approx. 99,157 deer)
- Total deer harvested, 2022: 210,973 (42.7% antlered buck, 57.3% antlerless deer)
- Paid hunting license holders, 2022: 30.2 per 1,000 people (354,606 total)
1. New Jersey
- Share of deer harvested with a bow or crossbow, 2022: 65% (approx. 24,911 deer)
- Total deer harvested, 2022: 38,324 (42.0% antlered buck, 58.0% antlerless deer)
- Paid hunting license holders, 2022: 7.7 per 1,000 people (70,907 total)
Thank you for reading! Have some feedback for us?
Contact the 24/7 Wall St. editorial team.
