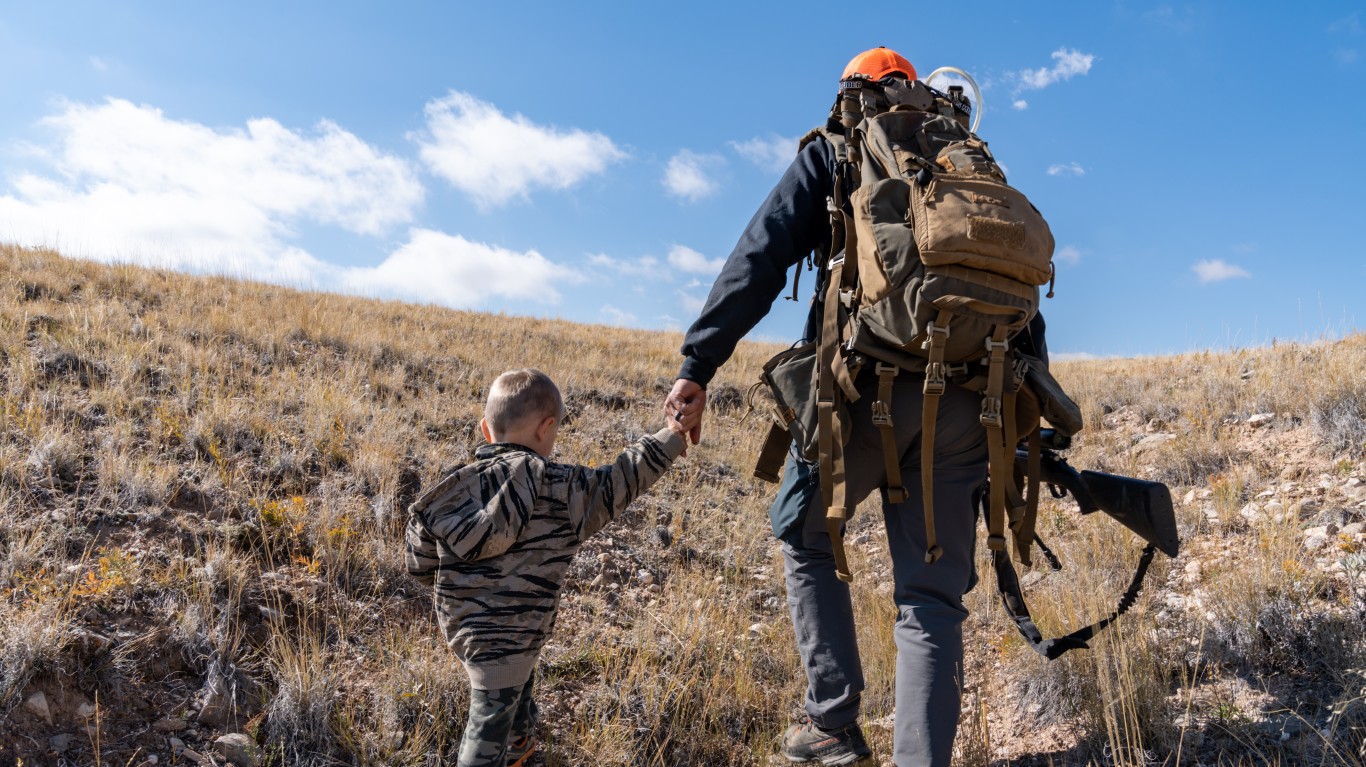
Hunting is no longer a practical necessity for most Americans. But, as a pastime, it is growing increasingly popular. In each of the last two years, the number of licensed hunters in the U.S. hit multi-decade highs of over 15.9 million. As recently as 2010, there were fewer than 14.5 million hunters in the United States, according to the U.S. Fish and Wildlife Service.
Deer are by far the most commonly hunted game in the United States. Along with bear, elk, and wild turkey, deer are considered big game. In 2022, nearly 80% of American sports men and women hunted big game. Meanwhile, about 37% of hunters pursued small game — like rabbits, squirrels, pheasants, and quail — and 19% hunted waterfowl and other migratory birds, according to the USFWS.
While hunting is gaining popularity nationwide, it is far more common in certain parts of the country.
Using 2022 data from the FWS, 24/7 Wall St. identified the states with the most hunters. We ranked all 50 states on the total number of paid hunting license holders for every 1,000 state residents. Population figures used to calculate this ranking are from the U.S. Census Bureau’s 2022 American Community Survey. Supplemental data on hunting license expenditures is also from the FWS. Data on deer harvest totals by state is from the National Deer Association, a wildlife and habitat preservation organization.
Depending on the state, the number of hunters per 1,000 people ranges from fewer than 10 to well over 200. For context, there are about 48 licensed hunters for every 1,000 people nationwide. (Here is a look at the most versatile hunting rifle cartridges.)
According to the FWS’ 2022 National Survey of Fishing, Hunting, and Wildlife-Associated Recreation, Americans who live in large urban areas are far less likely to hunt than those in smaller cities or rural areas. Not surprisingly, the states where the greatest share of residents are licensed hunters have larger than average rural populations. Among the 10 highest ranking states on this list, anywhere from 27% to 61% of the population reside in rural areas, compared to only 20% of Americans nationwide who do.
The highest ranking states are also disproportionately concentrated in the West and the Midwest. These states tend to have low population densities, and in many of them, large swathes of land are federally owned and open to the public for hunting. (Here is a look at the state economies most dependent on outdoor recreation.)
Why It Matters

Every state in the country is home to thousands of hunters — and in some states, hunting is an integral to cultural identity. Hunting is also big business. Americans spent a combined $1.1 billion on hunting licenses, stamps, tags, and permits in 2022 — and another $32.9 billion on hunting equipment and trip-related expenses.
50. California
- Hunters in 2022: 7.0 per 1,000 people (260,359 hunters total)
- Total spending on hunting licenses in 2022: $23,601,831
- Deer harvested in 2022: 22,872 (97.0% buck; 03% antlerless)
- Deer harvest by weapon type: N/A
49. Rhode Island

- Hunters in 2022: 7.0 per 1,000 people (8,099 hunters total)
- Total spending on hunting licenses in 2022: $543,574
- Deer harvested in 2022: 2,705 (48.0% buck; 52% antlerless)
- Deer harvest by weapon type: 42 % bow; 17 % rifle or shotgun; 42 % muzzleloader
48. New Jersey
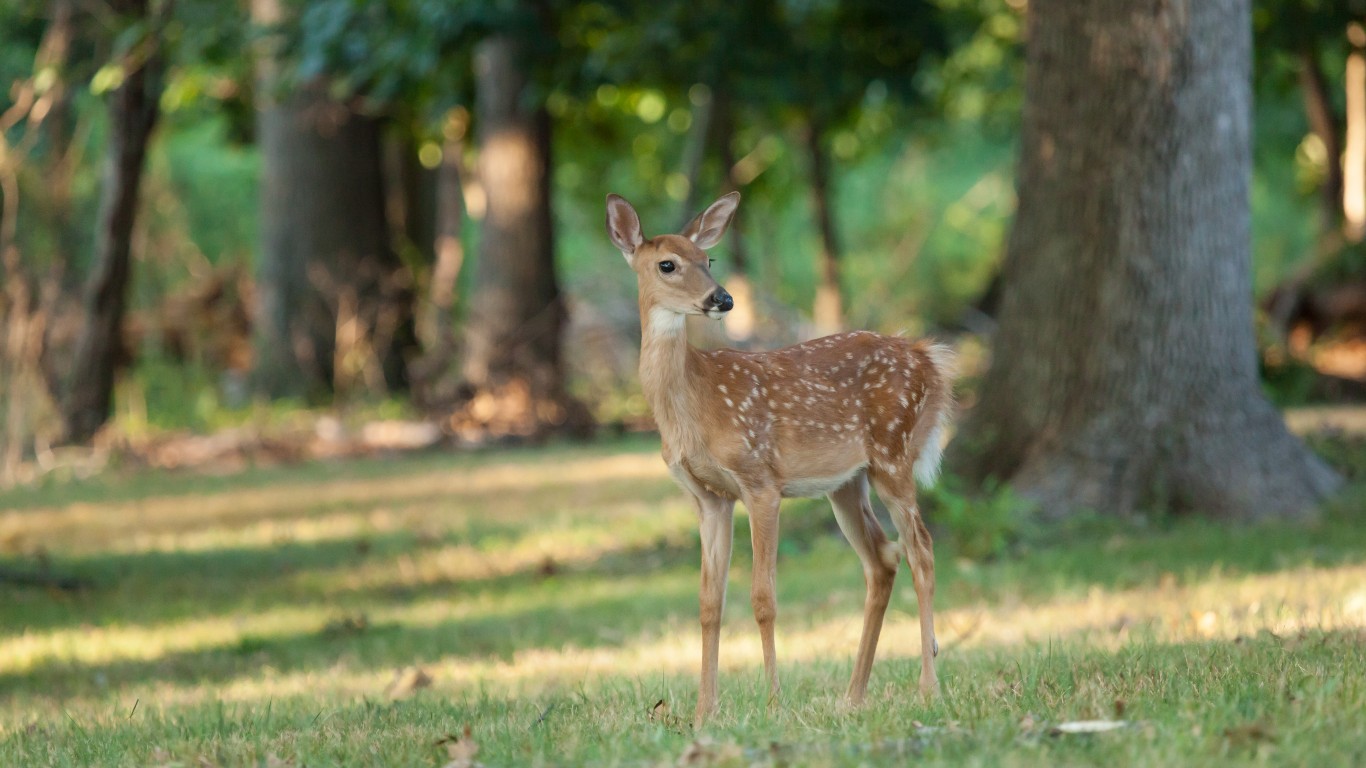
- Hunters in 2022: 8.0 per 1,000 people (70,907 hunters total)
- Total spending on hunting licenses in 2022: $8,161,522
- Deer harvested in 2022: 38,324 (42.0% buck; 58% antlerless)
- Deer harvest by weapon type: 65 % bow; 25 % rifle or shotgun; 10 % muzzleloader
47. Connecticut
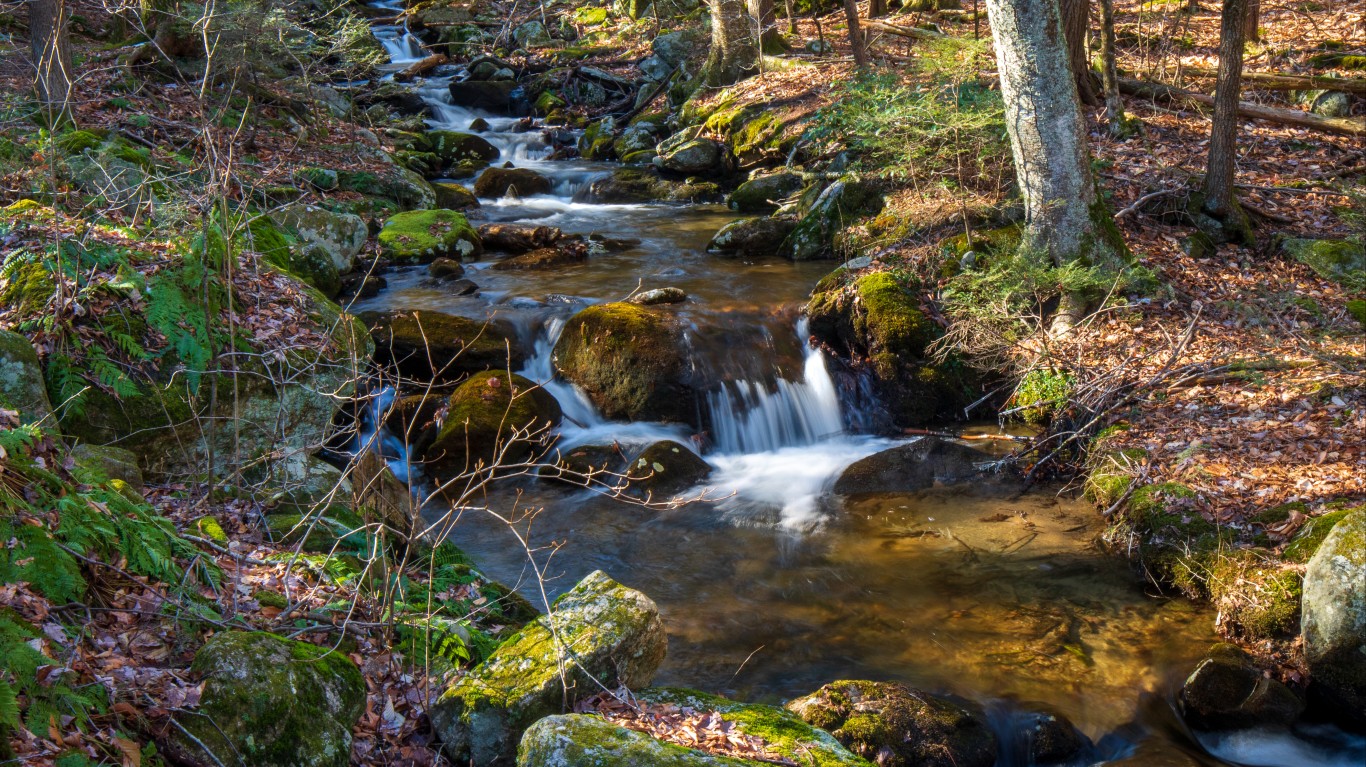
- Hunters in 2022: 8.0 per 1,000 people (28,670 hunters total)
- Total spending on hunting licenses in 2022: $2,204,872
- Deer harvested in 2022: 10,445 (54.0% buck; 46% antlerless)
- Deer harvest by weapon type: 47 % bow; 36 % rifle or shotgun; 7 % muzzleloader
46. Hawaii

- Hunters in 2022: 9.0 per 1,000 people (12,450 hunters total)
- Total spending on hunting licenses in 2022: $798,986
- Deer harvested in 2022: N/A
- Deer harvest by weapon type: N/A
45. Massachusetts
- Hunters in 2022: 9.0 per 1,000 people (61,865 hunters total)
- Total spending on hunting licenses in 2022: $3,757,725
- Deer harvested in 2022: 15,853 (57.0% buck; 43% antlerless)
- Deer harvest by weapon type: 46 % bow; 31 % rifle or shotgun; 23 % muzzleloader
44. Florida

- Hunters in 2022: 10.0 per 1,000 people (219,074 hunters total)
- Total spending on hunting licenses in 2022: $8,112,884
- Deer harvested in 2022: 93,484 (70.0% buck; 30% antlerless)
- Deer harvest by weapon type: 24 % bow; 67 % rifle or shotgun; 9 % muzzleloader
43. Delaware
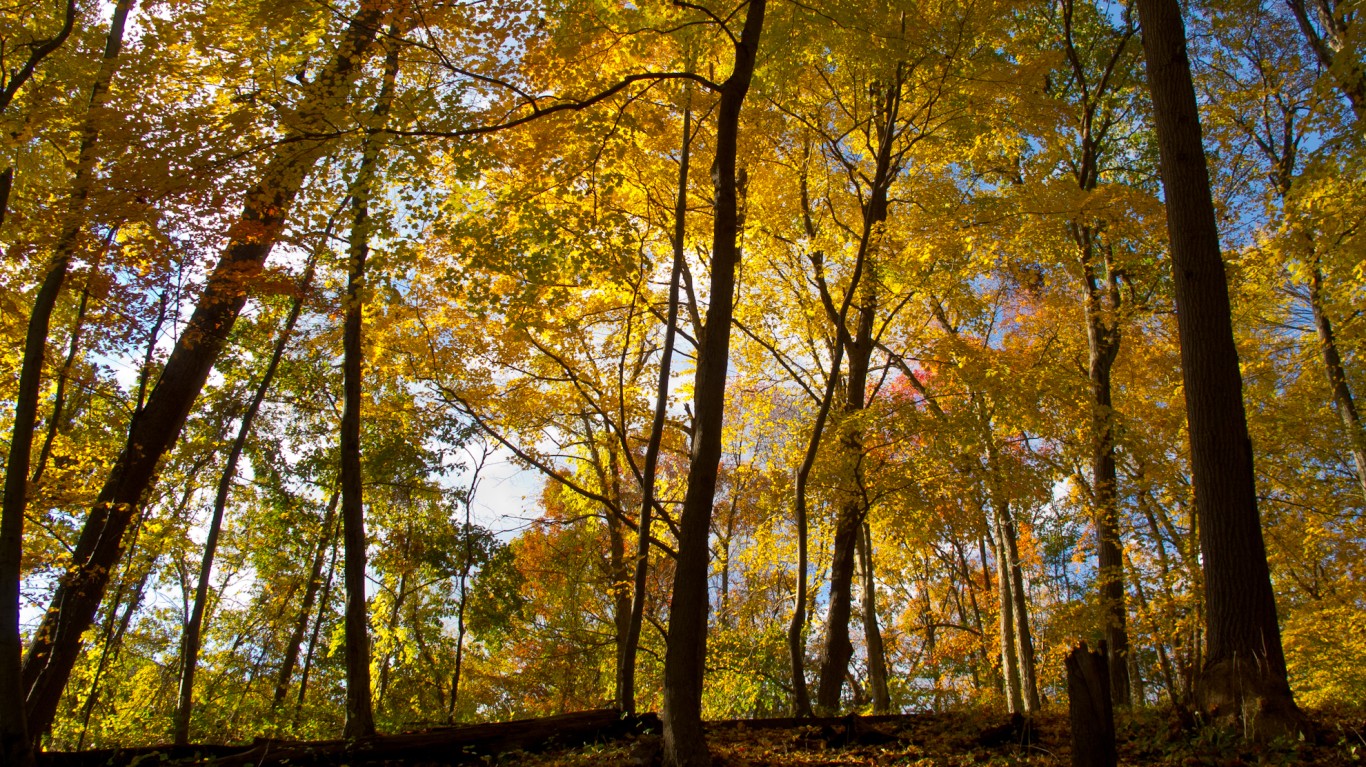
- Hunters in 2022: 16.0 per 1,000 people (16,034 hunters total)
- Total spending on hunting licenses in 2022: $1,536,037
- Deer harvested in 2022: 16,848 (26.0% buck; 74% antlerless)
- Deer harvest by weapon type: 20 % bow; 69 % rifle or shotgun; 11 % muzzleloader
42. Maryland

- Hunters in 2022: 18.0 per 1,000 people (113,460 hunters total)
- Total spending on hunting licenses in 2022: $6,379,820
- Deer harvested in 2022: 76,687 (41.0% buck; 59% antlerless)
- Deer harvest by weapon type: N/A
41. Washington

- Hunters in 2022: 22.0 per 1,000 people (170,975 hunters total)
- Total spending on hunting licenses in 2022: $19,158,014
- Deer harvested in 2022: 23,425 (89.0% buck; 11% antlerless)
- Deer harvest by weapon type: N/A
40. Illinois
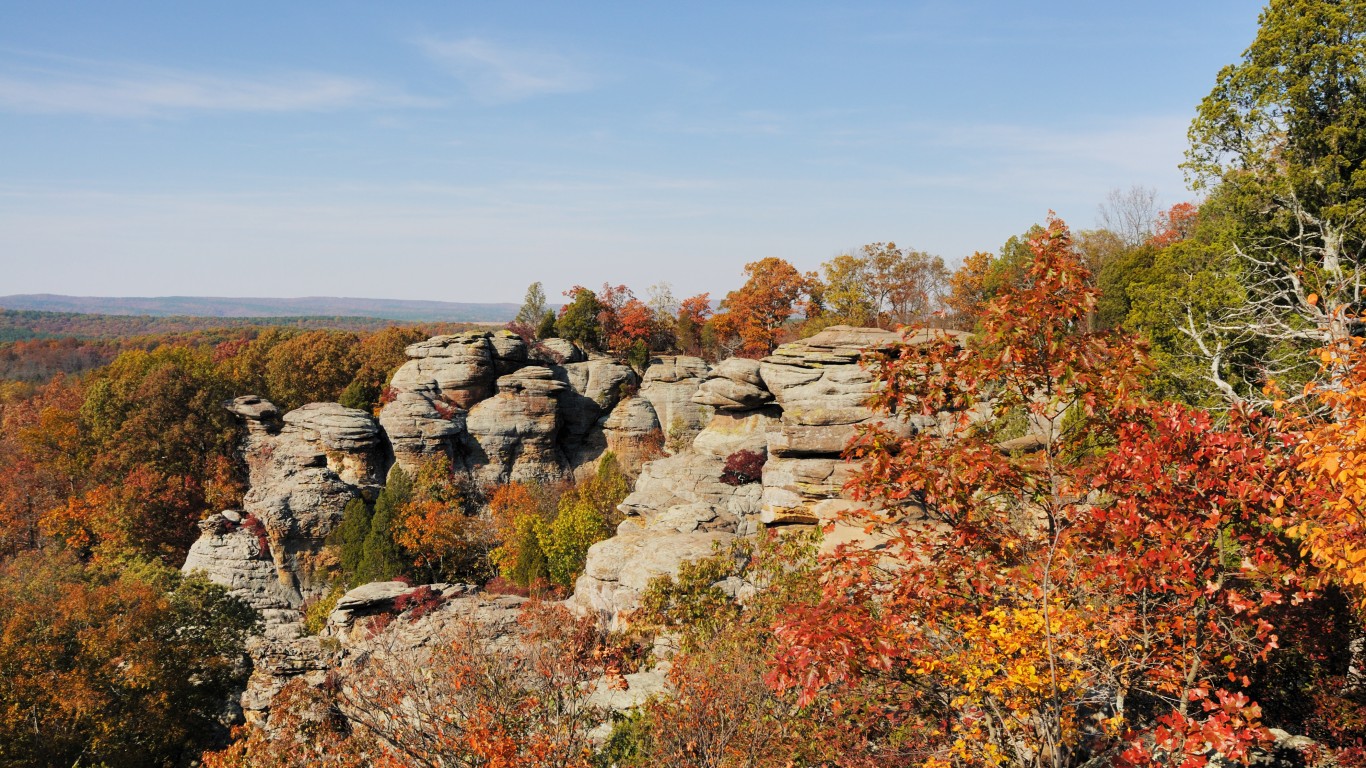
- Hunters in 2022: 23.0 per 1,000 people (287,438 hunters total)
- Total spending on hunting licenses in 2022: $31,104,023
- Deer harvested in 2022: 157,854 (46.0% buck; 54% antlerless)
- Deer harvest by weapon type: 43 % bow; 55 % rifle or shotgun; 2 % muzzleloader
39. New York

- Hunters in 2022: 28.0 per 1,000 people (553,475 hunters total)
- Total spending on hunting licenses in 2022: $23,465,649
- Deer harvested in 2022: 231,961 (50.0% buck; 50% antlerless)
- Deer harvest by weapon type: 24 % bow; 64 % rifle or shotgun; 11 % muzzleloader
38. Virginia

- Hunters in 2022: 29.0 per 1,000 people (248,951 hunters total)
- Total spending on hunting licenses in 2022: $22,676,787
- Deer harvested in 2022: 186,788 (49.0% buck; 51% antlerless)
- Deer harvest by weapon type: 16 % bow; 60 % rifle or shotgun; 24 % muzzleloader
37. Ohio
- Hunters in 2022: 30.0 per 1,000 people (354,606 hunters total)
- Total spending on hunting licenses in 2022: $25,990,333
- Deer harvested in 2022: 210,973 (43.0% buck; 57% antlerless)
- Deer harvest by weapon type: 47 % bow; 46 % rifle or shotgun; 6 % muzzleloader
36. Nevada
- Hunters in 2022: 34.0 per 1,000 people (107,978 hunters total)
- Total spending on hunting licenses in 2022: $7,990,130
- Deer harvested in 2022: 5,500 (87.0% buck; 13% antlerless)
- Deer harvest by weapon type: 14 % bow; 84 % rifle or shotgun; 2 % muzzleloader
35. Texas
- Hunters in 2022: 38.0 per 1,000 people (1,132,186 hunters total)
- Total spending on hunting licenses in 2022: $49,326,005
- Deer harvested in 2022: 680,671 (55.0% buck; 45% antlerless)
- Deer harvest by weapon type: 9 % bow; 89 % rifle or shotgun; 1 % muzzleloader
34. Arizona
- Hunters in 2022: 39.0 per 1,000 people (287,033 hunters total)
- Total spending on hunting licenses in 2022: $20,875,868
- Deer harvested in 2022: 6,856 (99.0% buck; 01% antlerless)
- Deer harvest by weapon type: 15 % bow; 82 % rifle or shotgun; 2 % muzzleloader
33. Indiana

- Hunters in 2022: 39.0 per 1,000 people (268,630 hunters total)
- Total spending on hunting licenses in 2022: $12,564,964
- Deer harvested in 2022: 121,854 (57.0% buck; 43% antlerless)
- Deer harvest by weapon type: 26 % bow; 64 % rifle or shotgun; 10 % muzzleloader
32. South Carolina

- Hunters in 2022: 41.0 per 1,000 people (215,340 hunters total)
- Total spending on hunting licenses in 2022: $10,869,977
- Deer harvested in 2022: 179,414 (50.0% buck; 50% antlerless)
- Deer harvest by weapon type: 8 % bow; 91 % rifle or shotgun; 2 % muzzleloader
31. New Hampshire

- Hunters in 2022: 43.0 per 1,000 people (60,323 hunters total)
- Total spending on hunting licenses in 2022: $5,136,907
- Deer harvested in 2022: 14,082 (59.0% buck; 41% antlerless)
- Deer harvest by weapon type: 33 % bow; 49 % rifle or shotgun; 18 % muzzleloader
30. North Carolina

- Hunters in 2022: 61.0 per 1,000 people (650,361 hunters total)
- Total spending on hunting licenses in 2022: $13,606,237
- Deer harvested in 2022: 163,831 (53.0% buck; 47% antlerless)
- Deer harvest by weapon type: 13 % bow; 79 % rifle or shotgun; 8 % muzzleloader
29. Michigan
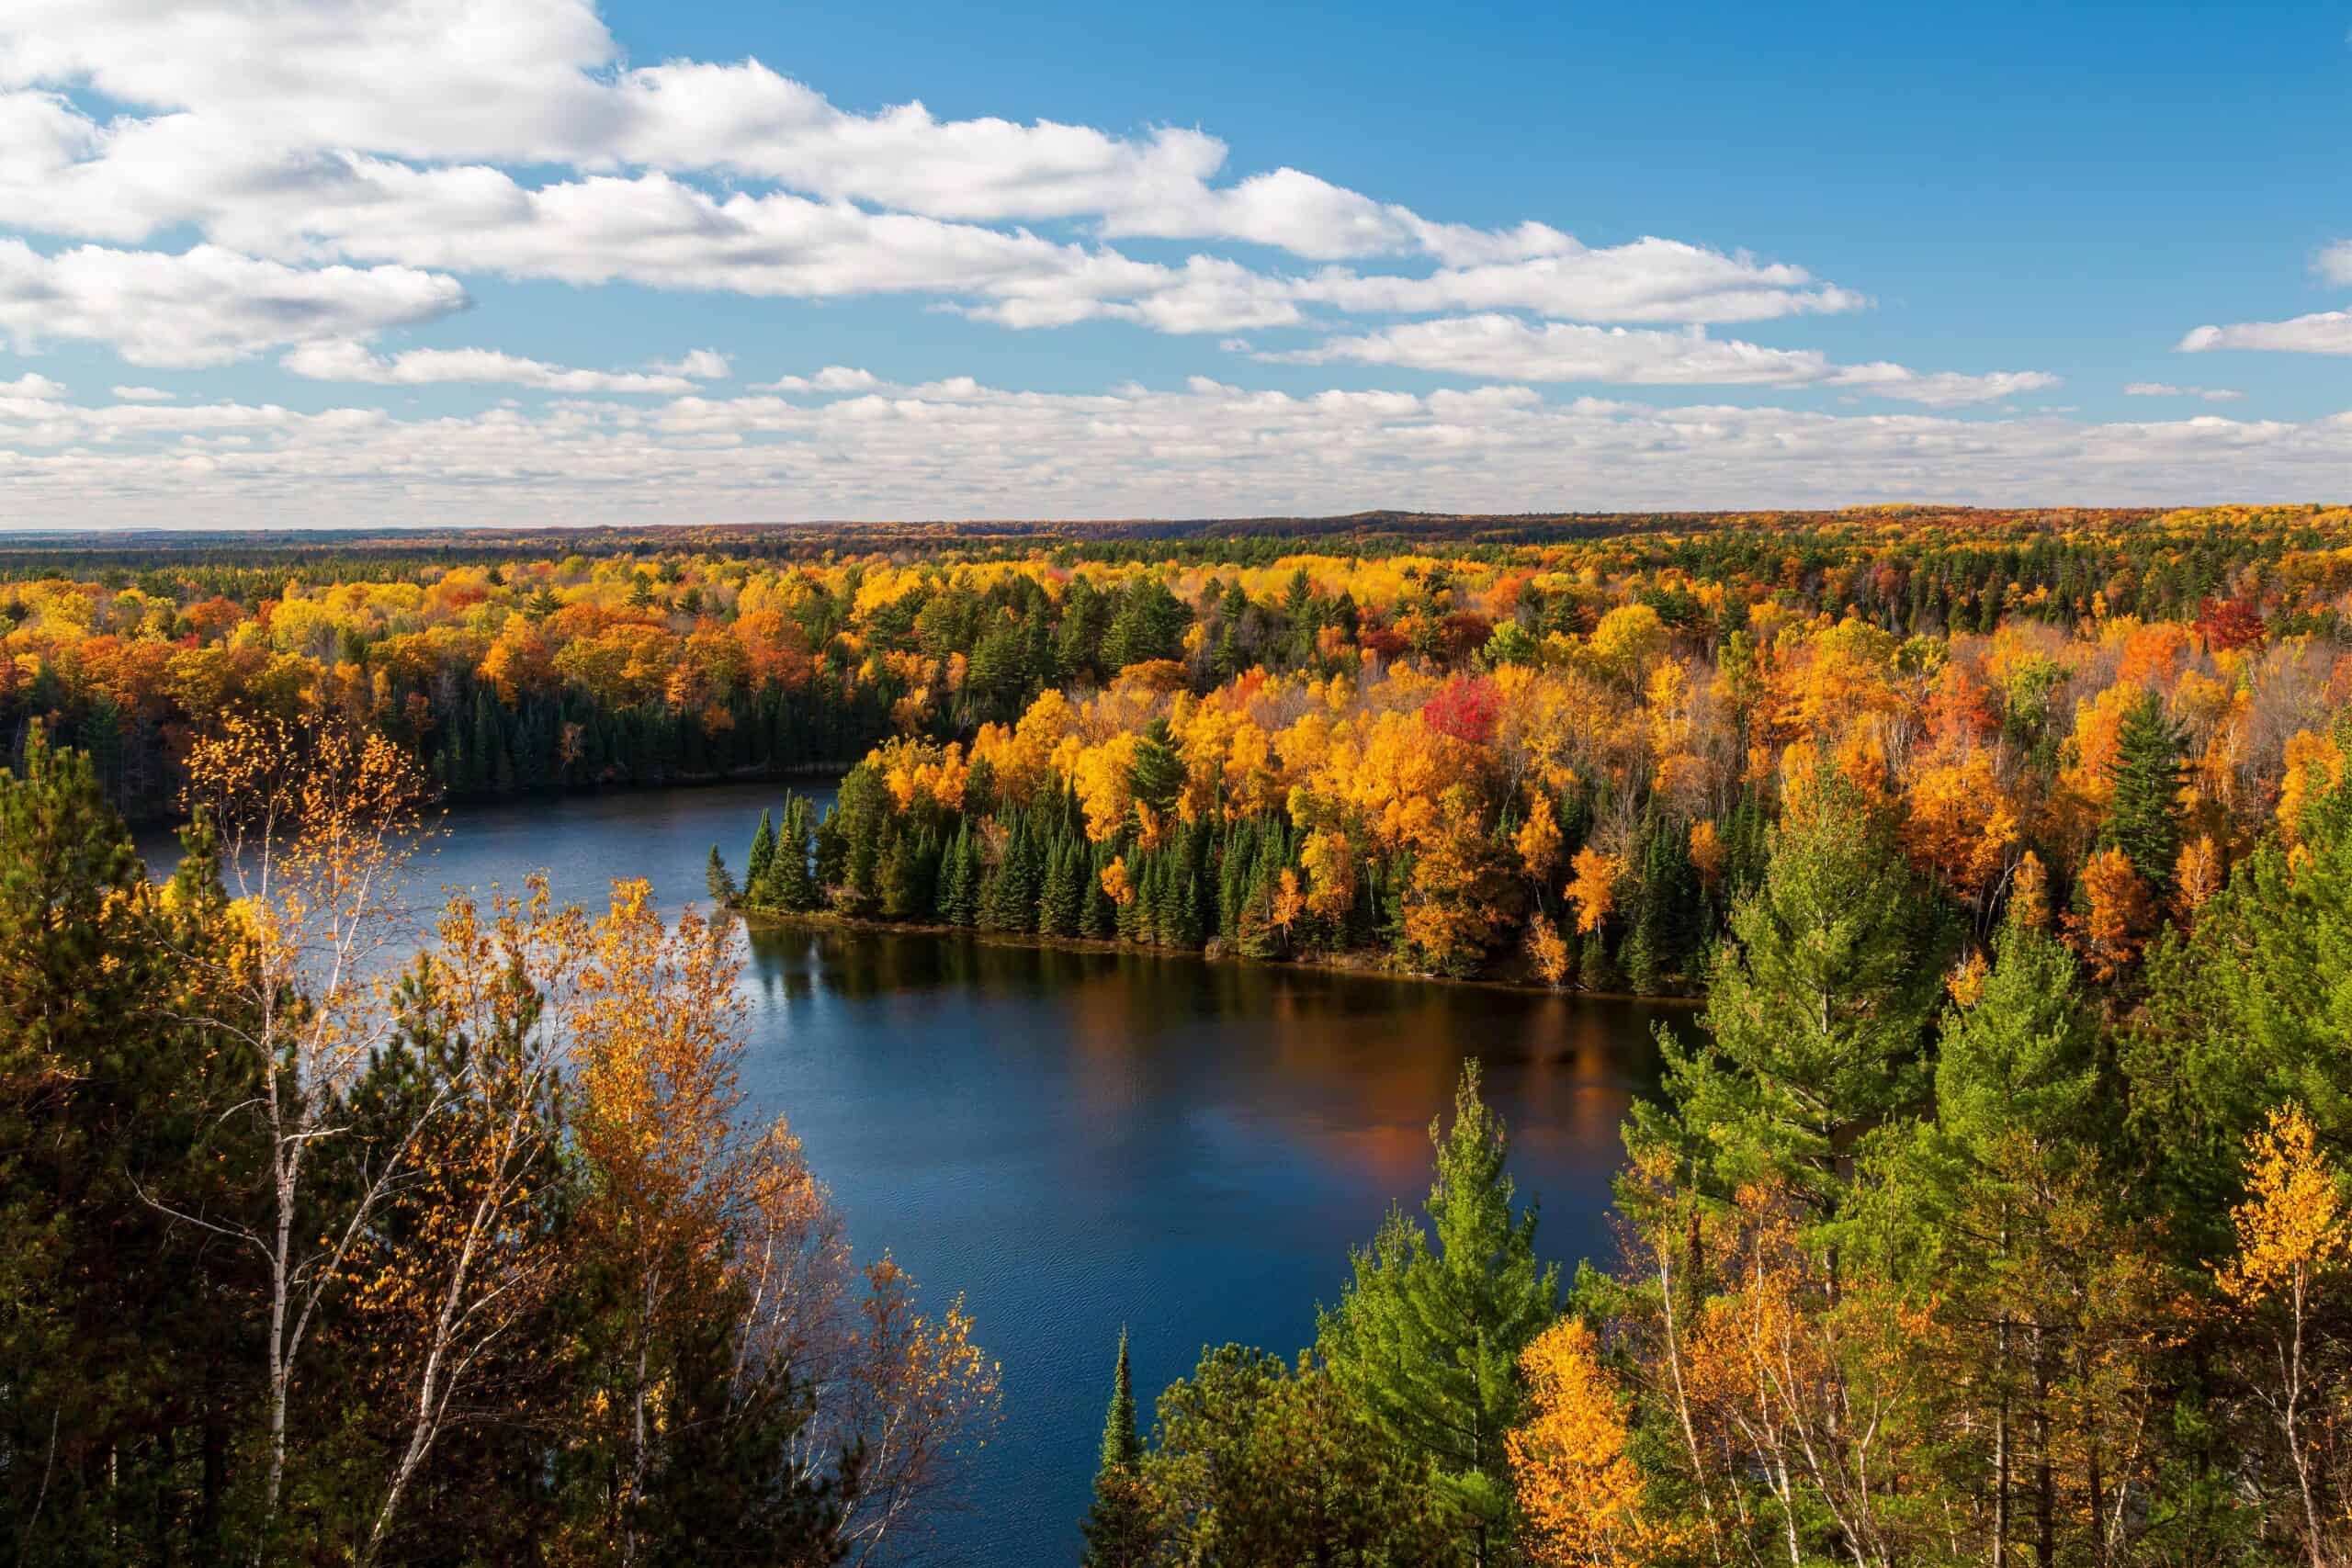
- Hunters in 2022: 63.0 per 1,000 people (634,627 hunters total)
- Total spending on hunting licenses in 2022: $36,266,860
- Deer harvested in 2022: 339,189 (60.0% buck; 40% antlerless)
- Deer harvest by weapon type: 31 % bow; 64 % rifle or shotgun; 5 % muzzleloader
28. Colorado
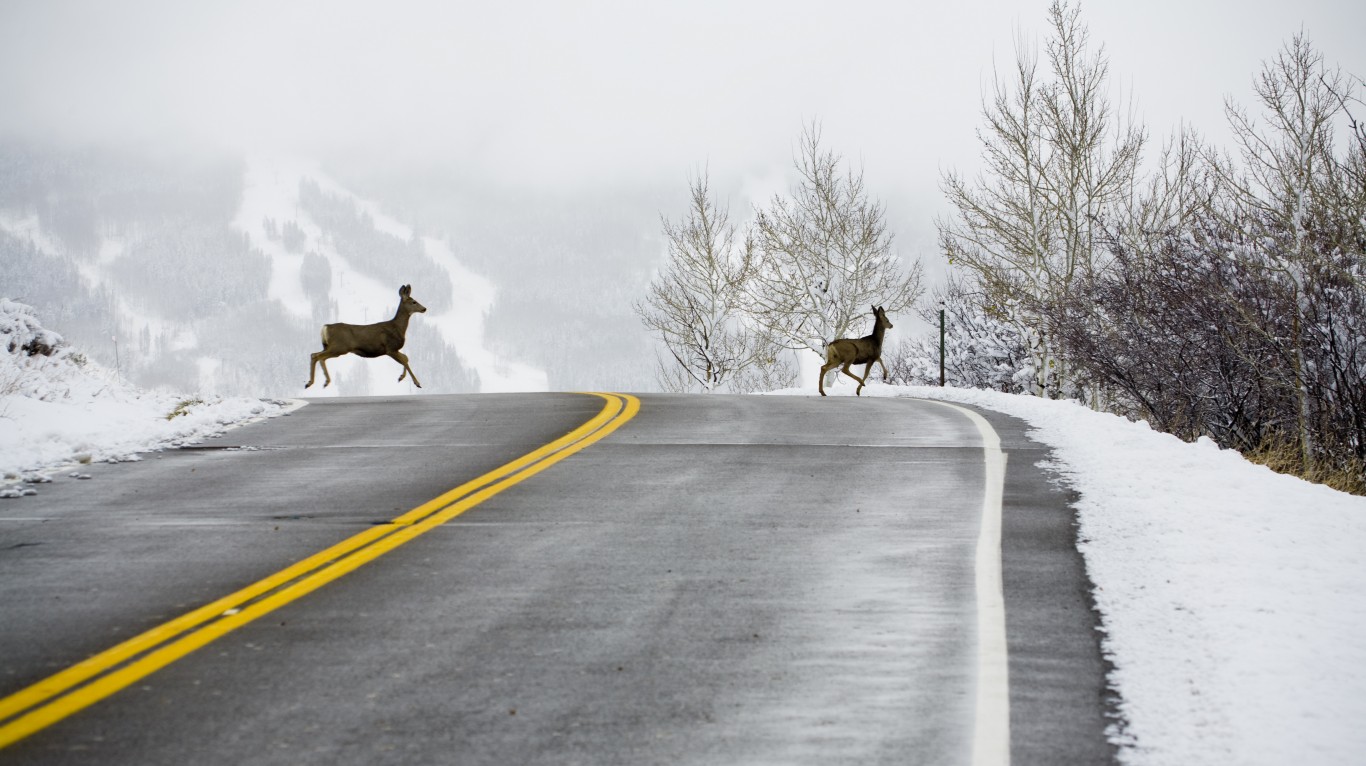
- Hunters in 2022: 67.0 per 1,000 people (393,066 hunters total)
- Total spending on hunting licenses in 2022: $86,063,990
- Deer harvested in 2022: 38,047 (77.0% buck; 23% antlerless)
- Deer harvest by weapon type: N/A
27. Iowa

- Hunters in 2022: 69.0 per 1,000 people (219,432 hunters total)
- Total spending on hunting licenses in 2022: $23,583,242
- Deer harvested in 2022: 109,600 (42.0% buck; 58% antlerless)
- Deer harvest by weapon type: 36 % bow; 52 % rifle or shotgun; 12 % muzzleloader
26. Kentucky
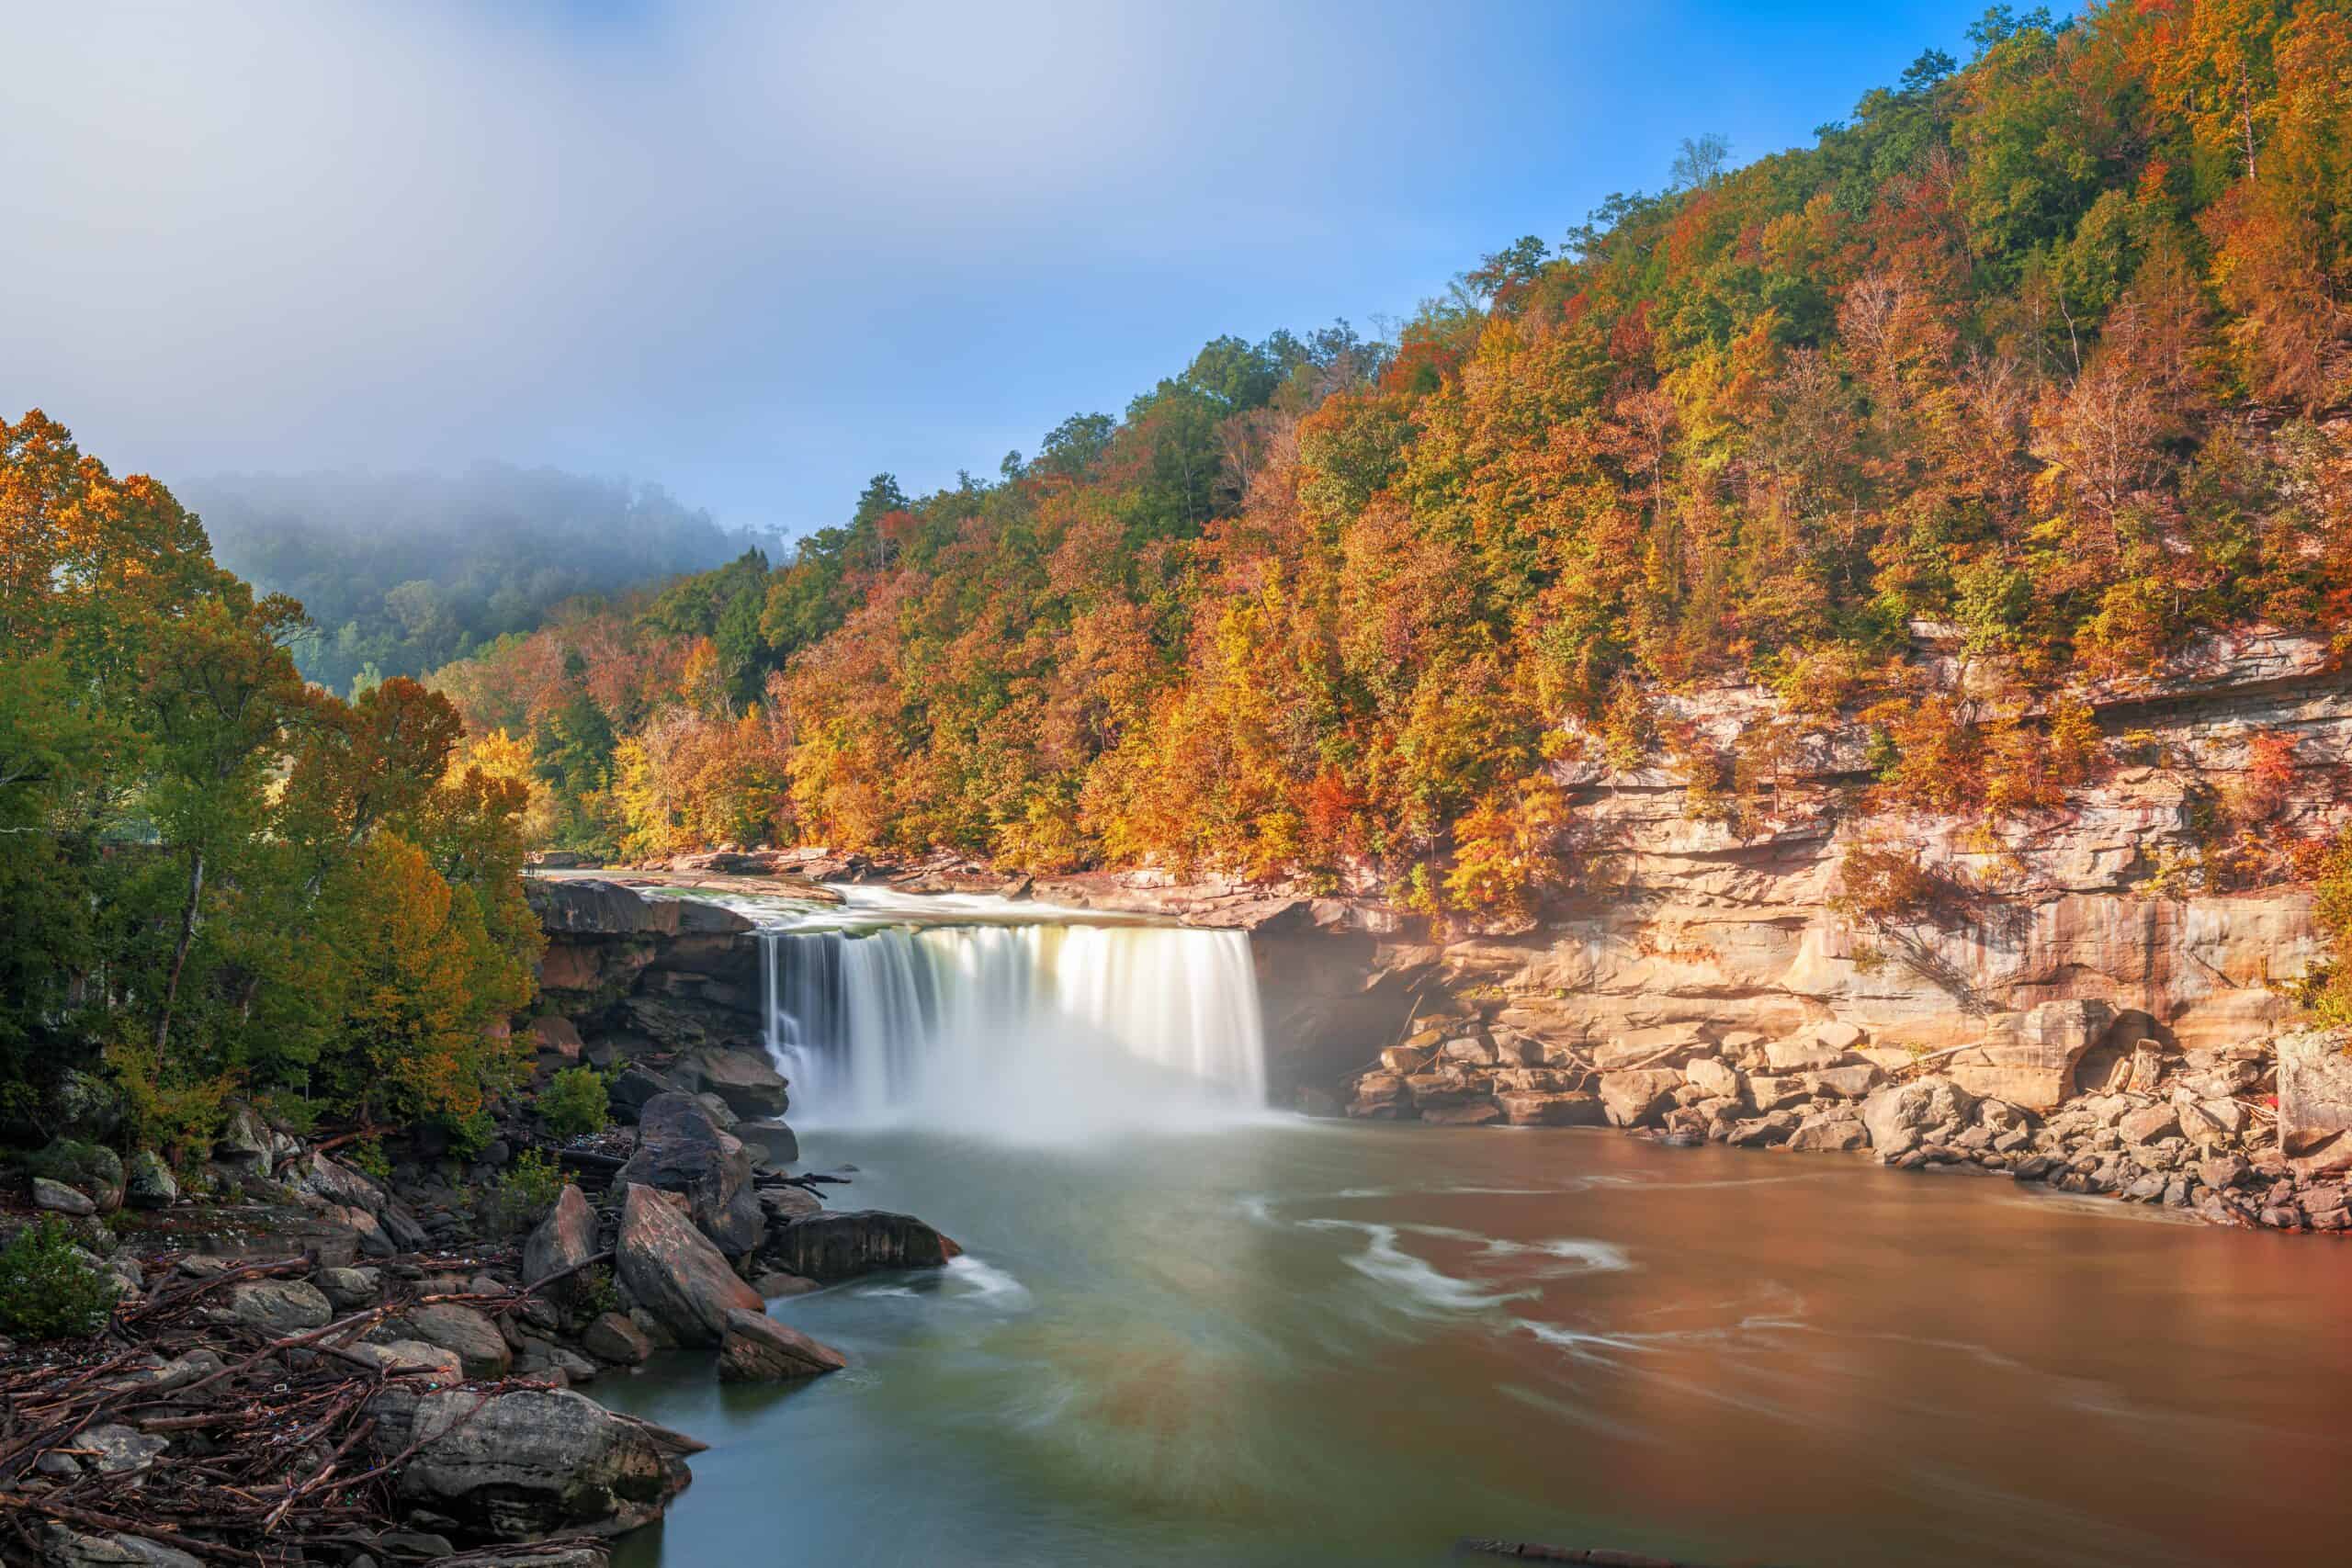
- Hunters in 2022: 71.0 per 1,000 people (318,869 hunters total)
- Total spending on hunting licenses in 2022: $24,284,725
- Deer harvested in 2022: 144,493 (49.0% buck; 51% antlerless)
- Deer harvest by weapon type: 20 % bow; 73 % rifle or shotgun; 7 % muzzleloader
25. Georgia
- Hunters in 2022: 75.0 per 1,000 people (819,893 hunters total)
- Total spending on hunting licenses in 2022: $20,520,877
- Deer harvested in 2022: 271,211 (35.0% buck; 65% antlerless)
- Deer harvest by weapon type: 18 % bow; 79 % rifle or shotgun; 3 % muzzleloader
24. Pennsylvania

- Hunters in 2022: 76.0 per 1,000 people (981,320 hunters total)
- Total spending on hunting licenses in 2022: $41,928,813
- Deer harvested in 2022: 422,960 (39.0% buck; 61% antlerless)
- Deer harvest by weapon type: 35 % bow; 59 % rifle or shotgun; 6 % muzzleloader
23. New Mexico
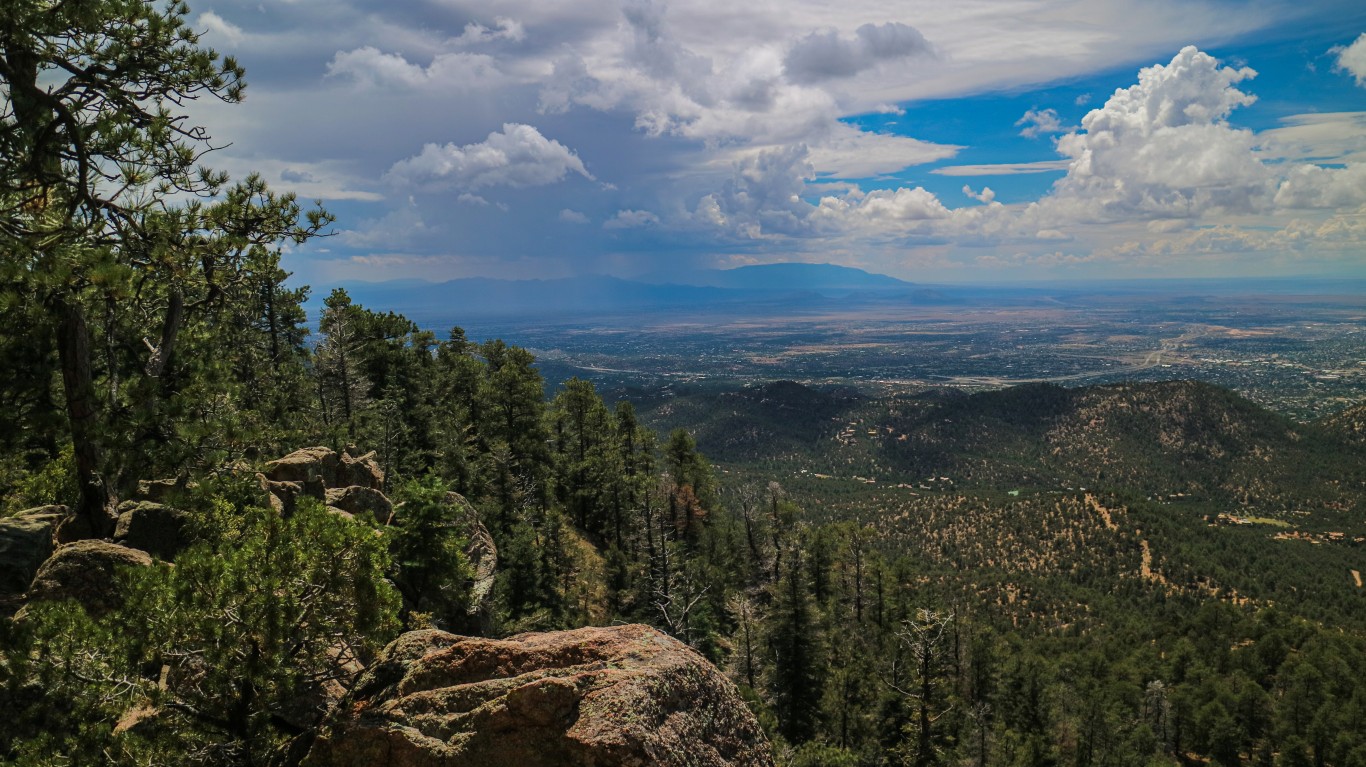
- Hunters in 2022: 76.0 per 1,000 people (160,322 hunters total)
- Total spending on hunting licenses in 2022: $21,260,065
- Deer harvested in 2022: 9,266 (98.0% buck; 02% antlerless)
- Deer harvest by weapon type: 15 % bow; 72 % rifle or shotgun; 13 % muzzleloader
22. Oregon

- Hunters in 2022: 79.0 per 1,000 people (333,196 hunters total)
- Total spending on hunting licenses in 2022: $30,446,022
- Deer harvested in 2022: 29,751 (90.0% buck; 10% antlerless)
- Deer harvest by weapon type: N/A
21. Utah
- Hunters in 2022: 79.0 per 1,000 people (267,238 hunters total)
- Total spending on hunting licenses in 2022: $22,966,859
- Deer harvested in 2022: 27,536 (93.0% buck; 07% antlerless)
- Deer harvest by weapon type: 10 % bow; 75 % rifle or shotgun; 15 % muzzleloader
20. Missouri
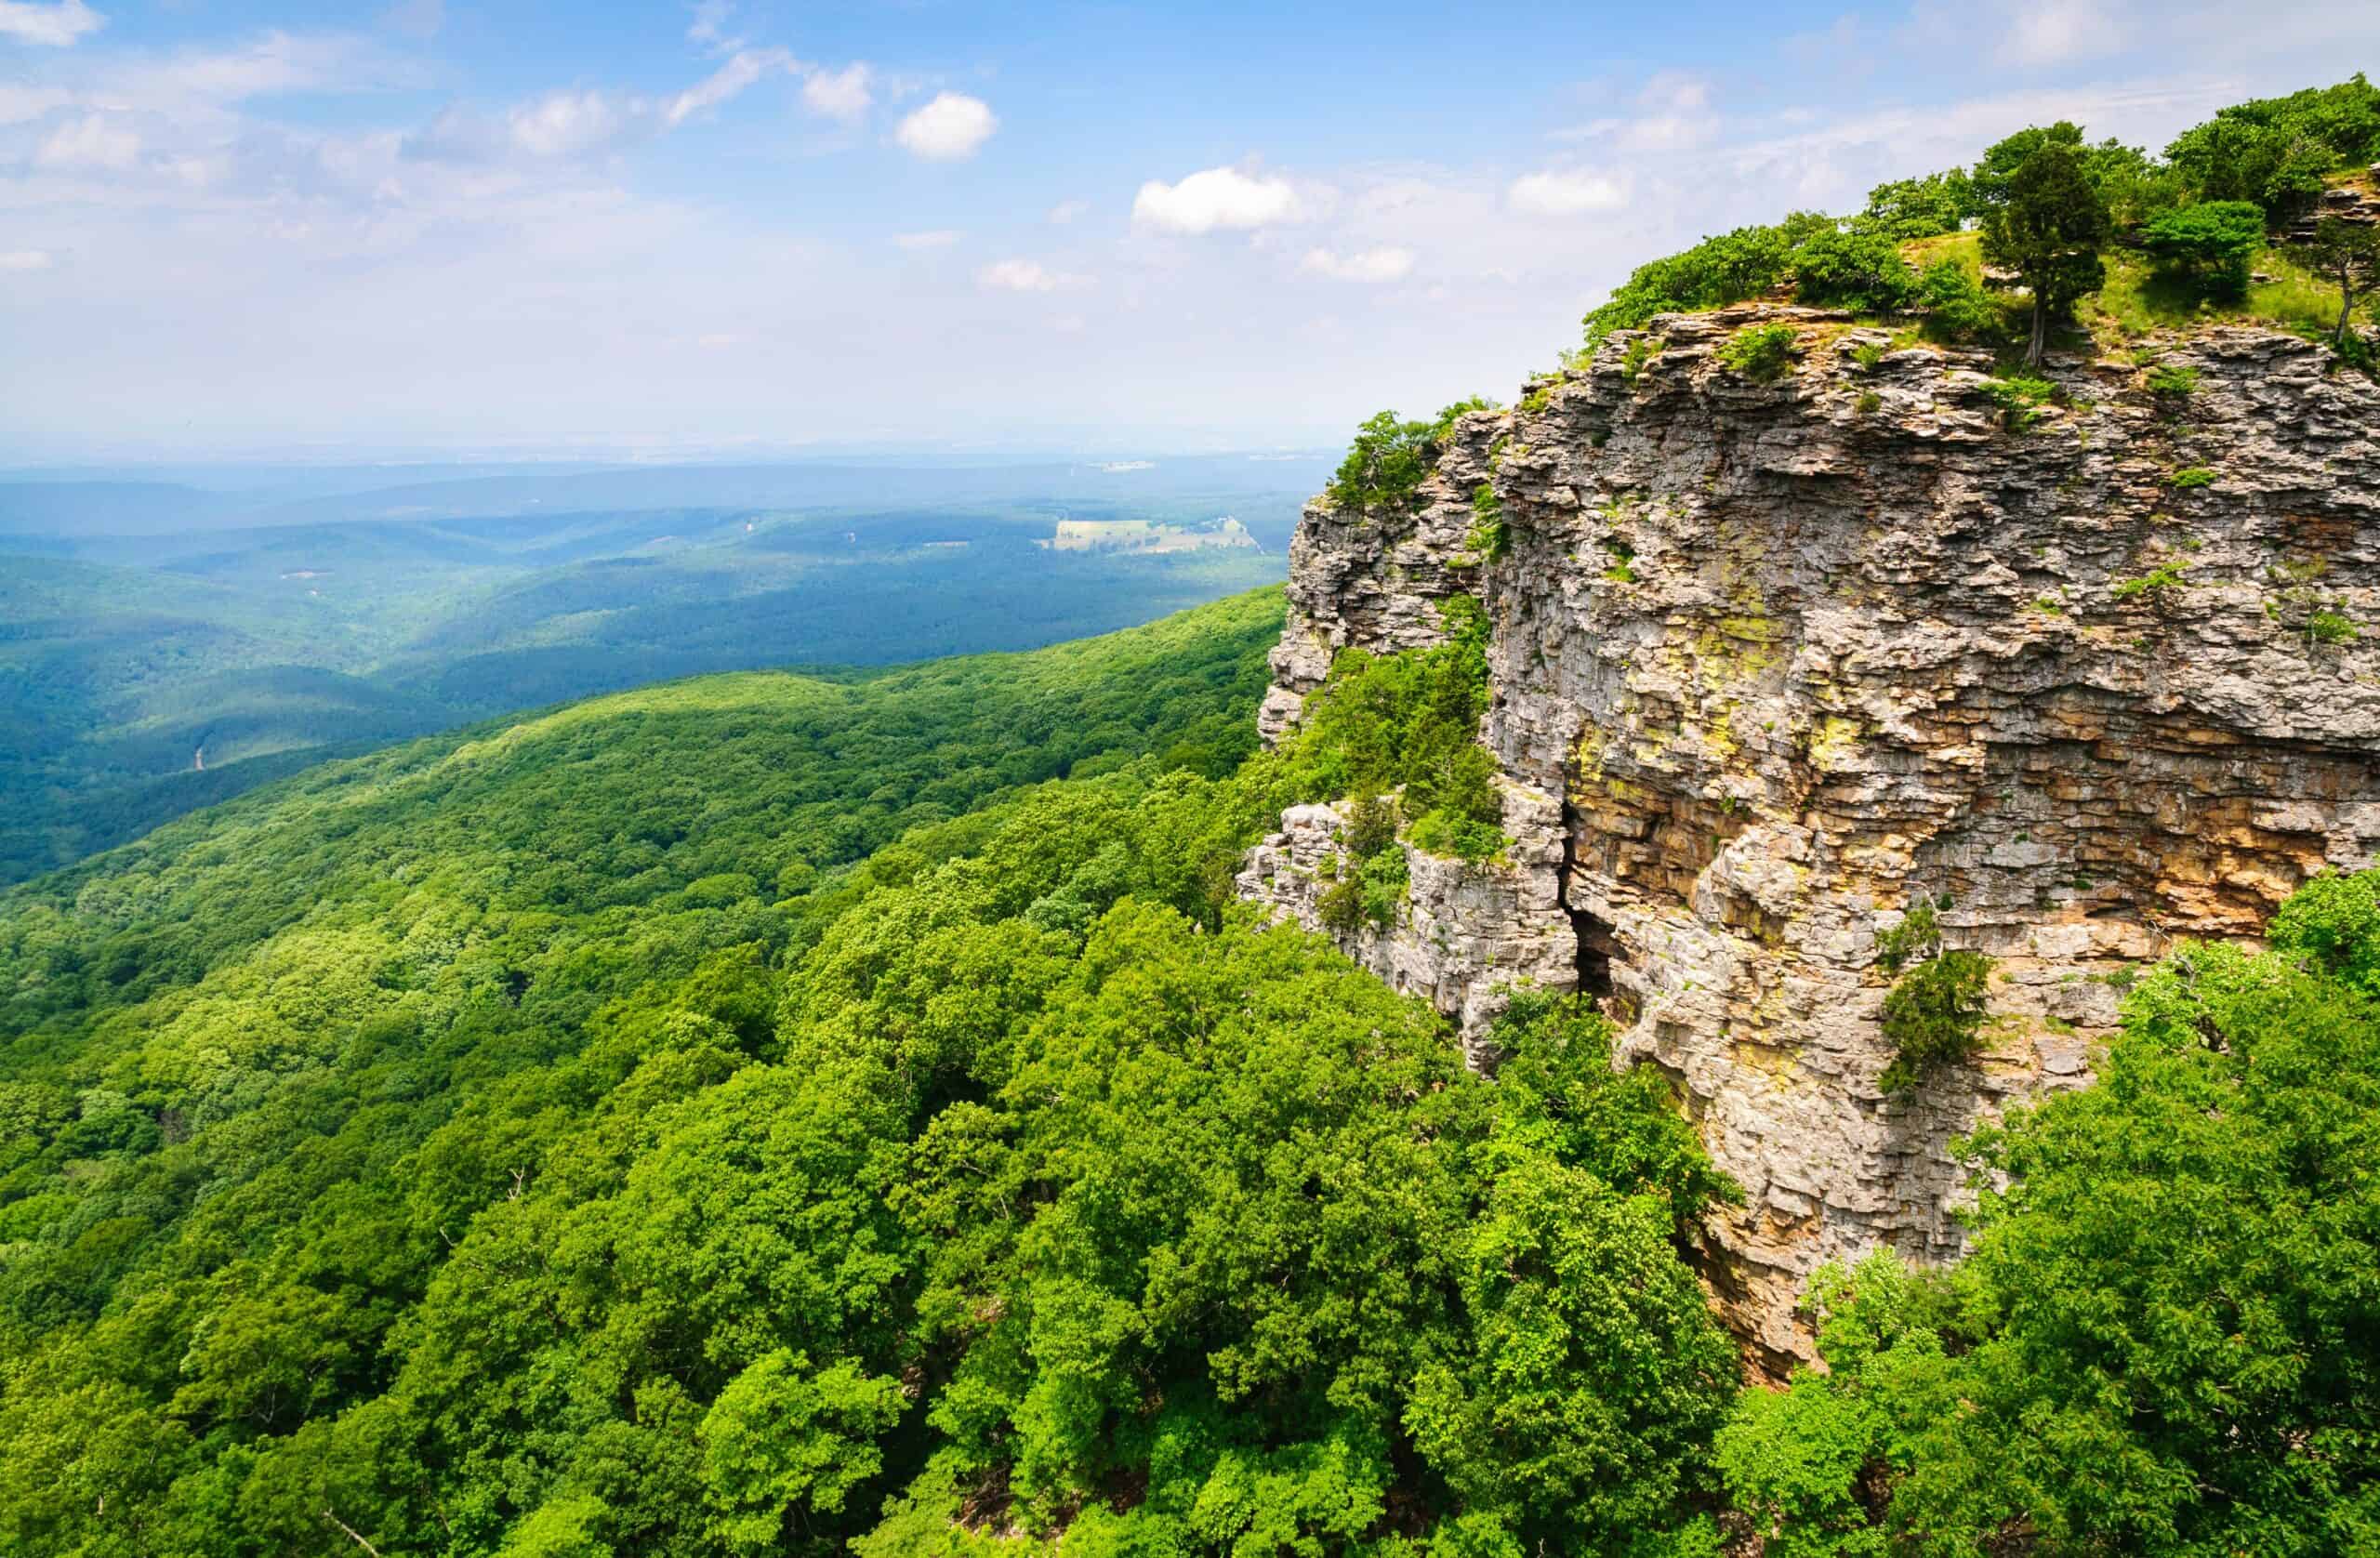
- Hunters in 2022: 83.0 per 1,000 people (509,942 hunters total)
- Total spending on hunting licenses in 2022: $27,642,938
- Deer harvested in 2022: 299,719 (47.0% buck; 53% antlerless)
- Deer harvest by weapon type: 19 % bow; 78 % rifle or shotgun; 3 % muzzleloader
19. Oklahoma

- Hunters in 2022: 93.0 per 1,000 people (372,663 hunters total)
- Total spending on hunting licenses in 2022: $11,890,007
- Deer harvested in 2022: 134,158 (55.0% buck; 45% antlerless)
- Deer harvest by weapon type: 31 % bow; 60 % rifle or shotgun; 9 % muzzleloader
18. Mississippi
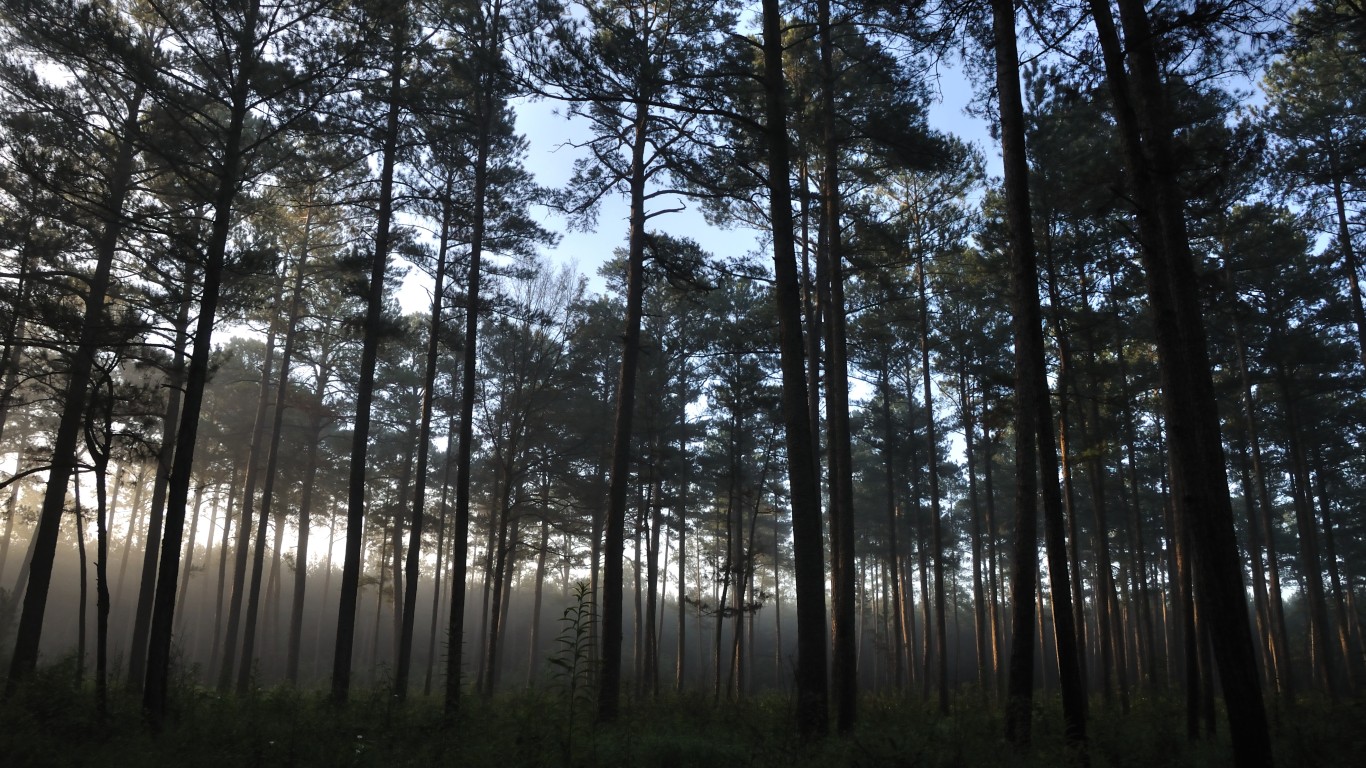
- Hunters in 2022: 93.0 per 1,000 people (274,879 hunters total)
- Total spending on hunting licenses in 2022: $14,256,834
- Deer harvested in 2022: 262,830 (45.0% buck; 55% antlerless)
- Deer harvest by weapon type: 19 % bow; 81 % rifle or shotgun; N/A % muzzleloader
17. Vermont

- Hunters in 2022: 94.0 per 1,000 people (60,719 hunters total)
- Total spending on hunting licenses in 2022: $4,363,071
- Deer harvested in 2022: 17,461 (55.0% buck; 45% antlerless)
- Deer harvest by weapon type: 34 % bow; 48 % rifle or shotgun; 18 % muzzleloader
16. Kansas
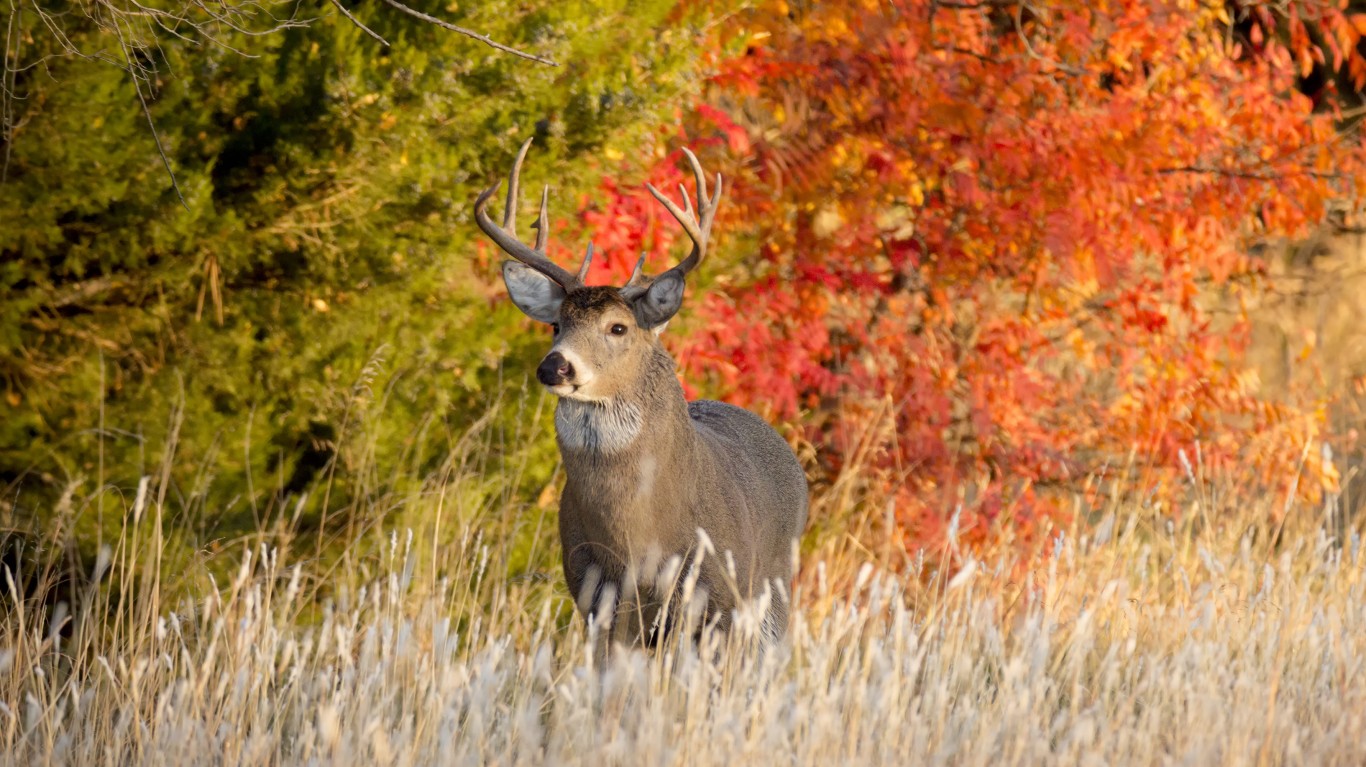
- Hunters in 2022: 94.0 per 1,000 people (277,050 hunters total)
- Total spending on hunting licenses in 2022: $25,959,756
- Deer harvested in 2022: 80,815 (52.0% buck; 48% antlerless)
- Deer harvest by weapon type: 40 % bow; 56 % rifle or shotgun; 4 % muzzleloader
15. Louisiana

- Hunters in 2022: 94.0 per 1,000 people (433,219 hunters total)
- Total spending on hunting licenses in 2022: $12,160,565
- Deer harvested in 2022: 217,700 (56.0% buck; 44% antlerless)
- Deer harvest by weapon type: 9 % bow; 79 % rifle or shotgun; 12 % muzzleloader
14. Minnesota
- Hunters in 2022: 95.0 per 1,000 people (542,085 hunters total)
- Total spending on hunting licenses in 2022: $33,620,104
- Deer harvested in 2022: 172,265 (51.0% buck; 49% antlerless)
- Deer harvest by weapon type: 14 % bow; 80 % rifle or shotgun; 6 % muzzleloader
13. Alabama
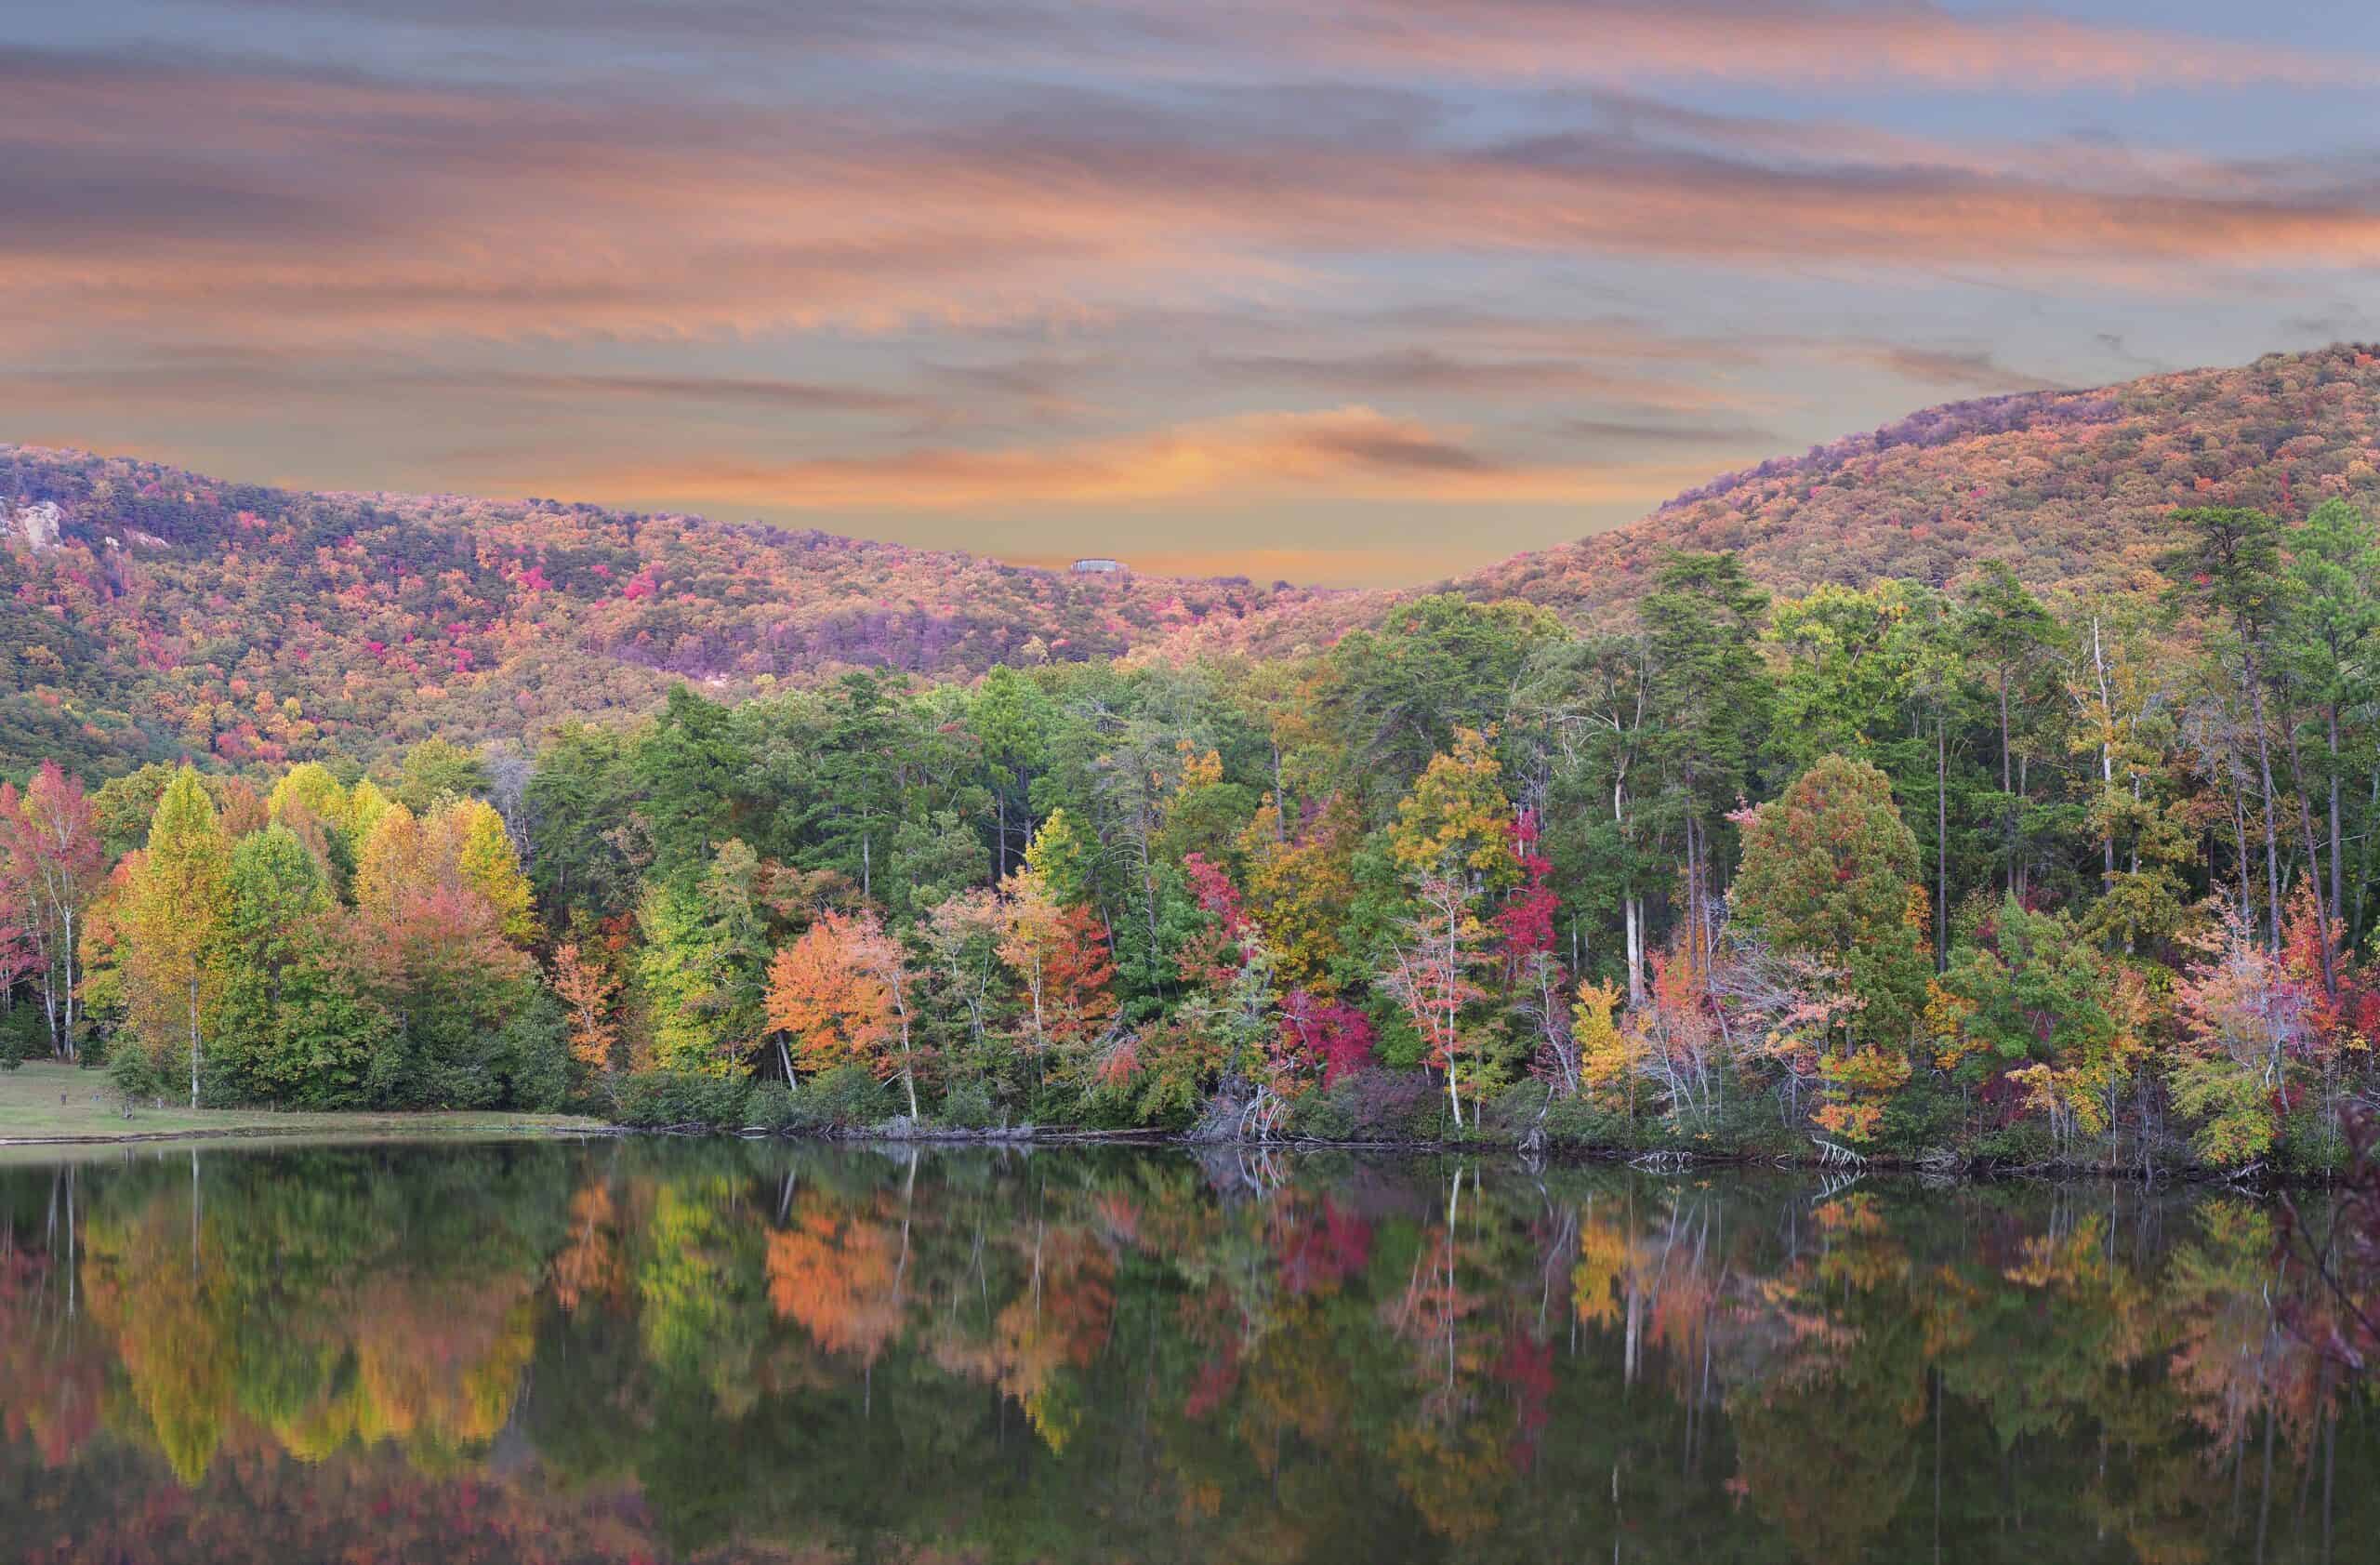
- Hunters in 2022: 96.0 per 1,000 people (486,674 hunters total)
- Total spending on hunting licenses in 2022: $23,912,194
- Deer harvested in 2022: 308,729 (45.0% buck; 55% antlerless)
- Deer harvest by weapon type: 22 % bow; 75 % rifle or shotgun; 3 % muzzleloader
12. Wisconsin
- Hunters in 2022: 113.0 per 1,000 people (664,738 hunters total)
- Total spending on hunting licenses in 2022: $36,478,110
- Deer harvested in 2022: 340,282 (48.0% buck; 52% antlerless)
- Deer harvest by weapon type: 29 % bow; 69 % rifle or shotgun; 2 % muzzleloader
11. Arkansas
- Hunters in 2022: 114.0 per 1,000 people (347,418 hunters total)
- Total spending on hunting licenses in 2022: $20,192,534
- Deer harvested in 2022: 185,579 (48.0% buck; 52% antlerless)
- Deer harvest by weapon type: 15 % bow; 75 % rifle or shotgun; 9 % muzzleloader
10. Tennessee
- Hunters in 2022: 120.0 per 1,000 people (844,172 hunters total)
- Total spending on hunting licenses in 2022: $42,874,058
- Deer harvested in 2022: 163,244 (53.0% buck; 47% antlerless)
- Deer harvest by weapon type: 13 % bow; 72 % rifle or shotgun; 15 % muzzleloader
9. Nebraska
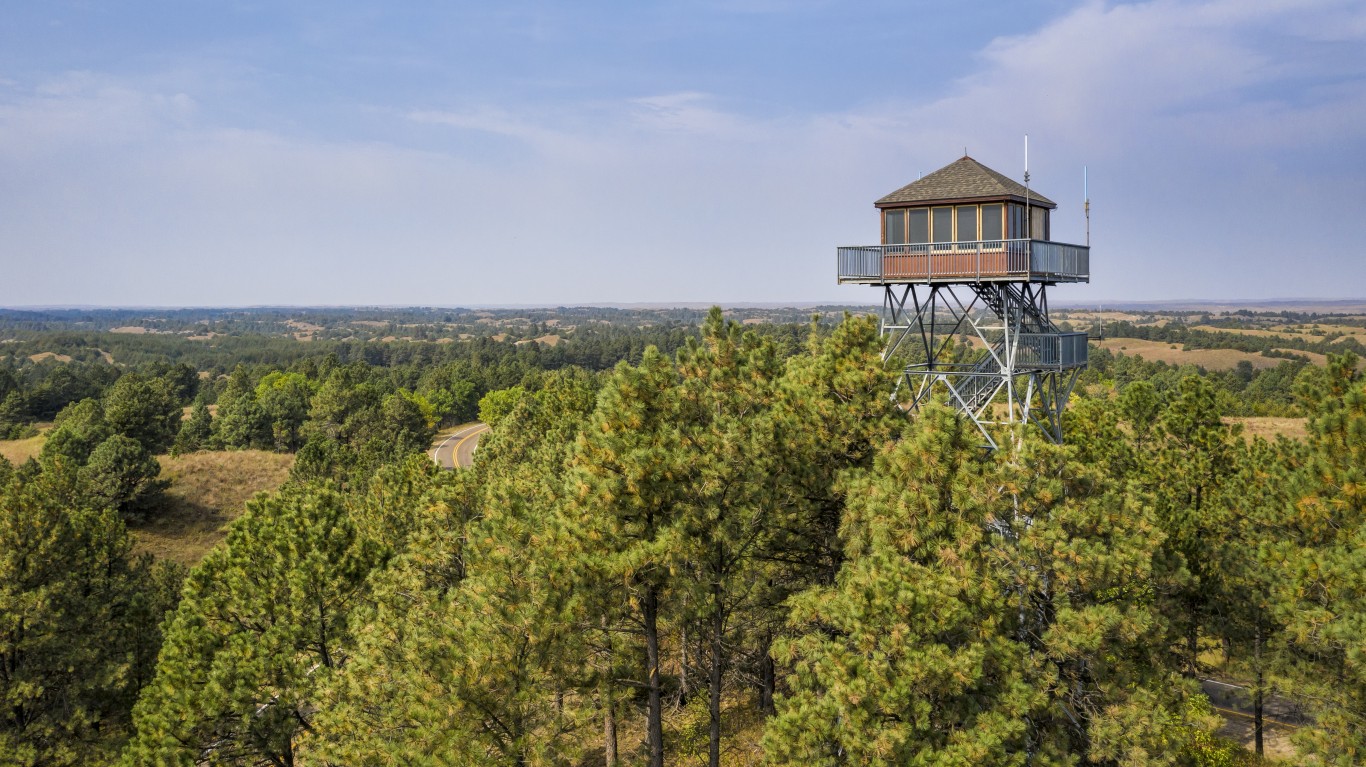
- Hunters in 2022: 123.0 per 1,000 people (241,271 hunters total)
- Total spending on hunting licenses in 2022: $19,622,327
- Deer harvested in 2022: 40,289 (58.0% buck; 42% antlerless)
- Deer harvest by weapon type: 12 % bow; 82 % rifle or shotgun; 6 % muzzleloader
8. Alaska

- Hunters in 2022: 128.0 per 1,000 people (94,142 hunters total)
- Total spending on hunting licenses in 2022: $17,385,564
- Deer harvested in 2022: N/A
- Deer harvest by weapon type: N/A
7. West Virginia

- Hunters in 2022: 149.0 per 1,000 people (265,103 hunters total)
- Total spending on hunting licenses in 2022: $9,348,550
- Deer harvested in 2022: 118,499 (60.0% buck; 40% antlerless)
- Deer harvest by weapon type: 28 % bow; 67 % rifle or shotgun; 5 % muzzleloader
6. Idaho
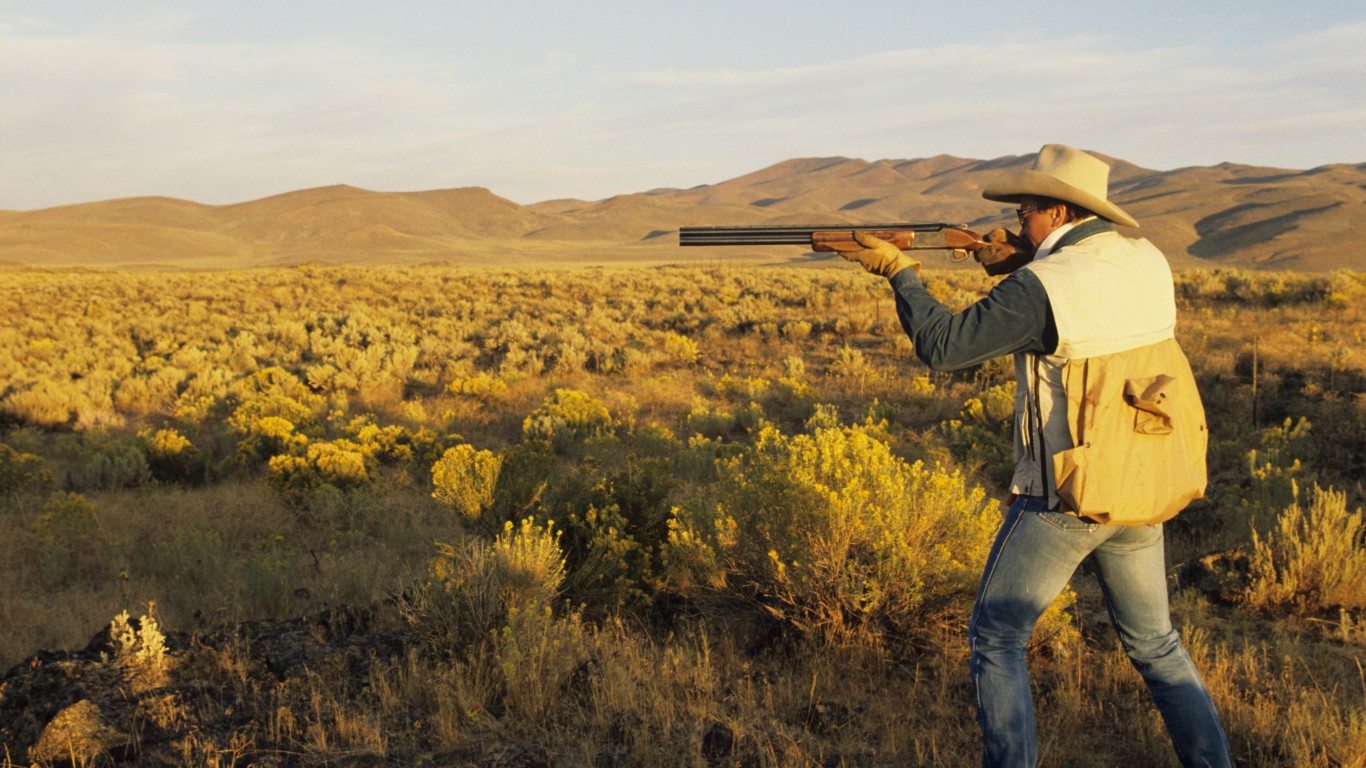
- Hunters in 2022: 150.0 per 1,000 people (290,834 hunters total)
- Total spending on hunting licenses in 2022: $39,068,857
- Deer harvested in 2022: 42,770 (76.0% buck; 24% antlerless)
- Deer harvest by weapon type: 6 % bow; 92 % rifle or shotgun; 2 % muzzleloader
5. Maine

- Hunters in 2022: 154.0 per 1,000 people (213,686 hunters total)
- Total spending on hunting licenses in 2022: $8,772,248
- Deer harvested in 2022: 43,787 (54.0% buck; 46% antlerless)
- Deer harvest by weapon type: 11 % bow; 85 % rifle or shotgun; 4 % muzzleloader
4. North Dakota

- Hunters in 2022: 190.0 per 1,000 people (148,101 hunters total)
- Total spending on hunting licenses in 2022: $12,277,513
- Deer harvested in 2022: 30,031 (58.0% buck; 42% antlerless)
- Deer harvest by weapon type: 21 % bow; 77 % rifle or shotgun; 2 % muzzleloader
3. Montana
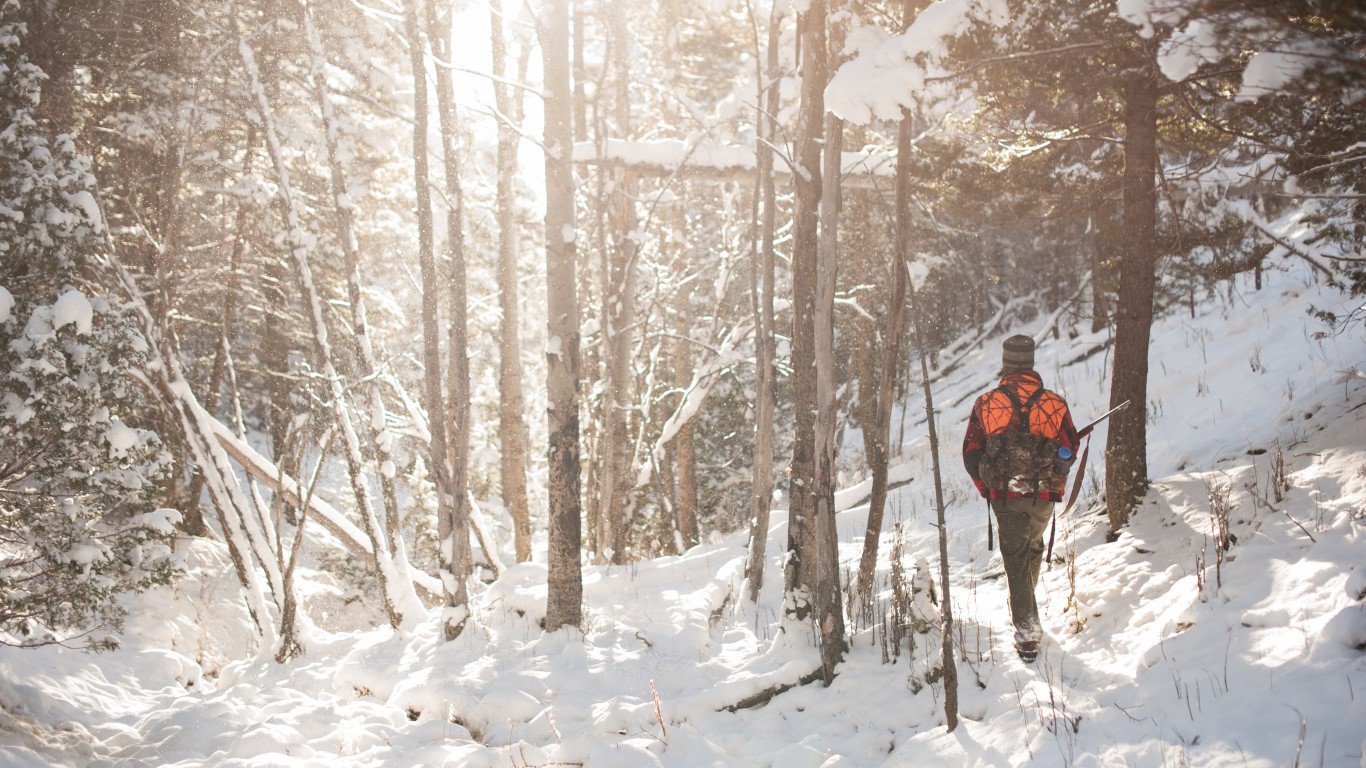
- Hunters in 2022: 211.0 per 1,000 people (237,312 hunters total)
- Total spending on hunting licenses in 2022: $42,969,973
- Deer harvested in 2022: 45,369 (59.0% buck; 41% antlerless)
- Deer harvest by weapon type: 6 % bow; 93 % rifle or shotgun; 1 % muzzleloader
2. Wyoming

- Hunters in 2022: 227.0 per 1,000 people (132,185 hunters total)
- Total spending on hunting licenses in 2022: $34,542,006
- Deer harvested in 2022: 29,315 (74.0% buck; 26% antlerless)
- Deer harvest by weapon type: 6 % bow; 94 % rifle or shotgun; – 0 % muzzleloader
1. South Dakota
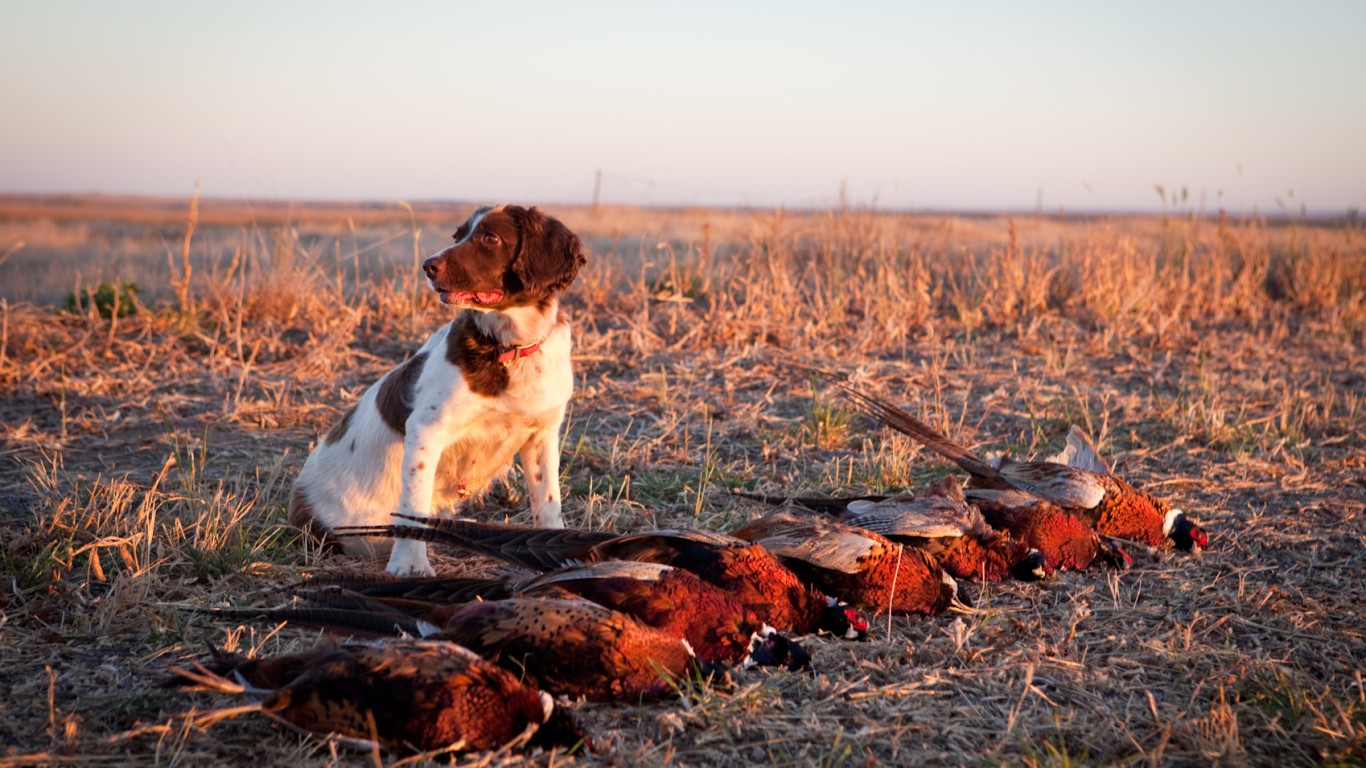
- Hunters in 2022: 250.0 per 1,000 people (227,312 hunters total)
- Total spending on hunting licenses in 2022: $23,760,897
- Deer harvested in 2022: 55,380 (62.0% buck; 38% antlerless)
- Deer harvest by weapon type: 16 % bow; 82 % rifle or shotgun; 2 % muzzleloader
Is Your Money Earning the Best Possible Rate? (Sponsor)
Let’s face it: If your money is just sitting in a checking account, you’re losing value every single day. With most checking accounts offering little to no interest, the cash you worked so hard to save is gradually being eroded by inflation.
However, by moving that money into a high-yield savings account, you can put your cash to work, growing steadily with little to no effort on your part. In just a few clicks, you can set up a high-yield savings account and start earning interest immediately.
There are plenty of reputable banks and online platforms that offer competitive rates, and many of them come with zero fees and no minimum balance requirements. Click here to see if you’re earning the best possible rate on your money!
Thank you for reading! Have some feedback for us?
Contact the 24/7 Wall St. editorial team.
