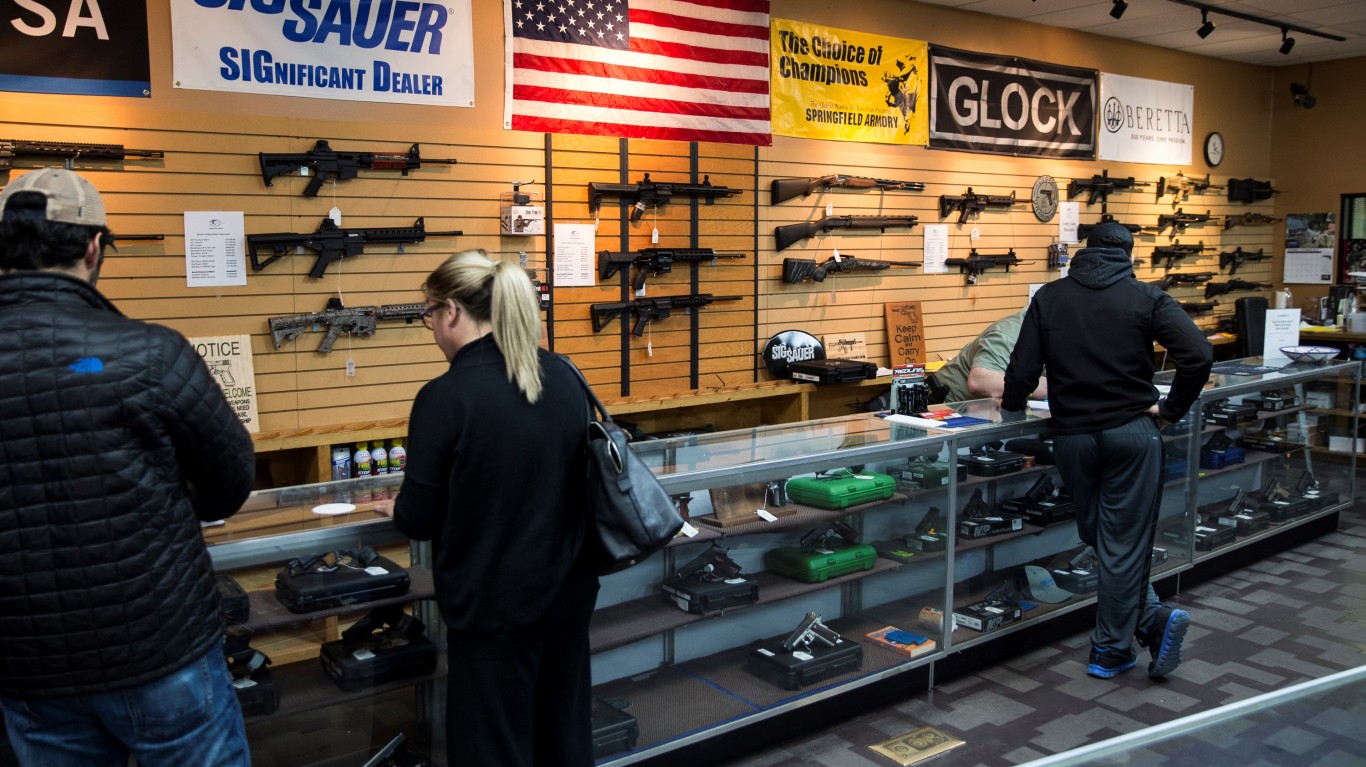
The United States has been the only country in the world with more guns than people for more than a decade. According to the latest estimates from the World Bank and the Small Arms Survey, a Swiss-based independent research organization, the U.S. is home to 45% of the world’s civilian-owned firearms and less than 5% of the global population.
Despite the number of guns already in circulation in the U.S. — as many as 494 million, according to some estimates — consumer demand for firearms remains strong. A recent report from the National Shooting Sports Foundation found that America’s arms and ammunition industry generated over $90 billion in 2023 alone, roughly equal to the total economic output of countries like Bulgaria and Luxembourg.
While the right to gun ownership has been enshrined in the U.S. Constitution for over 230 years, American gun culture is not static. Historical data from the Bureau of Alcohol, Tobacco, Firearms, and Explosives shows the domestic market for guns has undergone some meaningful changes in recent decades.
Using historical firearm production, import, and export data from the ATF, 24/7 Wall St. calculated the number of guns Americans have bought in each of the last 35 years. For every year between 1986 and 2020, we tallied the number of firearms manufactured in, and imported to, the U.S., and subtracted the number of firearms that were exported to foreign markets. Import data is not yet available for 2021 or 2022, and as a result, numbers for these years only reflect estimated domestic sales of American-made firearms.
The most striking trend in the last 35 years is the recent surge in gun sales. In the last five years alone, Americans bought nearly 70 million firearms — 13 million more than in the entire first decade of the 2000’s, and 17 million more than in the 1990’s.
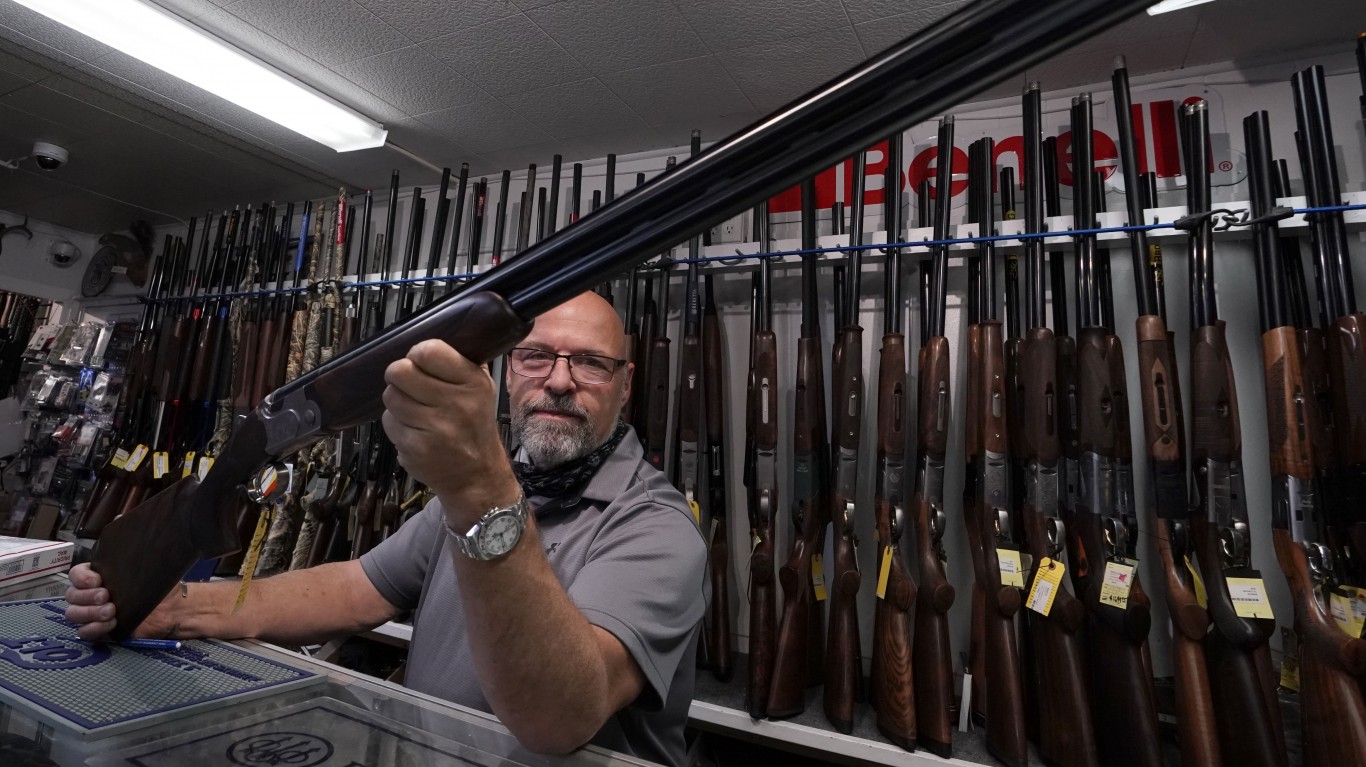
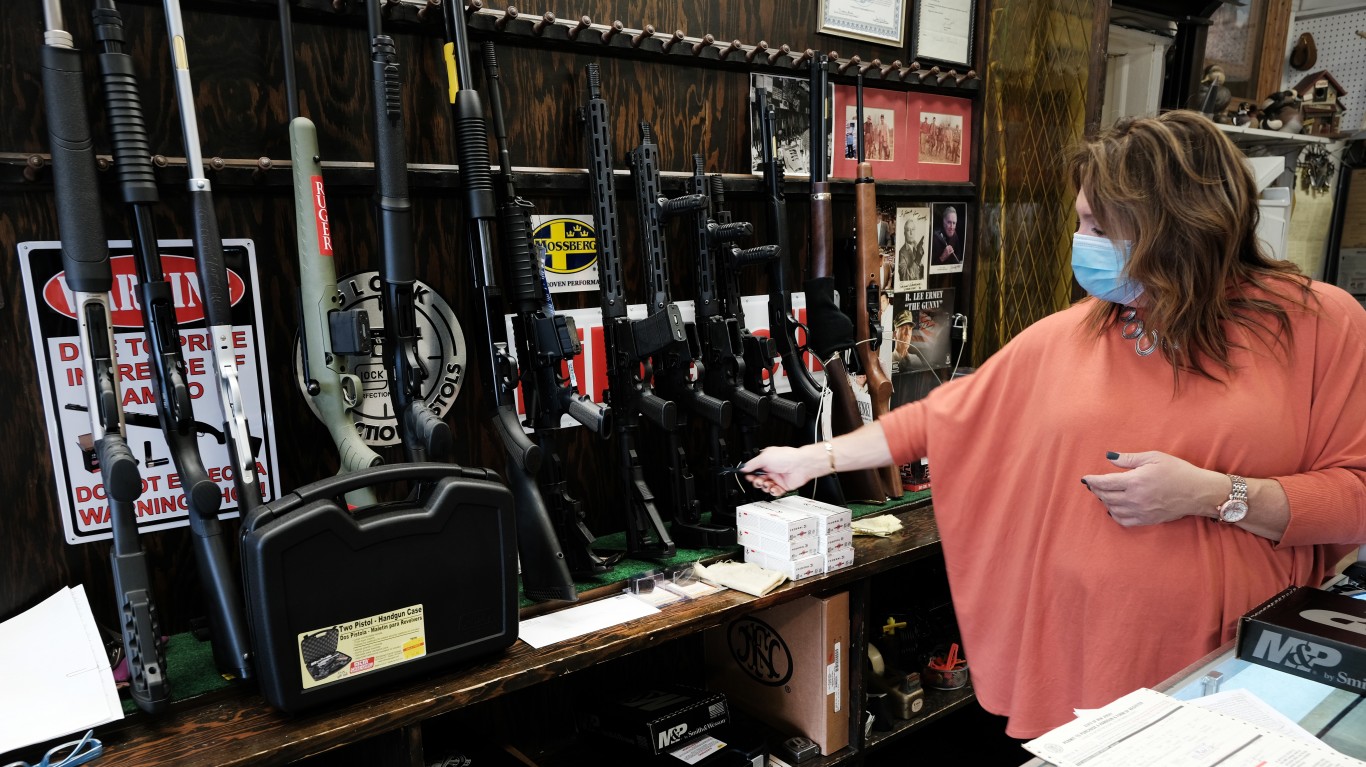
Increased sales volume appears to have been driven, at least in part, by changing attitudes towards guns. In a series of surveys that spanned decades, the Pew Research Center asked American gun owners why they choose to keep a firearm. In 1999, 49% cited hunting, and only 26% cited protection. By 2023, however, 72% cited protection, compared to only 32% who cited hunting.
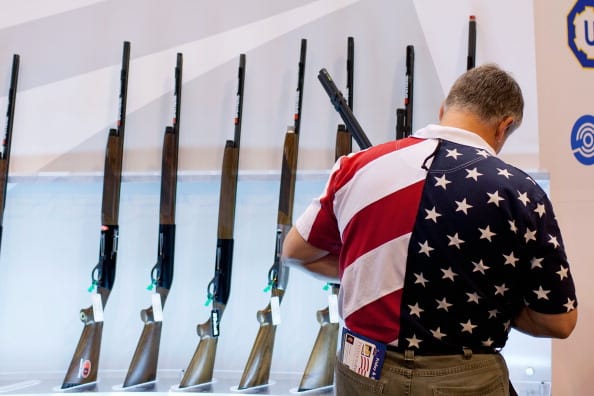
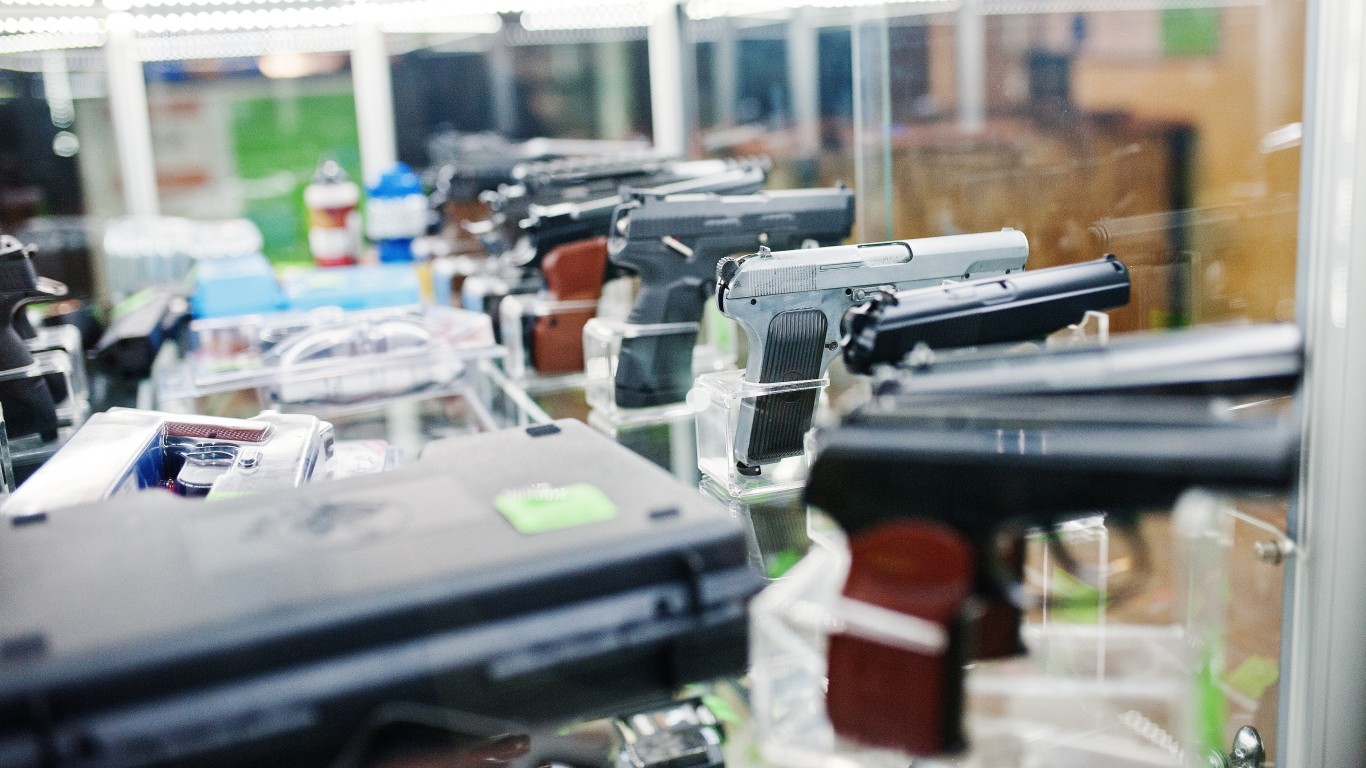
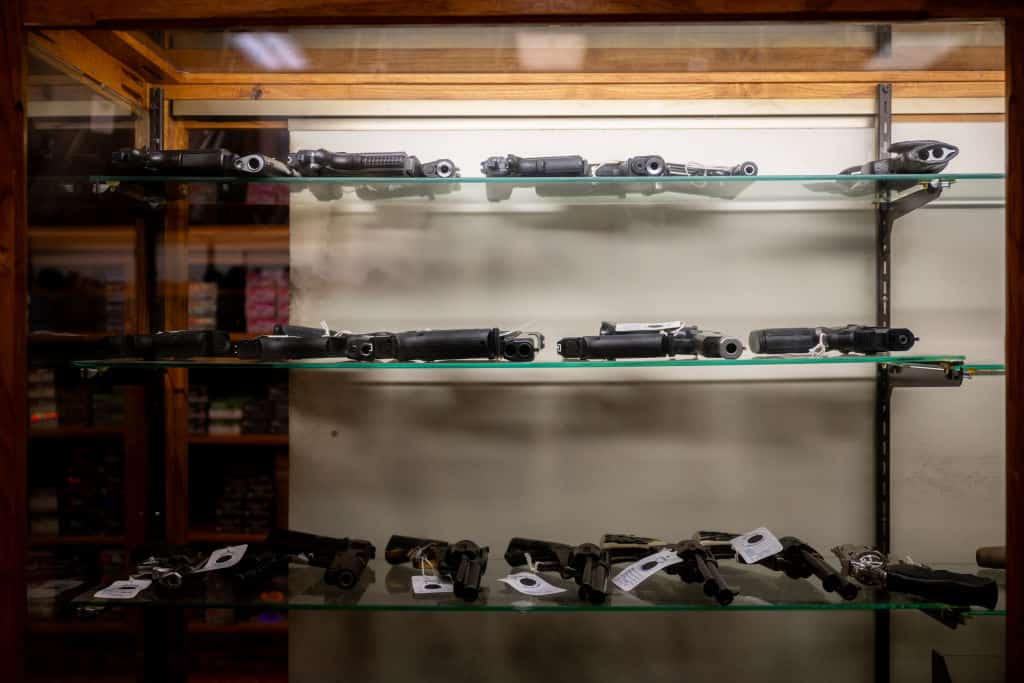
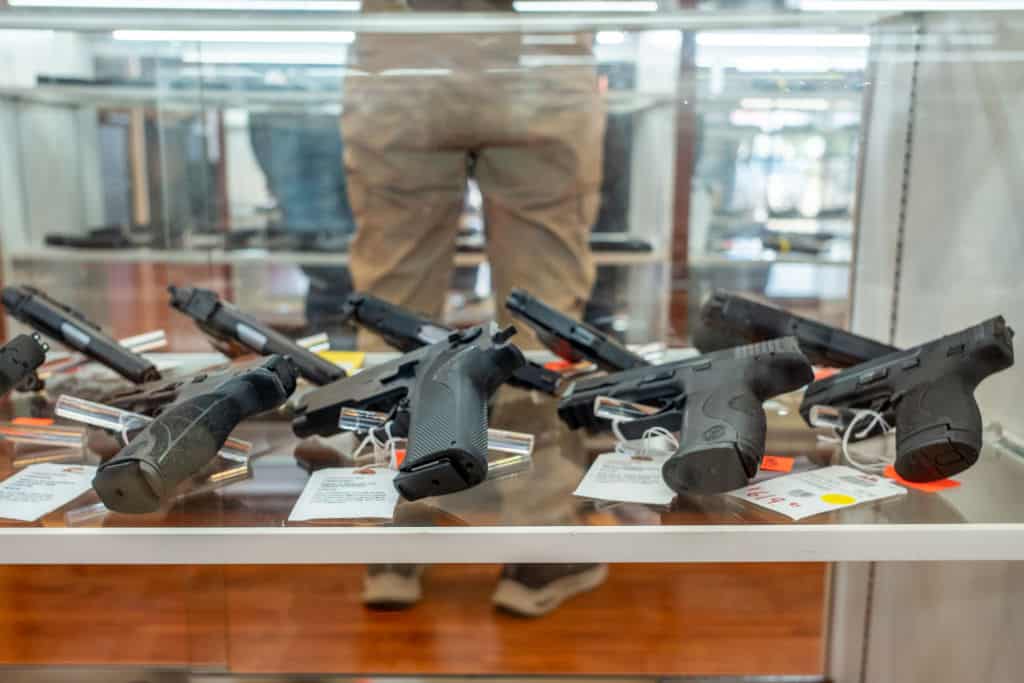
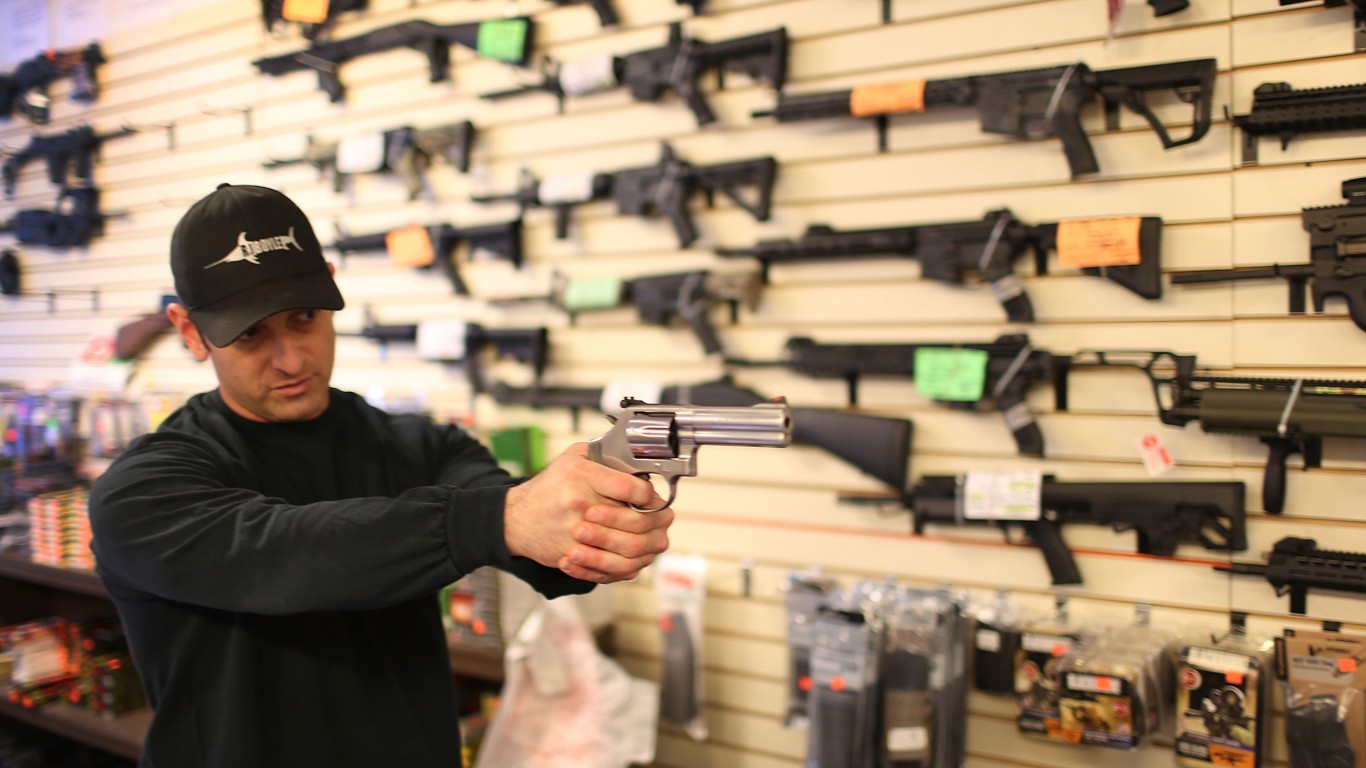
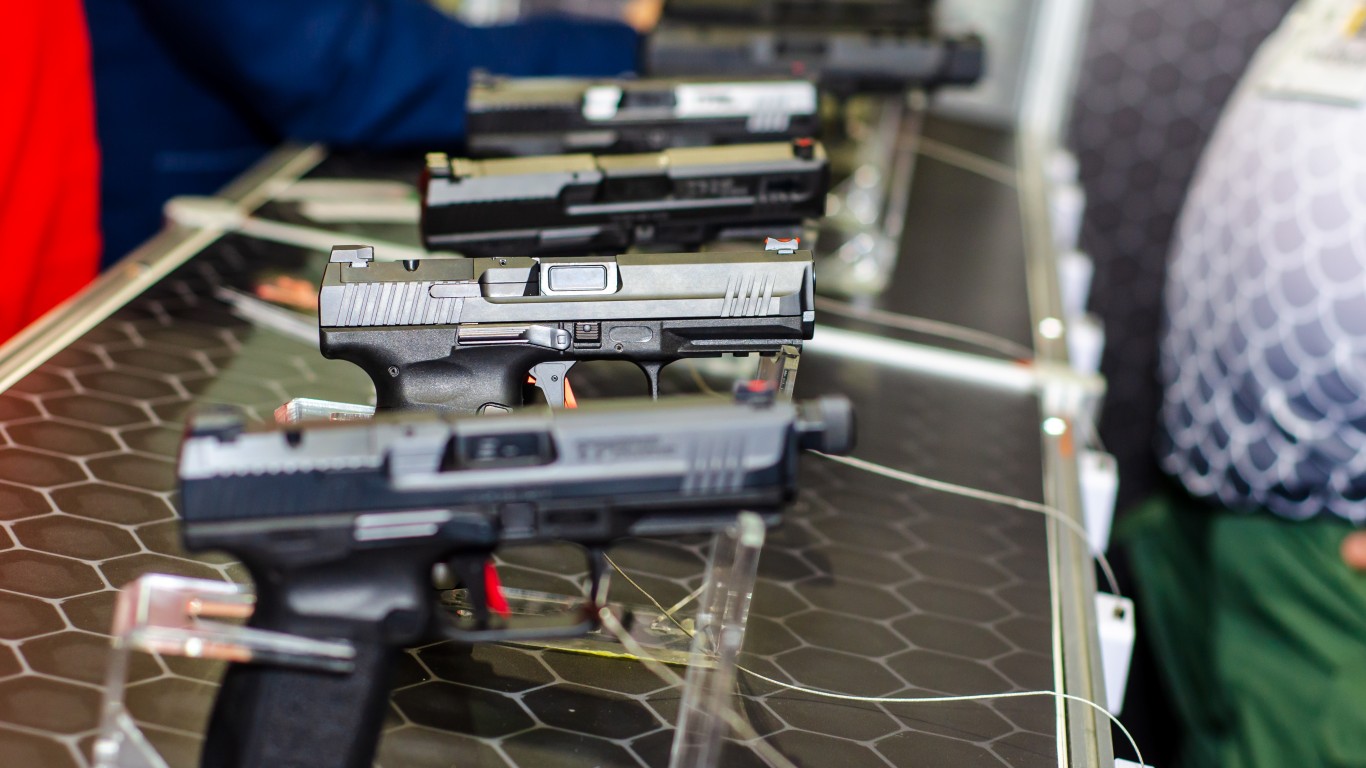
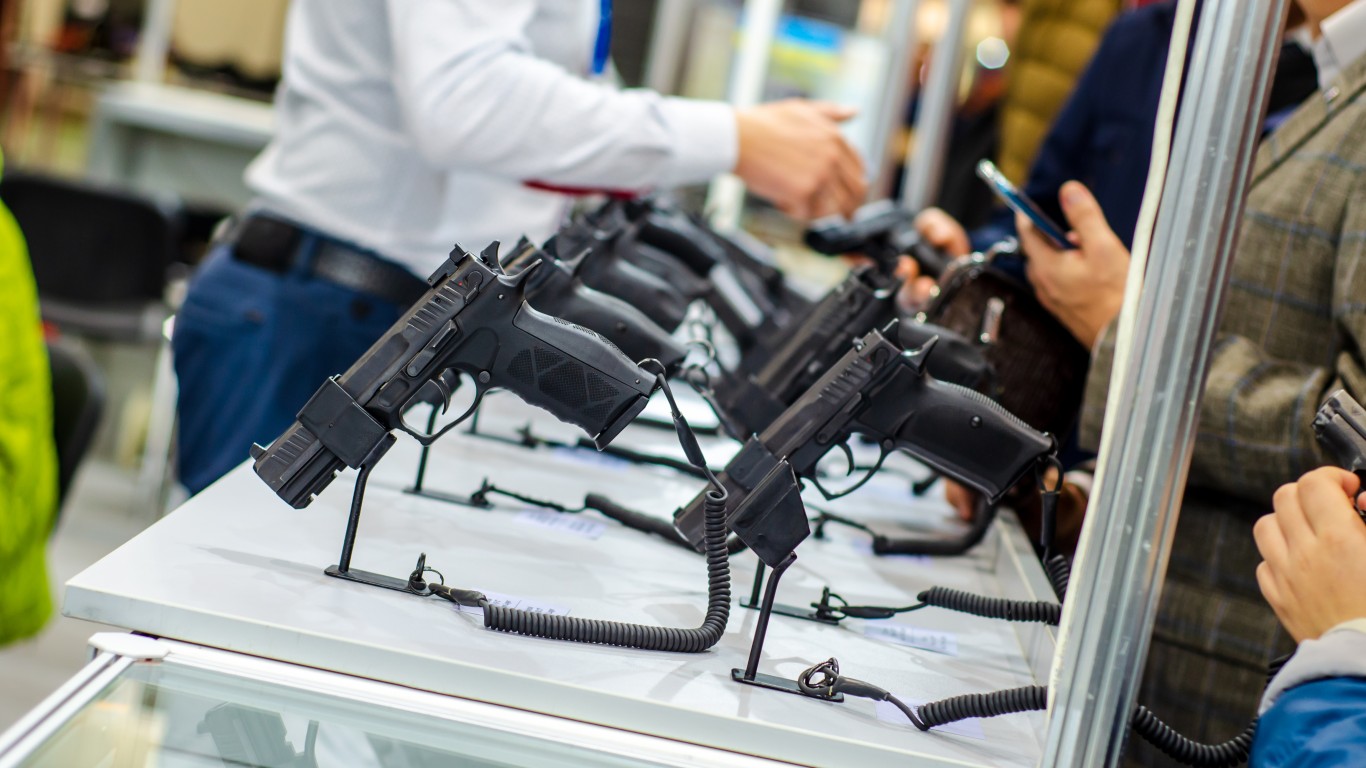
The shift to protection as the most common reason for gun ownership is reflected in consumer demand for firearms designed for that purpose — namely handguns and assault-style rifles. Relatively small and effective at close range, handguns — a firearm classification that includes both pistols and revolvers — are well-suited to personal protection and home-defense. Between 1986 and 2010, Americans bought about 2.4 million handguns annually on average — compared to an average 7.2 million per year between 2011 and 2020.
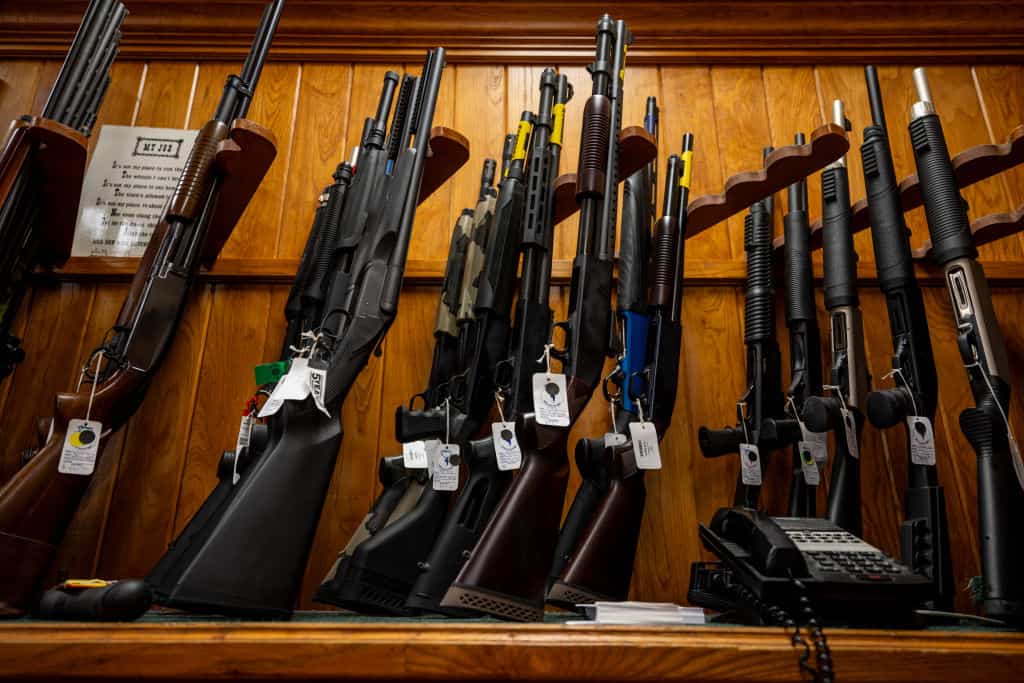
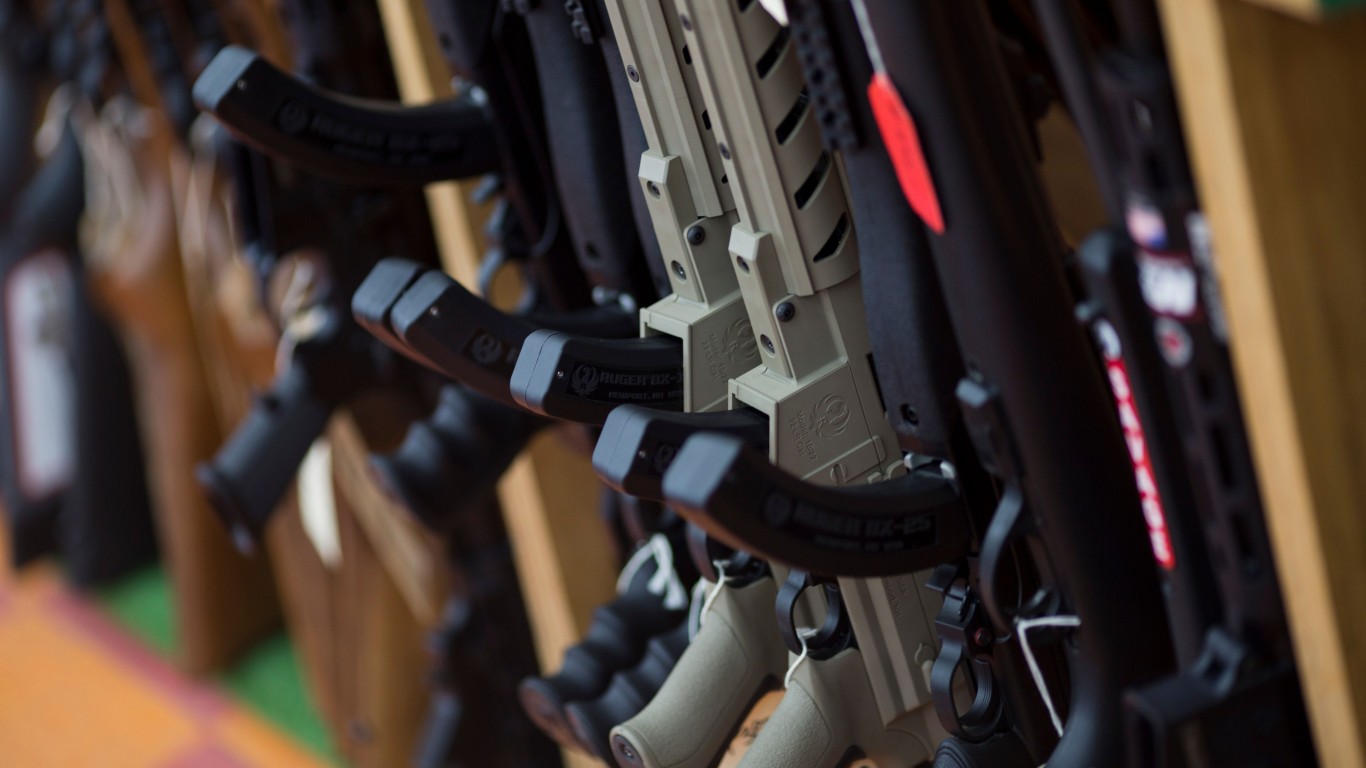
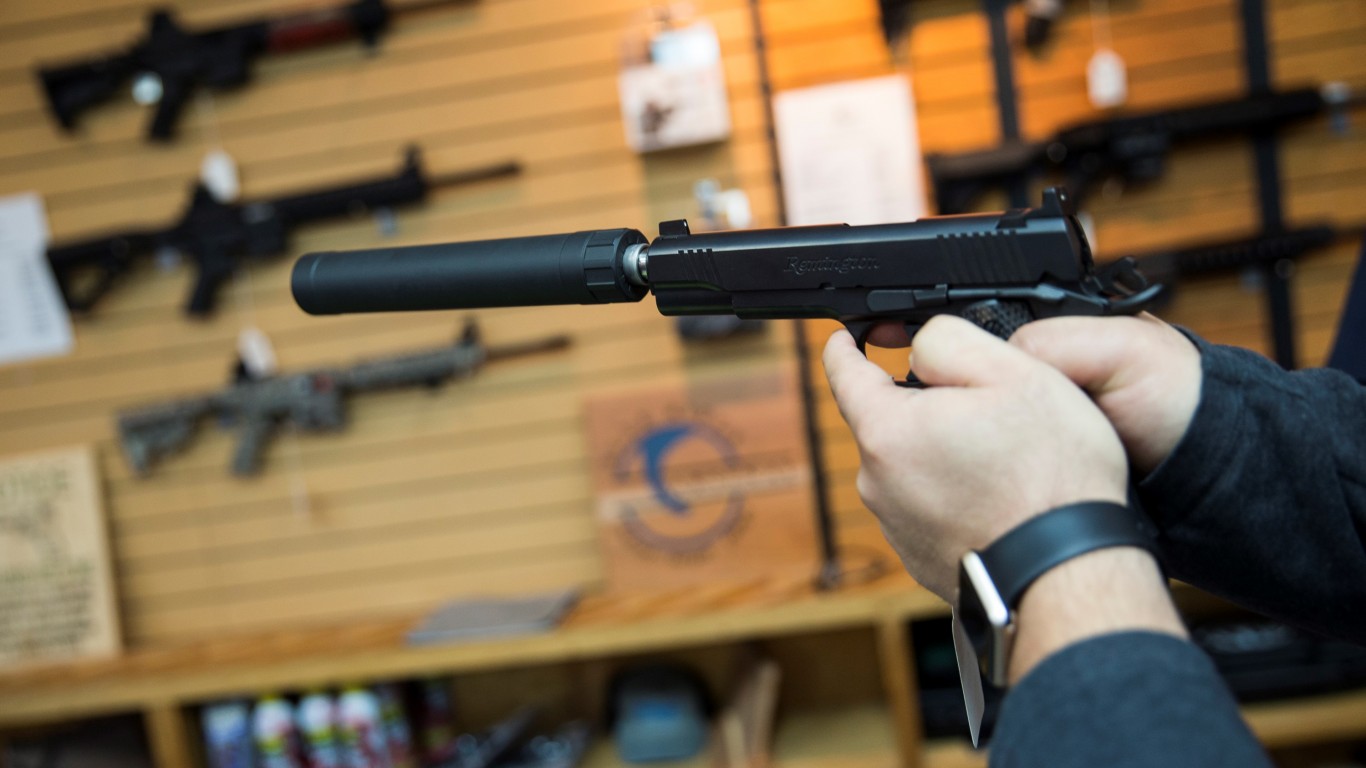
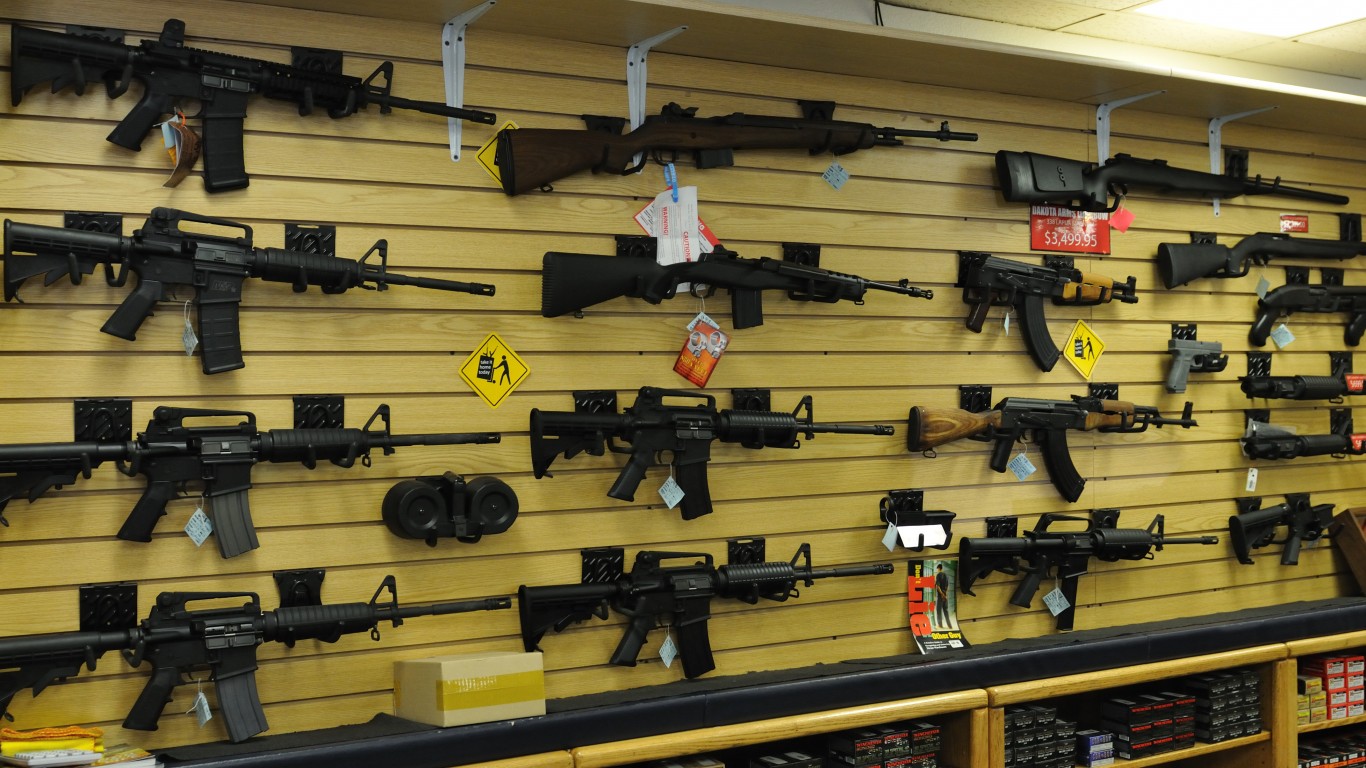
Assault-style rifles, or modern sporting rifles, have seen a similar bump in popularity. MSRs are civilian firearms built on military rifle platforms, like the AR-15 or AK-47. According to the latest estimates from the NSSF, nearly 70% of the 28.1 million MSRs in circulation since 1990 were sold within the last 10 years. (Here is a look at the companies behind the best-selling rifles in America.)
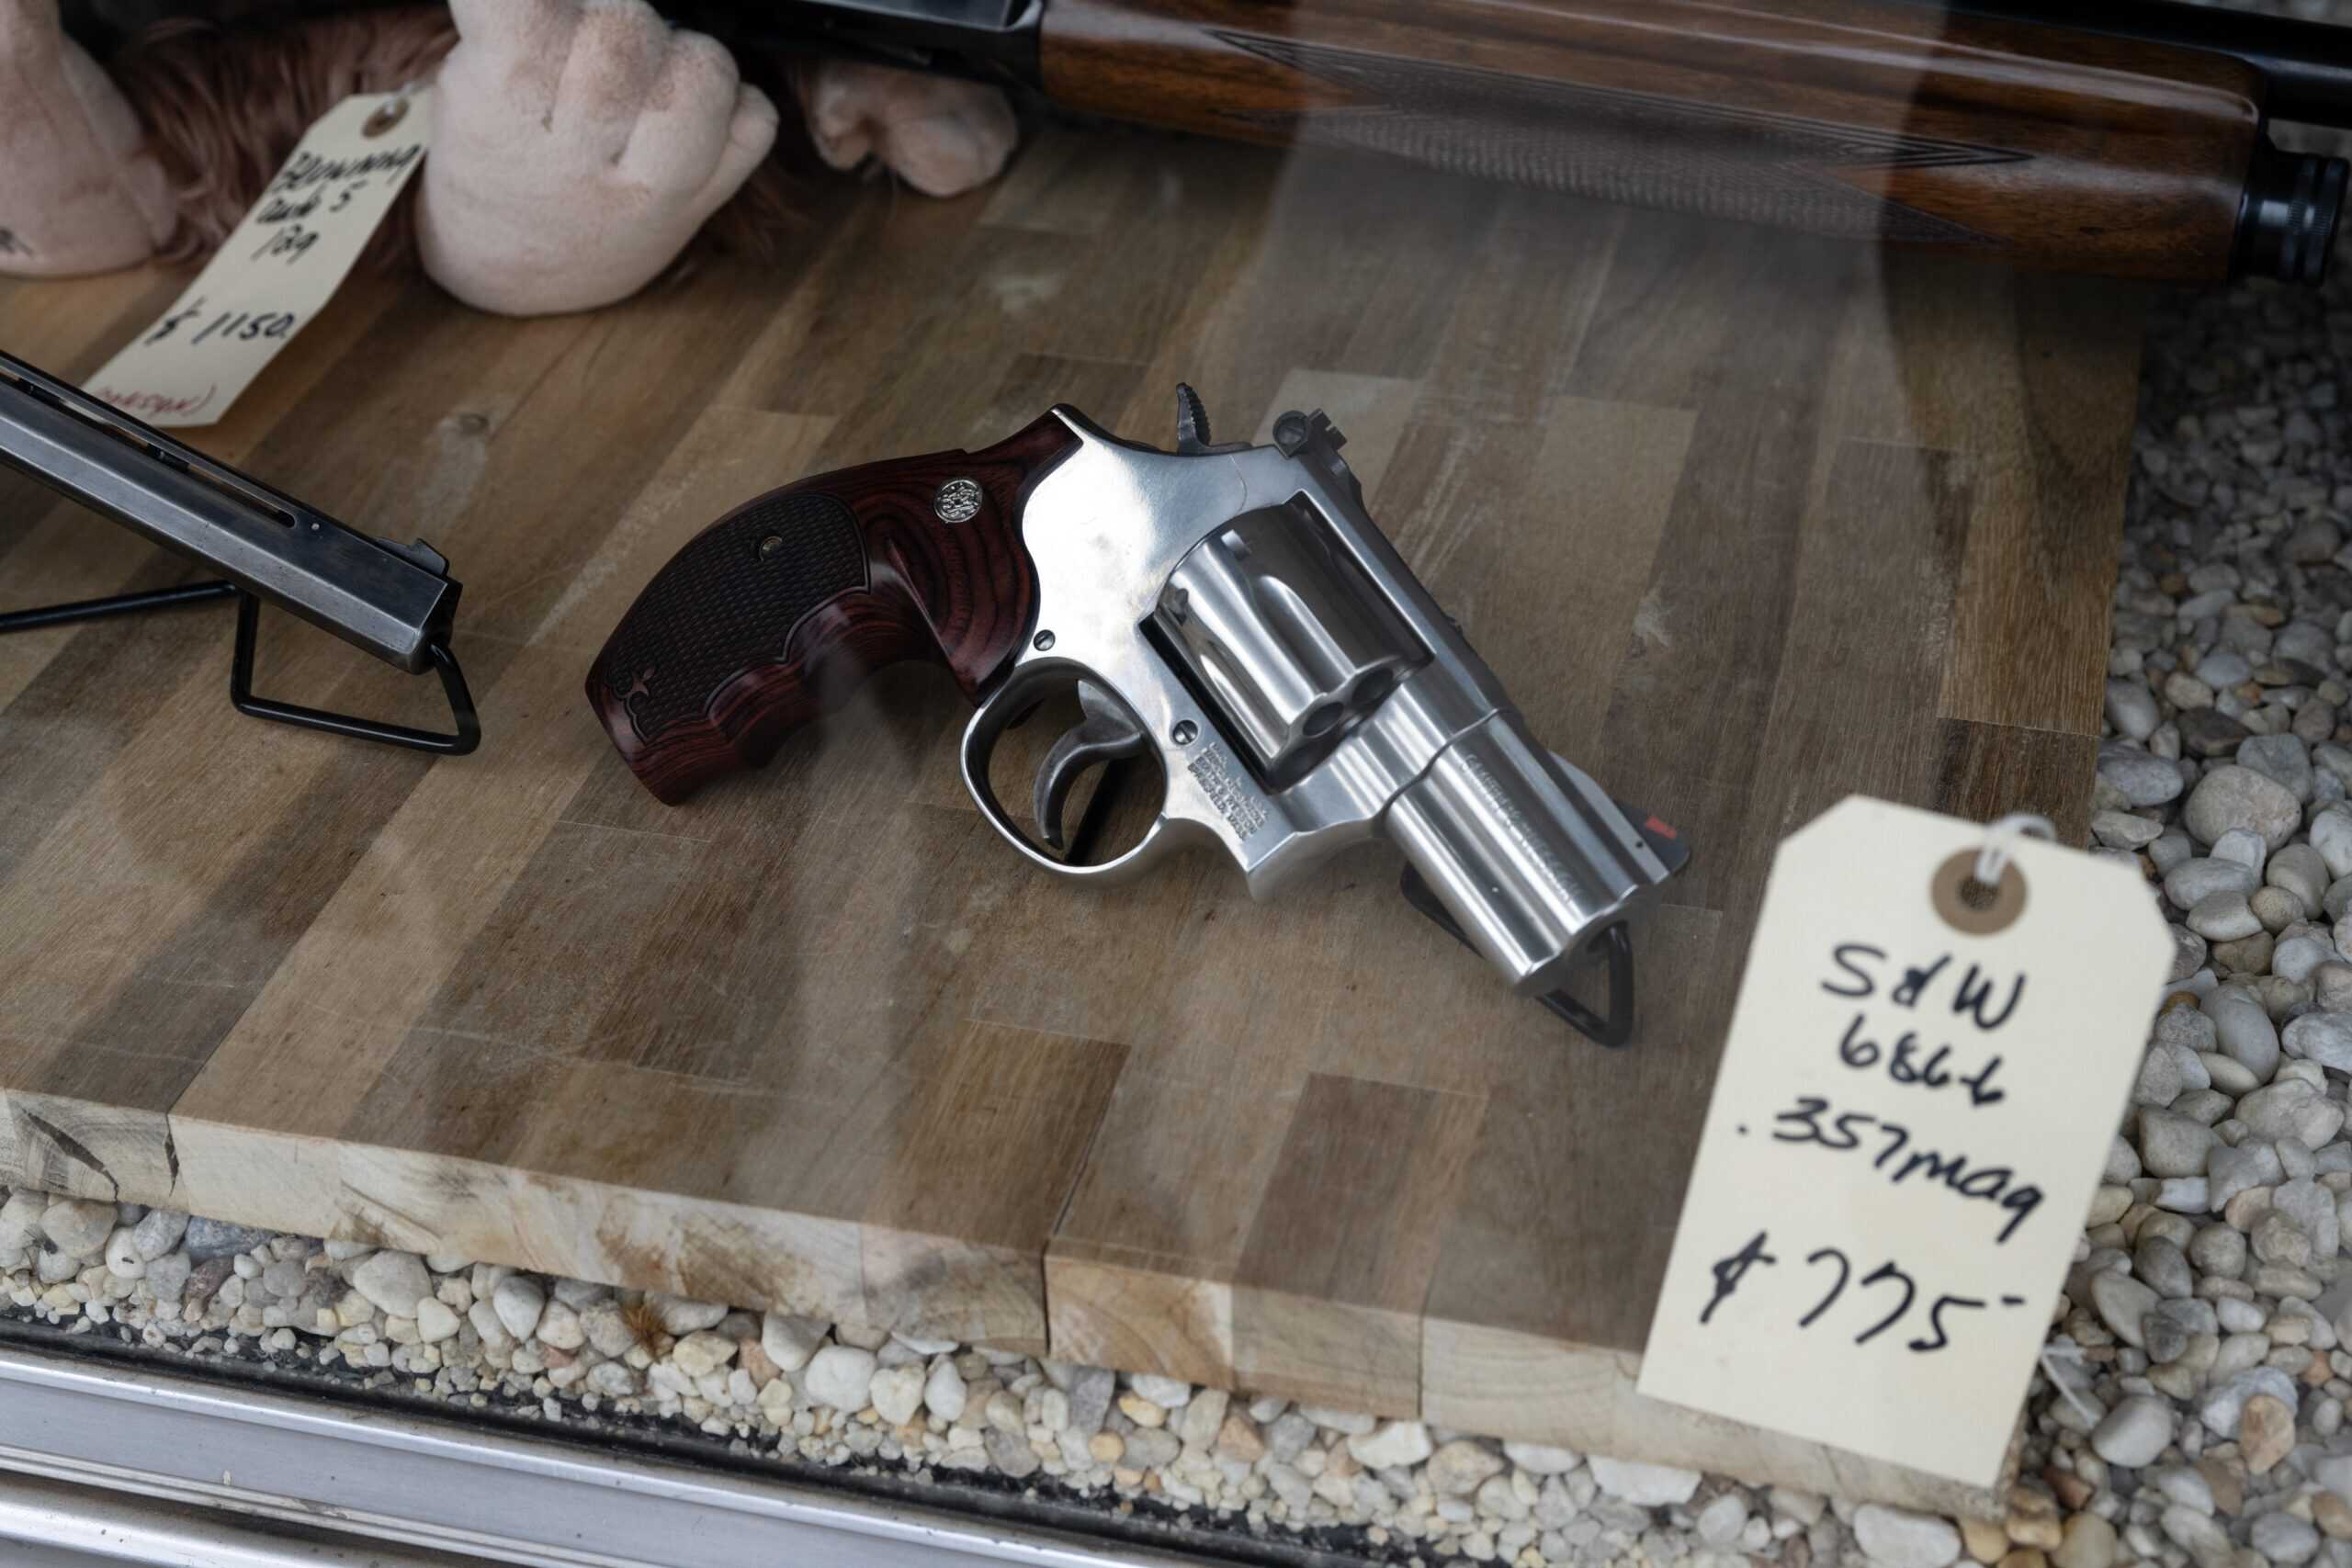
It is likely no coincidence that growing demand for both handguns and MSRs has overlapped with meaningful expansions in gun rights. A 10-year ban on civilian ownership of assault rifles or MSRs expired in 2004, and has not been renewed since. Similarly, by mid-summer 2024, it will be legal for adults to carry a concealed handgun in public in 29 states. As recently as 2012, permitless concealed carry was legal in only four states. (Here is a look at the most powerful handguns.)
Why It Matters

Source: Wikimedia Commons / Public Domain
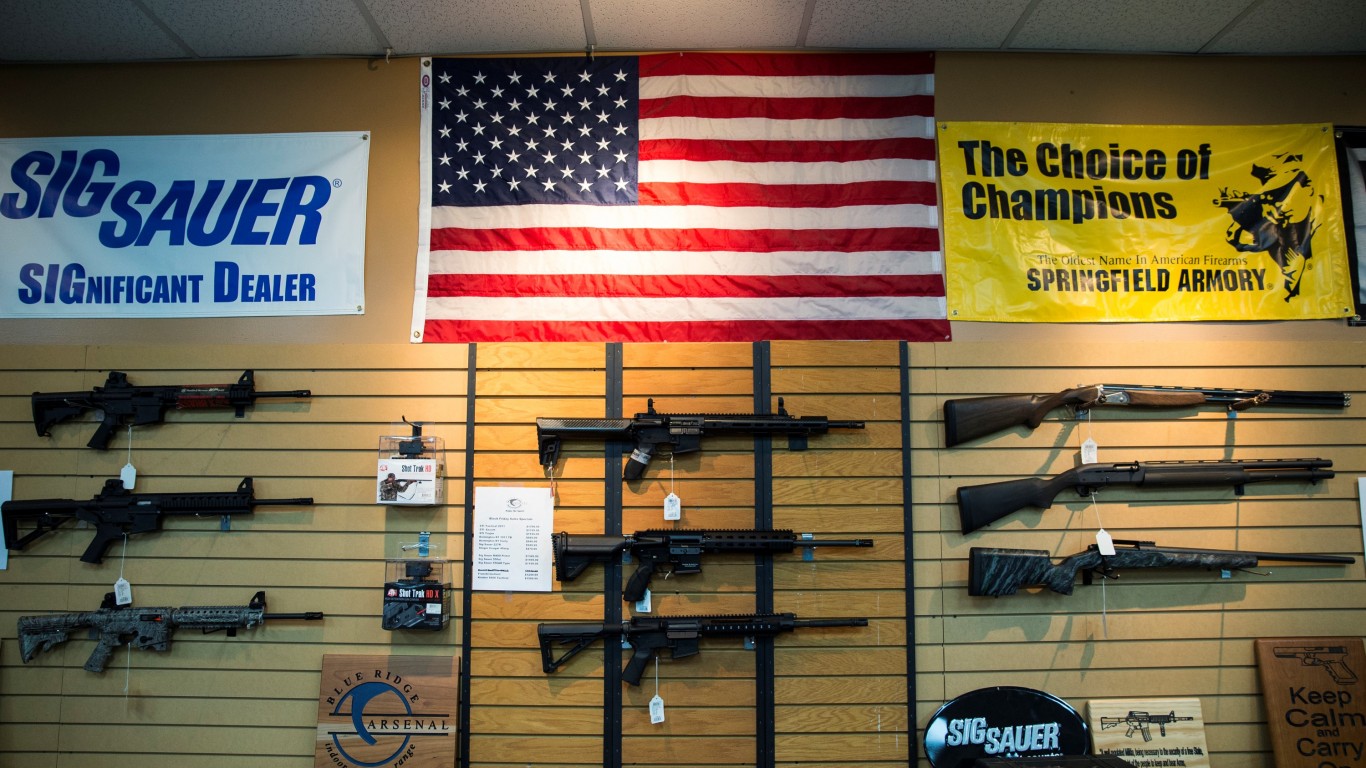
The United States is the largest consumer market for firearms by a wide margin. To meet demand — which has hit unprecedented highs in recent years — many of the world’s largest gunmakers have manufacturing operations in the United States. Of the 287.9 million firearms estimated to have been sold in the U.S. since 1986, more than two-thirds were manufactured domestically — and over half were sold in 2010 or later. Rising demand has likely been driven in part by changes in consumer preferences and an increasingly pro-gun regulatory environment.
1986: 3,524,486 firearms
")
- Est. U.S. firearm sales in 1986: 3,524,486 — the fewest in last 35 years (80.1% U.S. made; 19.9% imported)
- Est. U.S. handgun sales in 1986: 1,534,305 — the fewest in last 35 years (84.9% U.S. made; 15.1% imported)
- Est. U.S. rifle sales in 1986: 1,202,283 — 34th most in last 35 years (77.6% U.S. made; 22.4% imported)
- Est. U.S. shotgun sales in 1986: 783,539 — the fewest in last 35 years (74.3% U.S. made; 25.7% imported)
1987: 4,335,131 firearms

Source: Portland Press Herald / Portland Press Herald via Getty Images
- Est. U.S. firearm sales in 1987: 4,335,131 — 31st most in last 35 years (75.5% U.S. made; 24.5% imported)
- Est. U.S. handgun sales in 1987: 1,869,634 — 25th most in last 35 years (81.7% U.S. made; 18.3% imported)
- Est. U.S. rifle sales in 1987: 1,379,280 — 31st most in last 35 years (70.0% U.S. made; 30.0% imported)
- Est. U.S. shotgun sales in 1987: 1,089,232 — 27th most in last 35 years (71.8% U.S. made; 28.2% imported)
1988: 4,982,963 firearms
Source: GABRIEL BOUYS / AFP via Getty Images
- Est. U.S. firearm sales in 1988: 4,982,963 — 22nd most in last 35 years (74.4% U.S. made; 25.6% imported)
- Est. U.S. handgun sales in 1988: 2,345,516 — 20th most in last 35 years (73.5% U.S. made; 26.5% imported)
- Est. U.S. rifle sales in 1988: 1,373,451 — 32nd most in last 35 years (79.4% U.S. made; 20.6% imported)
- Est. U.S. shotgun sales in 1988: 1,231,379 — 14th most in last 35 years (69.8% U.S. made; 30.2% imported)
1989: 5,164,892 firearms

Source: IPGGutenbergUKLtd / iStock / Getty Images Plus via Getty Images
- Est. U.S. firearm sales in 1989: 5,164,892 — 19th most in last 35 years (80.5% U.S. made; 19.5% imported)
- Est. U.S. handgun sales in 1989: 2,354,994 — 19th most in last 35 years (81.3% U.S. made; 18.7% imported)
- Est. U.S. rifle sales in 1989: 1,627,305 — 26th most in last 35 years (82.0% U.S. made; 18.0% imported)
- Est. U.S. shotgun sales in 1989: 1,142,479 — 24th most in last 35 years (76.0% U.S. made; 24.0% imported)
1990: 4,442,152 firearms
Source: wingedwolf / iStock via Getty Images
- Est. U.S. firearm sales in 1990: 4,442,152 — 29th most in last 35 years (81.0% U.S. made; 19.0% imported)
- Est. U.S. handgun sales in 1990: 2,110,221 — 22nd most in last 35 years (78.7% U.S. made; 21.3% imported)
- Est. U.S. rifle sales in 1990: 1,343,335 — 33rd most in last 35 years (84.9% U.S. made; 15.1% imported)
- Est. U.S. shotgun sales in 1990: 936,485 — 32nd most in last 35 years (79.5% U.S. made; 20.5% imported)
1991: 3,882,598 firearms
Source: DmyTo / iStock via Getty Images
- Est. U.S. firearm sales in 1991: 3,882,598 — 34th most in last 35 years (81.4% U.S. made; 18.6% imported)
- Est. U.S. handgun sales in 1991: 1,939,116 — 23rd most in last 35 years (84.9% U.S. made; 15.1% imported)
- Est. U.S. rifle sales in 1991: 1,103,700 — the fewest in last 35 years (71.8% U.S. made; 28.2% imported)
- Est. U.S. shotgun sales in 1991: 826,766 — 34th most in last 35 years (86.0% U.S. made; 14.0% imported)
1992: 6,618,755 firearms
Source: ASphotowed / iStock via Getty Images
- Est. U.S. firearm sales in 1992: 6,618,755 — 16th most in last 35 years (57.0% U.S. made; 43.0% imported)
- Est. U.S. handgun sales in 1992: 2,930,536 — 16th most in last 35 years (66.5% U.S. made; 33.5% imported)
- Est. U.S. rifle sales in 1992: 2,335,007 — 13th most in last 35 years (39.0% U.S. made; 61.0% imported)
- Est. U.S. shotgun sales in 1992: 1,341,010 — 9th most in last 35 years (67.0% U.S. made; 33.0% imported)
1993: 7,667,754 firearms

Source: The Washington Post / The Washington Post via Getty Images
- Est. U.S. firearm sales in 1993: 7,667,754 — 13th most in last 35 years (60.3% U.S. made; 39.7% imported)
- Est. U.S. handgun sales in 1993: 3,709,645 — 13th most in last 35 years (67.5% U.S. made; 32.5% imported)
- Est. U.S. rifle sales in 1993: 2,671,944 — 11th most in last 35 years (40.4% U.S. made; 59.6% imported)
- Est. U.S. shotgun sales in 1993: 1,219,579 — 17th most in last 35 years (79.8% U.S. made; 20.2% imported)
1994: 6,649,646 firearms

Source: Joe Sohm/Visions of America / Universal Images Group via Getty Images
- Est. U.S. firearm sales in 1994: 6,649,646 — 15th most in last 35 years (71.7% U.S. made; 28.3% imported)
- Est. U.S. handgun sales in 1994: 3,333,022 — 15th most in last 35 years (72.5% U.S. made; 27.5% imported)
- Est. U.S. rifle sales in 1994: 2,082,640 — 17th most in last 35 years (59.3% U.S. made; 40.7% imported)
- Est. U.S. shotgun sales in 1994: 1,226,268 — 15th most in last 35 years (90.4% U.S. made; 9.6% imported)
1995: 4,995,525 firearms
Source: Anadolu Agency / Anadolu Agency via Getty Images
- Est. U.S. firearm sales in 1995: 4,995,525 — 21st most in last 35 years (77.9% U.S. made; 22.1% imported)
- Est. U.S. handgun sales in 1995: 2,199,438 — 21st most in last 35 years (67.9% U.S. made; 32.1% imported)
- Est. U.S. rifle sales in 1995: 1,581,471 — 28th most in last 35 years (83.5% U.S. made; 16.5% imported)
- Est. U.S. shotgun sales in 1995: 1,208,470 — 20th most in last 35 years (88.7% U.S. made; 11.3% imported)
1996: 4,404,020 firearms
Source: Anadolu Agency / Anadolu Agency via Getty Images
- Est. U.S. firearm sales in 1996: 4,404,020 — 30th most in last 35 years (80.0% U.S. made; 20.0% imported)
- Est. U.S. handgun sales in 1996: 1,822,832 — 26th most in last 35 years (73.1% U.S. made; 26.9% imported)
- Est. U.S. rifle sales in 1996: 1,612,326 — 27th most in last 35 years (83.7% U.S. made; 16.3% imported)
- Est. U.S. shotgun sales in 1996: 956,997 — 31st most in last 35 years (86.6% U.S. made; 13.4% imported)
1997: 4,257,838 firearms
Source: Anadolu Agency / Anadolu Agency via Getty Images
- Est. U.S. firearm sales in 1997: 4,257,838 — 32nd most in last 35 years (77.9% U.S. made; 22.1% imported)
- Est. U.S. handgun sales in 1997: 1,772,849 — 29th most in last 35 years (73.3% U.S. made; 26.7% imported)
- Est. U.S. rifle sales in 1997: 1,533,652 — 29th most in last 35 years (76.6% U.S. made; 23.4% imported)
- Est. U.S. shotgun sales in 1997: 936,011 — 33rd most in last 35 years (88.6% U.S. made; 11.4% imported)
1998: 4,510,056 firearms

Source: ROB KERR / AFP via Getty Images
- Est. U.S. firearm sales in 1998: 4,510,056 — 28th most in last 35 years (77.8% U.S. made; 22.2% imported)
- Est. U.S. handgun sales in 1998: 1,771,111 — 30th most in last 35 years (70.0% U.S. made; 30.0% imported)
- Est. U.S. rifle sales in 1998: 1,718,625 — 24th most in last 35 years (85.5% U.S. made; 14.5% imported)
- Est. U.S. shotgun sales in 1998: 998,327 — 30th most in last 35 years (78.0% U.S. made; 22.0% imported)
1999: 4,719,228 firearms

Source: spendadaytouring / Flickr
- Est. U.S. firearm sales in 1999: 4,719,228 — 25th most in last 35 years (81.1% U.S. made; 18.9% imported)
- Est. U.S. handgun sales in 1999: 1,556,003 — 34th most in last 35 years (80.2% U.S. made; 19.8% imported)
- Est. U.S. rifle sales in 1999: 1,702,207 — 25th most in last 35 years (88.4% U.S. made; 11.6% imported)
- Est. U.S. shotgun sales in 1999: 1,425,209 — 6th most in last 35 years (72.9% U.S. made; 27.1% imported)
2000: 4,717,696 firearms

Source: jfbenning / iStock Editorial via Getty Images
- Est. U.S. firearm sales in 2000: 4,717,696 — 26th most in last 35 years (76.8% U.S. made; 23.2% imported)
- Est. U.S. handgun sales in 2000: 1,670,998 — 32nd most in last 35 years (72.1% U.S. made; 27.9% imported)
- Est. U.S. rifle sales in 2000: 1,832,294 — 21st most in last 35 years (83.7% U.S. made; 16.3% imported)
- Est. U.S. shotgun sales in 2000: 1,195,340 — 23rd most in last 35 years (72.2% U.S. made; 27.8% imported)
2001: 4,126,940 firearms

Source: mtcurado / iStock Unreleased via Getty Images
- Est. U.S. firearm sales in 2001: 4,126,940 — 33rd most in last 35 years (66.9% U.S. made; 33.1% imported)
- Est. U.S. handgun sales in 2001: 1,593,124 — 33rd most in last 35 years (55.4% U.S. made; 44.6% imported)
- Est. U.S. rifle sales in 2001: 1,461,477 — 30th most in last 35 years (84.4% U.S. made; 15.6% imported)
- Est. U.S. shotgun sales in 2001: 1,061,969 — 29th most in last 35 years (59.7% U.S. made; 40.3% imported)
2002: 4,845,376 firearms
Source: 2023 Getty Images / Getty Images News via Getty Images
- Est. U.S. firearm sales in 2002: 4,845,376 — 24th most in last 35 years (66.4% U.S. made; 33.6% imported)
- Est. U.S. handgun sales in 2002: 1,773,687 — 28th most in last 35 years (58.2% U.S. made; 41.8% imported)
- Est. U.S. rifle sales in 2002: 1,962,279 — 20th most in last 35 years (74.1% U.S. made; 25.9% imported)
- Est. U.S. shotgun sales in 2002: 1,089,183 — 28th most in last 35 years (65.1% U.S. made; 34.9% imported)
2003: 4,632,994 firearms

Source: 2023 Getty Images / Getty Images News via Getty Images
- Est. U.S. firearm sales in 2003: 4,632,994 — 27th most in last 35 years (68.3% U.S. made; 31.7% imported)
- Est. U.S. handgun sales in 2003: 1,708,423 — 31st most in last 35 years (63.1% U.S. made; 36.9% imported)
- Est. U.S. rifle sales in 2003: 1,796,639 — 23rd most in last 35 years (76.1% U.S. made; 23.9% imported)
- Est. U.S. shotgun sales in 2003: 1,103,943 — 26th most in last 35 years (63.1% U.S. made; 36.9% imported)
2004: 4,869,964 firearms
Source: 2022 Getty Images / Getty Images News via Getty Images
- Est. U.S. firearm sales in 2004: 4,869,964 — 23rd most in last 35 years (60.8% U.S. made; 39.2% imported)
- Est. U.S. handgun sales in 2004: 1,822,385 — 27th most in last 35 years (54.0% U.S. made; 46.0% imported)
- Est. U.S. rifle sales in 2004: 1,827,688 — 22nd most in last 35 years (69.1% U.S. made; 30.9% imported)
- Est. U.S. shotgun sales in 2004: 1,207,794 — 21st most in last 35 years (58.0% U.S. made; 42.0% imported)
2005: 5,153,487 firearms
Source: 2023 Getty Images / Getty Images News via Getty Images
- Est. U.S. firearm sales in 2005: 5,153,487 — 20th most in last 35 years (59.1% U.S. made; 40.9% imported)
- Est. U.S. handgun sales in 2005: 1,907,335 — 24th most in last 35 years (54.0% U.S. made; 46.0% imported)
- Est. U.S. rifle sales in 2005: 2,021,374 — 19th most in last 35 years (66.3% U.S. made; 33.7% imported)
- Est. U.S. shotgun sales in 2005: 1,209,587 — 19th most in last 35 years (54.8% U.S. made; 45.2% imported)
2006: 5,718,325 firearms
Source: Feifei Cui-Paoluzzo / Moment via Getty Images
- Est. U.S. firearm sales in 2006: 5,718,325 — 18th most in last 35 years (57.5% U.S. made; 42.5% imported)
- Est. U.S. handgun sales in 2006: 2,399,739 — 18th most in last 35 years (51.4% U.S. made; 48.6% imported)
- Est. U.S. rifle sales in 2006: 2,053,069 — 18th most in last 35 years (67.9% U.S. made; 32.1% imported)
- Est. U.S. shotgun sales in 2006: 1,263,667 — 12th most in last 35 years (52.0% U.S. made; 48.0% imported)
2007: 6,461,824 firearms
Source: Joe Raedle / Getty Images News via Getty Images
- Est. U.S. firearm sales in 2007: 6,461,824 — 17th most in last 35 years (57.5% U.S. made; 42.5% imported)
- Est. U.S. handgun sales in 2007: 2,917,743 — 17th most in last 35 years (52.5% U.S. made; 47.5% imported)
- Est. U.S. rifle sales in 2007: 2,162,110 — 16th most in last 35 years (70.8% U.S. made; 29.2% imported)
- Est. U.S. shotgun sales in 2007: 1,344,034 — 8th most in last 35 years (46.0% U.S. made; 54.0% imported)
2008: 6,876,842 firearms
Source: Anadolu Agency / Anadolu Agency via Getty Images
- Est. U.S. firearm sales in 2008: 6,876,842 — 14th most in last 35 years (62.1% U.S. made; 37.9% imported)
- Est. U.S. handgun sales in 2008: 3,426,961 — 14th most in last 35 years (57.2% U.S. made; 42.8% imported)
- Est. U.S. rifle sales in 2008: 2,232,356 — 15th most in last 35 years (73.0% U.S. made; 27.0% imported)
- Est. U.S. shotgun sales in 2008: 1,125,484 — 25th most in last 35 years (52.4% U.S. made; 47.6% imported)
2009: 8,968,180 firearms
Source: DOMINICK REUTER / AFP via Getty Images
- Est. U.S. firearm sales in 2009: 8,968,180 — 11th most in last 35 years (59.8% U.S. made; 40.2% imported)
- Est. U.S. handgun sales in 2009: 4,511,091 — 11th most in last 35 years (51.6% U.S. made; 48.4% imported)
- Est. U.S. rifle sales in 2009: 3,051,789 — 9th most in last 35 years (71.7% U.S. made; 28.3% imported)
- Est. U.S. shotgun sales in 2009: 1,274,923 — 11th most in last 35 years (56.2% U.S. made; 43.8% imported)
2010: 8,057,210 firearms
Source: Anadolu Agency / Anadolu Agency via Getty Images
- Est. U.S. firearm sales in 2010: 8,057,210 — 12th most in last 35 years (64.8% U.S. made; 35.2% imported)
- Est. U.S. handgun sales in 2010: 4,494,635 — 12th most in last 35 years (60.3% U.S. made; 39.7% imported)
- Est. U.S. rifle sales in 2010: 2,301,487 — 14th most in last 35 years (76.2% U.S. made; 23.8% imported)
- Est. U.S. shotgun sales in 2010: 1,209,930 — 18th most in last 35 years (57.9% U.S. made; 42.1% imported)
2011: 9,497,402 firearms
Source: TIMOTHY A. CLARY / AFP via Getty Images
- Est. U.S. firearm sales in 2011: 9,497,402 — 10th most in last 35 years (65.8% U.S. made; 34.2% imported)
- Est. U.S. handgun sales in 2011: 4,752,010 — 10th most in last 35 years (63.7% U.S. made; 36.3% imported)
- Est. U.S. rifle sales in 2011: 3,236,904 — 8th most in last 35 years (69.2% U.S. made; 30.8% imported)
- Est. U.S. shotgun sales in 2011: 1,336,579 — 10th most in last 35 years (60.4% U.S. made; 39.6% imported)
2012: 13,135,646 firearms

Source: Boston Globe / Boston Globe via Getty Images
- Est. U.S. firearm sales in 2012: 13,135,646 — 4th most in last 35 years (63.1% U.S. made; 36.9% imported)
- Est. U.S. handgun sales in 2012: 6,634,485 — 7th most in last 35 years (60.4% U.S. made; 39.6% imported)
- Est. U.S. rifle sales in 2012: 4,330,775 — 4th most in last 35 years (71.3% U.S. made; 28.7% imported)
- Est. U.S. shotgun sales in 2012: 1,879,617 — 3rd most in last 35 years (48.2% U.S. made; 51.8% imported)
2013: 15,991,210 firearms
Source: Anadolu Agency / Anadolu Agency via Getty Images
- Est. U.S. firearm sales in 2013: 15,991,210 — 3rd most in last 35 years (65.4% U.S. made; 34.6% imported)
- Est. U.S. handgun sales in 2013: 8,073,647 — 3rd most in last 35 years (61.7% U.S. made; 38.3% imported)
- Est. U.S. rifle sales in 2013: 5,355,628 — the most in last 35 years (71.8% U.S. made; 28.2% imported)
- Est. U.S. shotgun sales in 2013: 2,089,541 — 2nd most in last 35 years (55.2% U.S. made; 44.8% imported)
2014: 12,254,962 firearms
Source: Anadolu Agency / Anadolu Agency via Getty Images
- Est. U.S. firearm sales in 2014: 12,254,962 — 8th most in last 35 years (70.4% U.S. made; 29.6% imported)
- Est. U.S. handgun sales in 2014: 6,410,701 — 8th most in last 35 years (65.9% U.S. made; 34.1% imported)
- Est. U.S. rifle sales in 2014: 3,963,507 — 5th most in last 35 years (80.0% U.S. made; 20.0% imported)
- Est. U.S. shotgun sales in 2014: 1,523,373 — 5th most in last 35 years (57.4% U.S. made; 42.6% imported)
2015: 12,945,416 firearms
Source: picture alliance / picture alliance via Getty Images
- Est. U.S. firearm sales in 2015: 12,945,416 — 5th most in last 35 years (69.6% U.S. made; 30.4% imported)
- Est. U.S. handgun sales in 2015: 6,749,106 — 6th most in last 35 years (63.4% U.S. made; 36.6% imported)
- Est. U.S. rifle sales in 2015: 4,347,909 — 3rd most in last 35 years (81.2% U.S. made; 18.8% imported)
- Est. U.S. shotgun sales in 2015: 1,402,769 — 7th most in last 35 years (54.1% U.S. made; 45.9% imported)
2016: 16,258,394 firearms
Source: Anadolu Agency / Anadolu Agency via Getty Images
- Est. U.S. firearm sales in 2016: 16,258,394 — 2nd most in last 35 years (68.4% U.S. made; 31.6% imported)
- Est. U.S. handgun sales in 2016: 9,051,208 — 2nd most in last 35 years (59.4% U.S. made; 40.6% imported)
- Est. U.S. rifle sales in 2016: 4,821,743 — 2nd most in last 35 years (84.9% U.S. made; 15.1% imported)
- Est. U.S. shotgun sales in 2016: 1,560,431 — 4th most in last 35 years (52.8% U.S. made; 47.2% imported)
2017: 12,331,748 firearms
Source: artas / iStock via Getty Images
- Est. U.S. firearm sales in 2017: 12,331,748 — 7th most in last 35 years (63.6% U.S. made; 36.4% imported)
- Est. U.S. handgun sales in 2017: 7,402,669 — 4th most in last 35 years (55.6% U.S. made; 44.4% imported)
- Est. U.S. rifle sales in 2017: 2,917,530 — 10th most in last 35 years (80.4% U.S. made; 19.6% imported)
- Est. U.S. shotgun sales in 2017: 1,255,247 — 13th most in last 35 years (49.6% U.S. made; 50.4% imported)
2018: 12,804,242 firearms
Source: artas / iStock via Getty Images
- Est. U.S. firearm sales in 2018: 12,804,242 — 6th most in last 35 years (66.4% U.S. made; 33.6% imported)
- Est. U.S. handgun sales in 2018: 7,131,118 — 5th most in last 35 years (58.8% U.S. made; 41.2% imported)
- Est. U.S. rifle sales in 2018: 3,366,994 — 7th most in last 35 years (80.6% U.S. made; 19.4% imported)
- Est. U.S. shotgun sales in 2018: 1,222,283 — 16th most in last 35 years (41.6% U.S. made; 58.4% imported)
2019: 10,681,126 firearms

Source: Spencer Platt / Getty Images News via Getty Images
- Est. U.S. firearm sales in 2019: 10,681,126 — 9th most in last 35 years (62.7% U.S. made; 37.3% imported)
- Est. U.S. handgun sales in 2019: 6,067,861 — 9th most in last 35 years (57.2% U.S. made; 42.8% imported)
- Est. U.S. rifle sales in 2019: 2,470,129 — 12th most in last 35 years (73.7% U.S. made; 26.3% imported)
- Est. U.S. shotgun sales in 2019: 1,201,668 — 22nd most in last 35 years (38.1% U.S. made; 61.9% imported)
2020: 17,366,316 firearms
Source: Spencer Platt / Getty Images News via Getty Images
- Est. U.S. firearm sales in 2020: 17,366,316 — the most in last 35 years (60.7% U.S. made; 39.3% imported)
- Est. U.S. handgun sales in 2020: 10,131,519 — the most in last 35 years (60.2% U.S. made; 39.8% imported)
- Est. U.S. rifle sales in 2020: 3,536,097 — 6th most in last 35 years (75.3% U.S. made; 24.7% imported)
- Est. U.S. shotgun sales in 2020: 2,383,745 — the most in last 35 years (19.2% U.S. made; 80.8% imported)
2021: 13,346,235 firearms
Source: saechang / Flickr
- Est. U.S. firearm sales in 2021: 13,346,235 (U.S.-made firearms only)
- Est. U.S. handgun sales in 2021: 7,649,276 (U.S.-made handguns only)
- Est. U.S. rifle sales in 2021: 3,774,080 (U.S.-made rifles only)
- Est. U.S. shotgun sales in 2021: 647,939 (U.S.-made shotguns only)
2022: 12,763,846 firearms

- Est. U.S. firearm sales in 2022: 12,763,846 (U.S.-made firearms only)
- Est. U.S. handgun sales in 2022: 6,619,082 (U.S.-made handguns only)
- Est. U.S. rifle sales in 2022: 3,359,975 (U.S.-made rifles only)
- Est. U.S. shotgun sales in 2022: 619,038 (U.S.-made shotguns only)
ALERT: Take This Retirement Quiz Now (Sponsored)
Take the quiz below to get matched with a financial advisor today.
Each advisor has been vetted by SmartAsset and is held to a fiduciary standard to act in your best interests.
Here’s how it works:
1. Answer SmartAsset advisor match quiz
2. Review your pre-screened matches at your leisure. Check out the advisors’ profiles.
3. Speak with advisors at no cost to you. Have an introductory call on the phone or introduction in person and choose whom to work with in the future
Take the retirement quiz right here.
Thank you for reading! Have some feedback for us?
Contact the 24/7 Wall St. editorial team.
Editors' Picks