
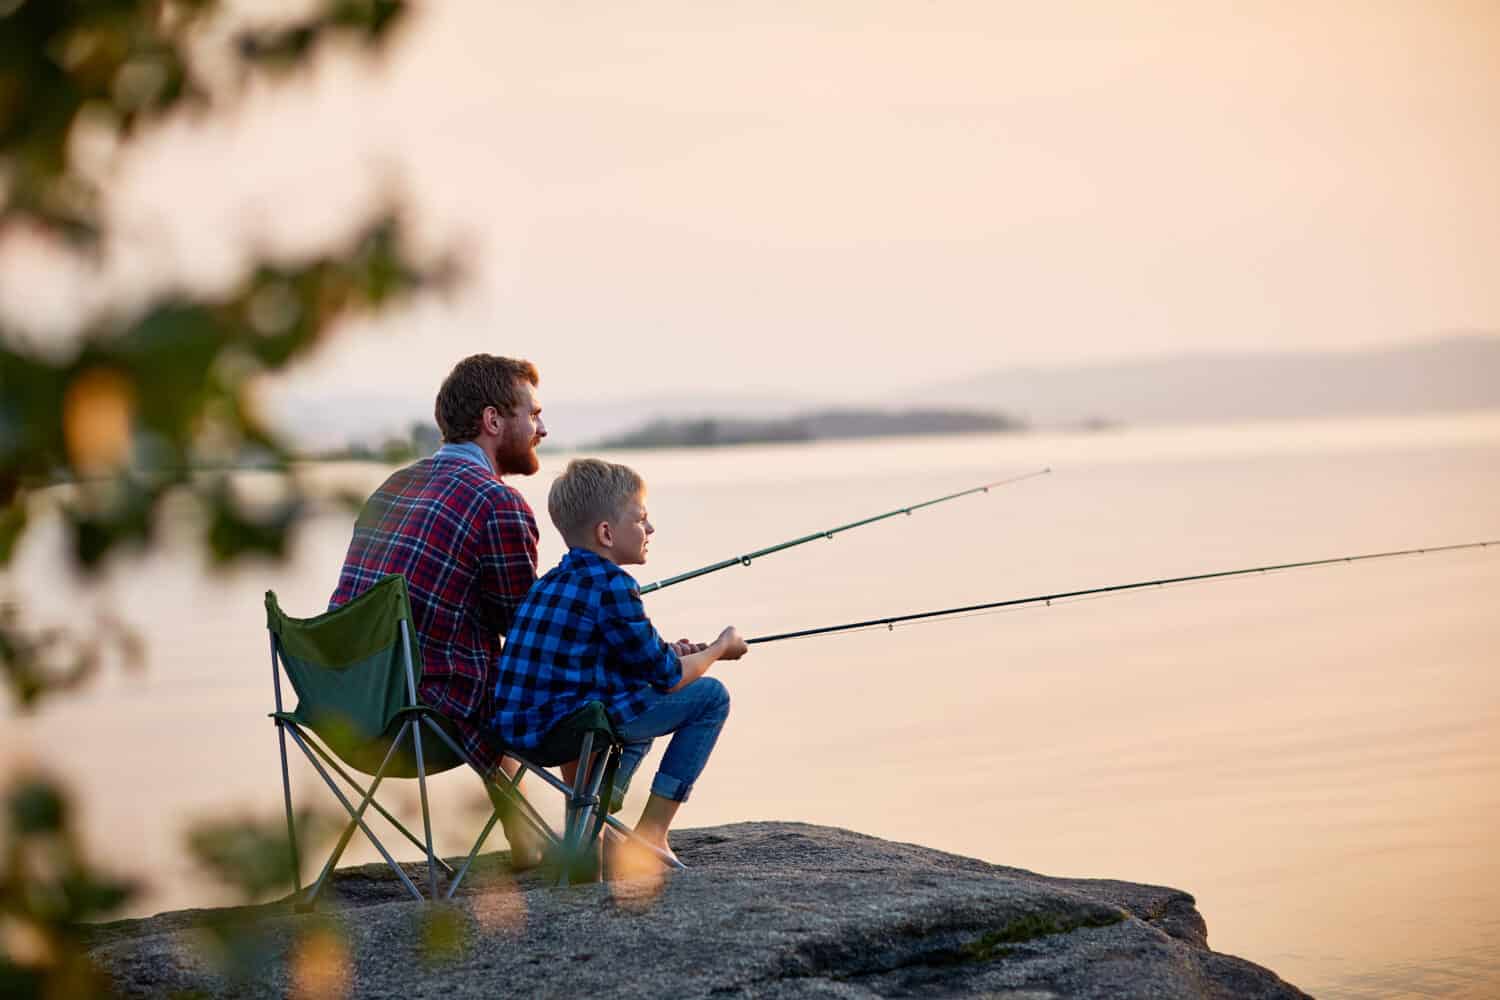
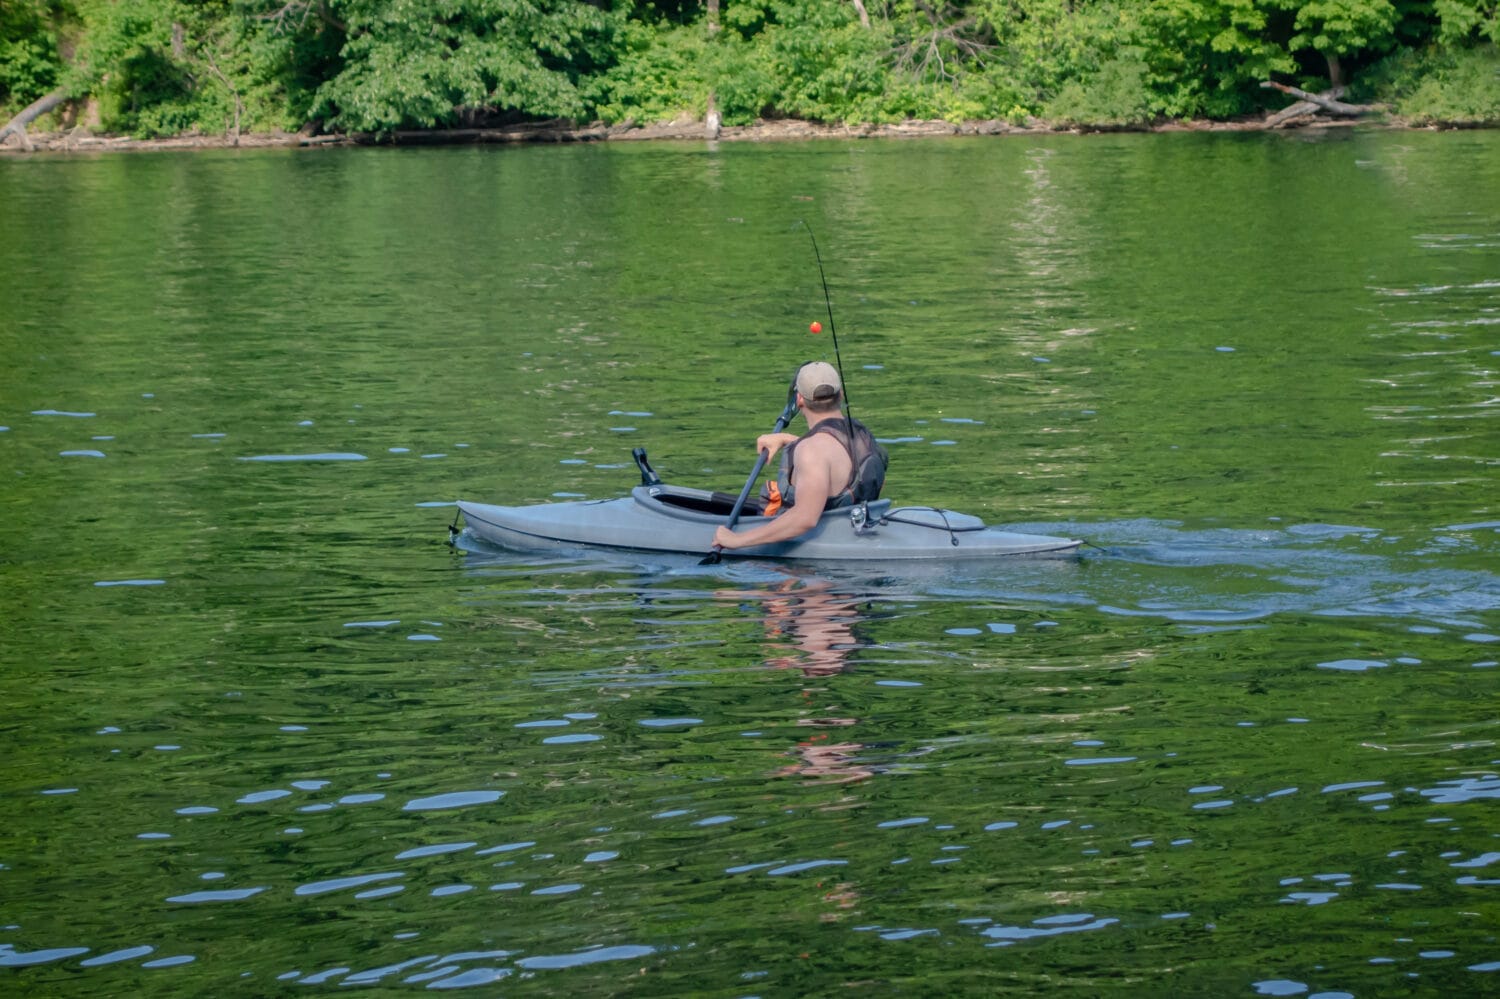
Fishing is one of the most popular sports in the United States, and participation rates have climbed substantially in recent years. According to the U.S. Fish & Wildlife Service, nearly 40 million Americans — or about 1 in every 7 residents age 16 or older — went fishing at least once in 2022, more than double the 14.4 million Americans who hunted that year. Additionally, the number of licensed anglers in the U.S. increased by 11%, or more than 3 million, over the last two decades. (Here is a look at the states with the most hunters.)
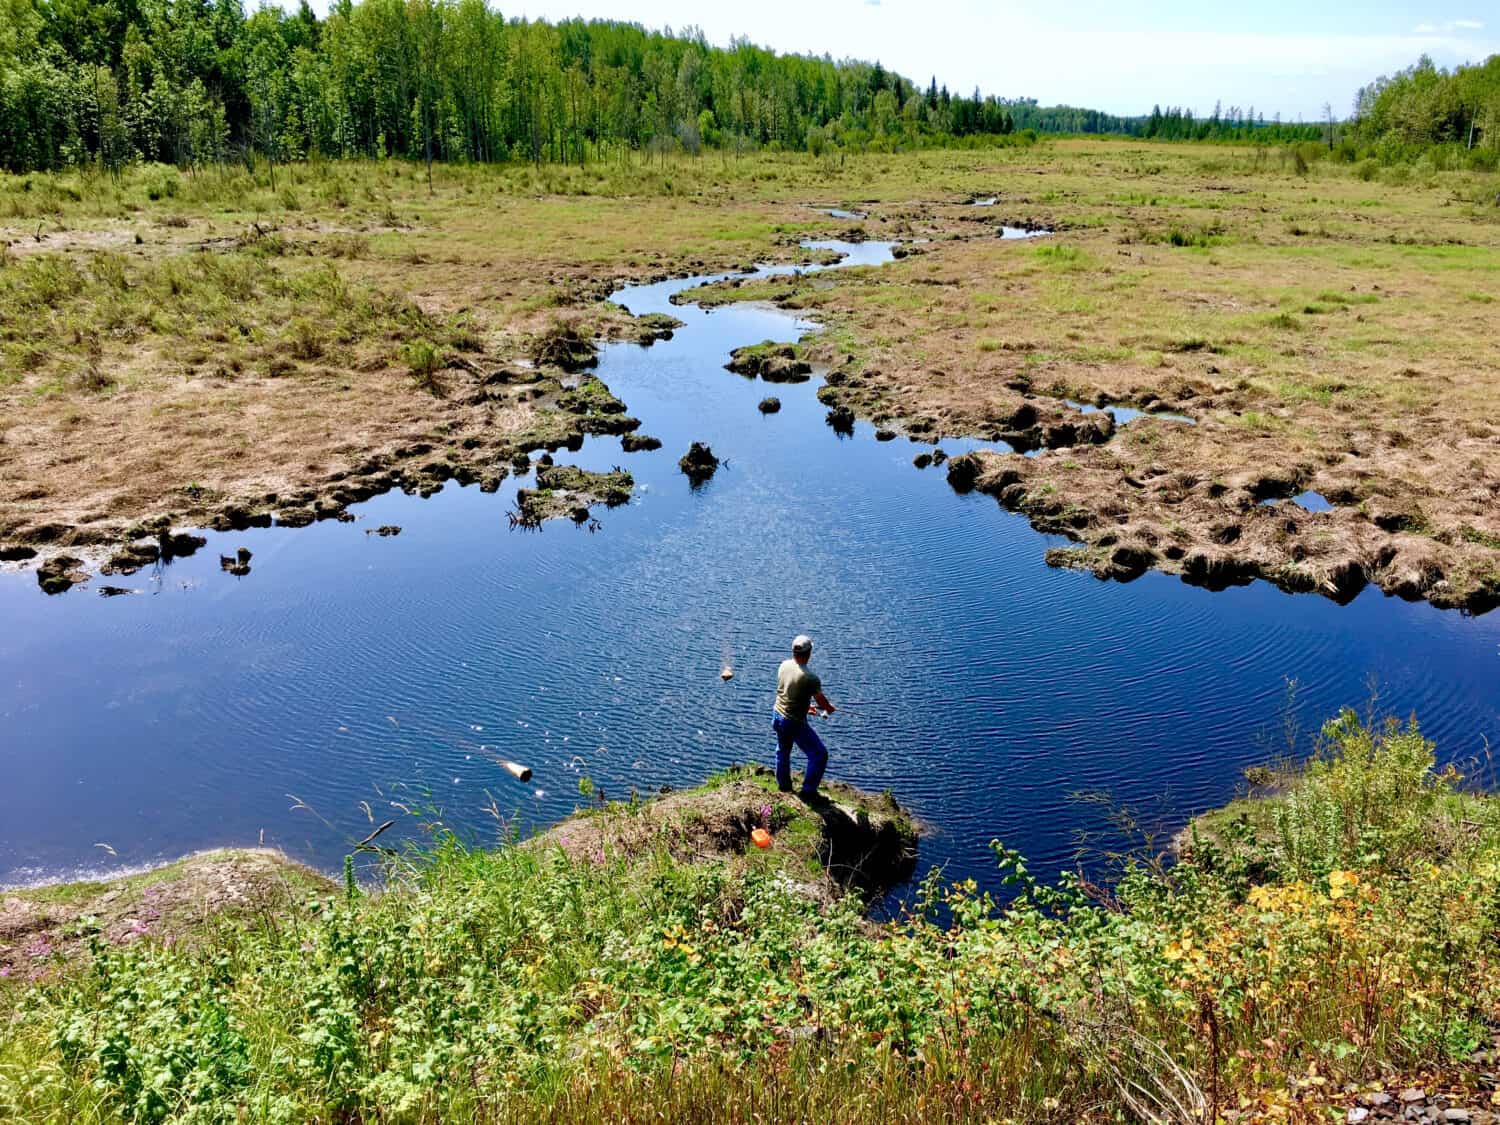
Fishing’s popularity as a pastime is partially attributable to its accessibility. The United States has more than 95,000 miles of shoreline along oceans and the Great Lakes, according to the National Oceanic and Atmospheric Administration — and with over 3.5 million miles of rivers and tributaries nationwide, most of the population lives within a mile of a river or stream.
With easy access to fishing opportunities, most Americans do not need to travel far to cast a line. Of the nearly 42 million fishing licenses, tags, permits, and stamps that were issued in 2022, over 75% were issued to in-state residents. Still, in a country as large and ecologically diverse as the United States, anglers who are willing to travel have many more options. Whether for their fishing laws, the variety and abundance of species, or specific bodies of water, certain states stand out as especially popular fishing destinations.
Using data from the U.S. FWS, 24/7 Wall St. identified the most popular fishing destinations in America. We ranked all 50 states on the number of paid fishing licenses, tags, permits, and stamps issued to visitors from out-of-state in 2022.
Depending on the state, the number of fishing authorizations granted to out-of-staters in 2022 ranges from fewer than 900 to over 900,000. Freshwater fishing is far more common in the U.S. than saltwater fishing, and many of the lowest ranking states on this list are located along the Atlantic or Pacific Coasts. These places include several New England and Mid-Atlantic States, as well as Hawaii, where fishing is not as strictly regulated, and in many cases, licenses and permits are not required.
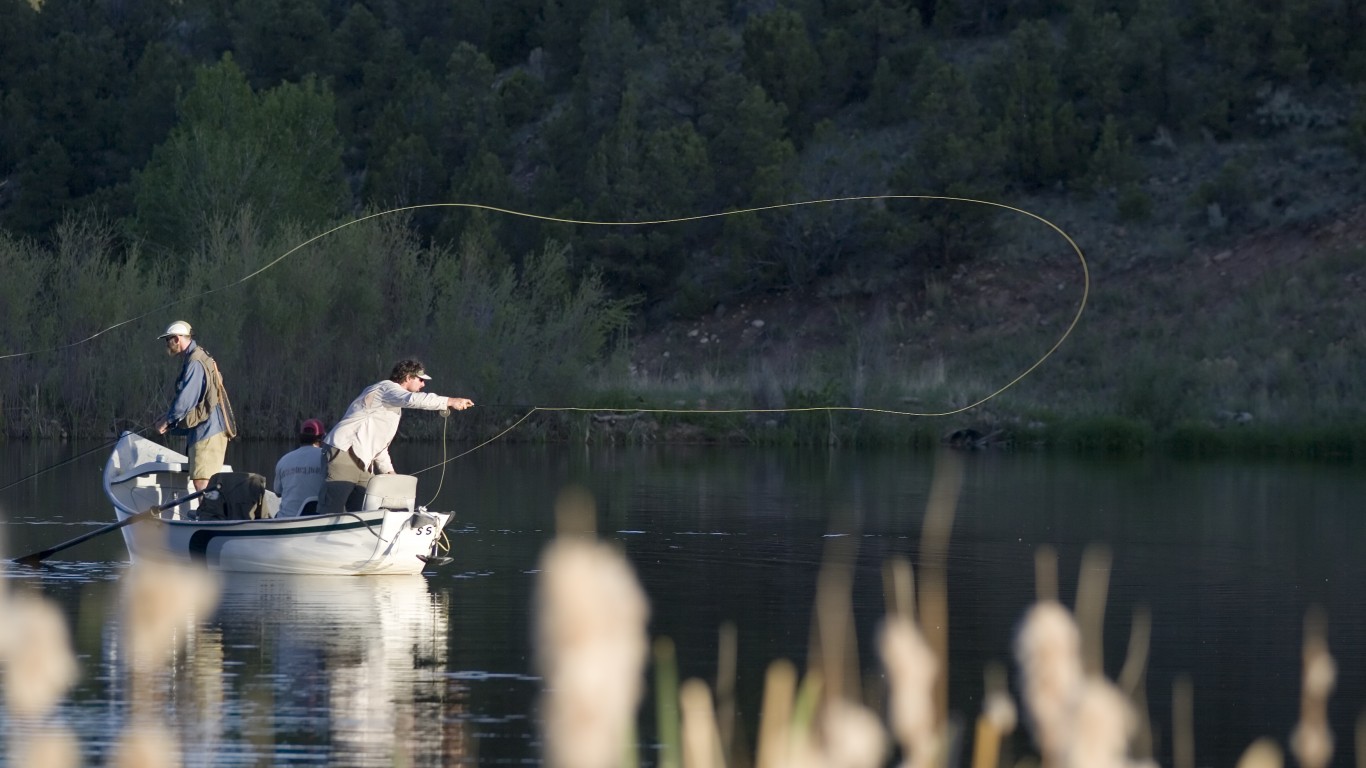
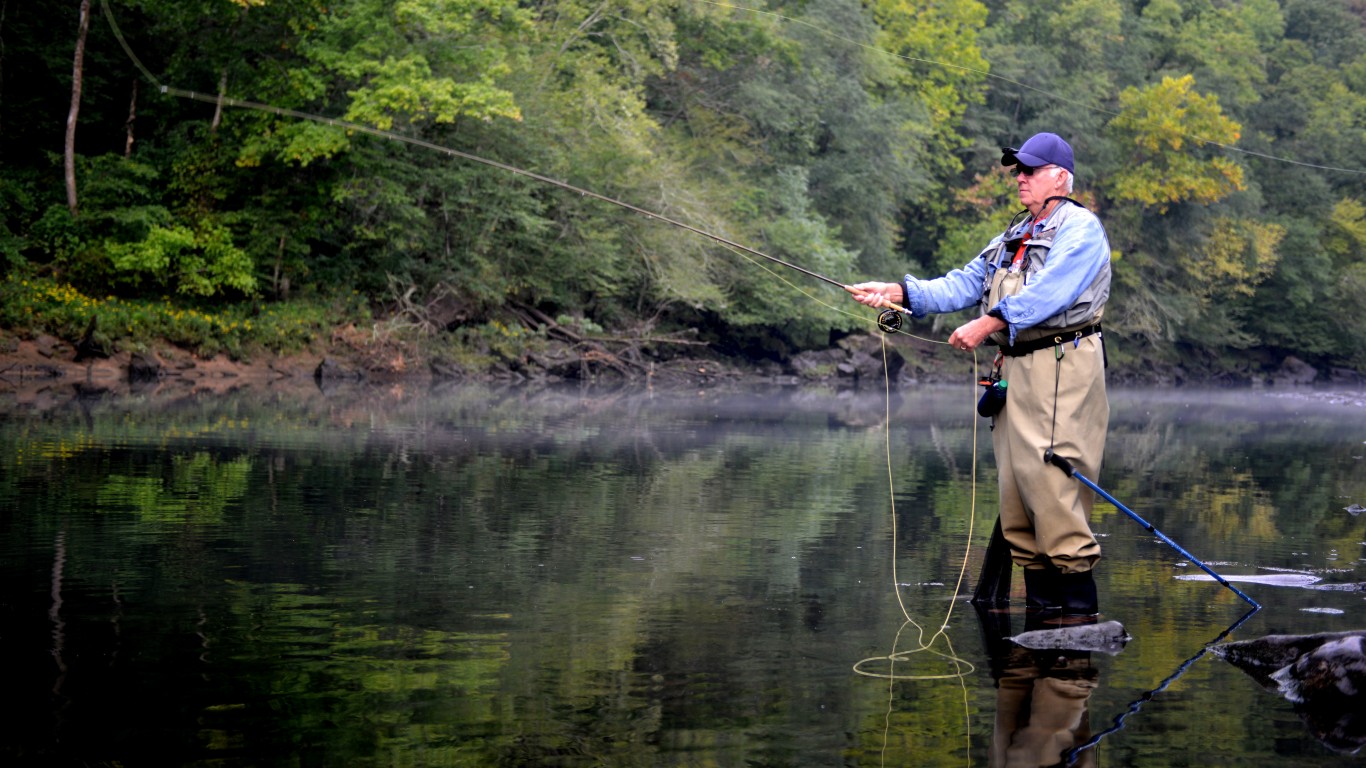
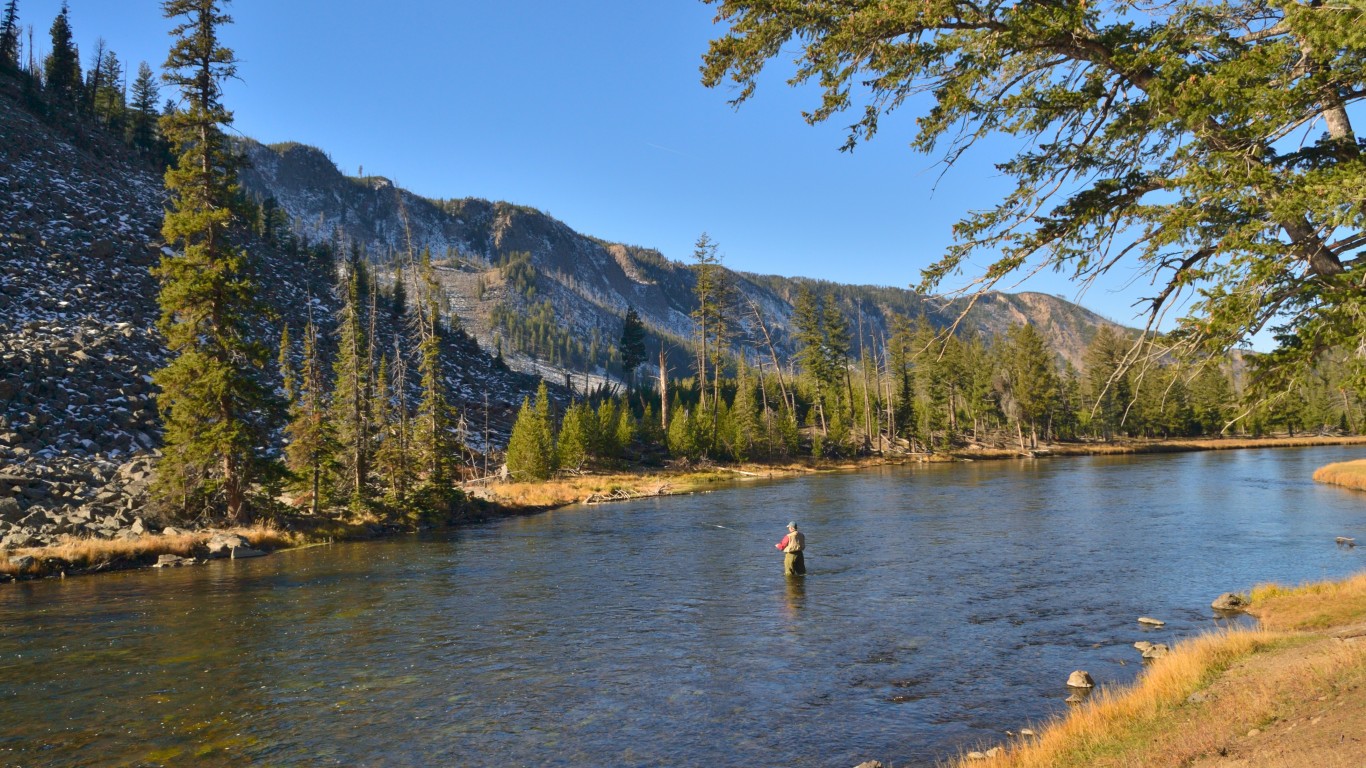
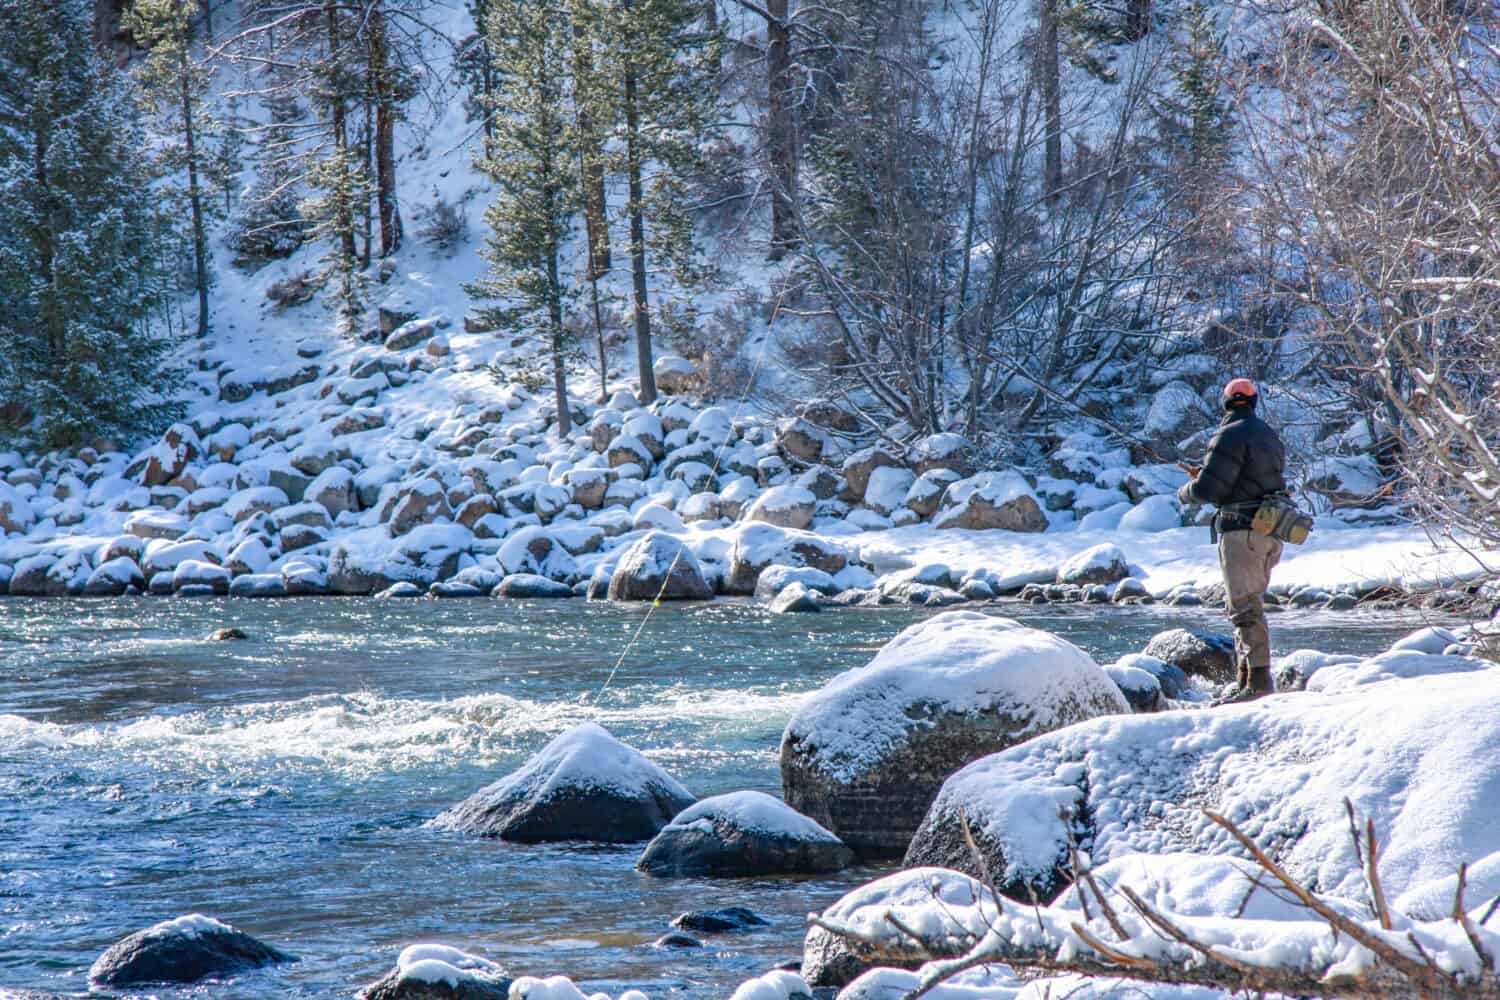
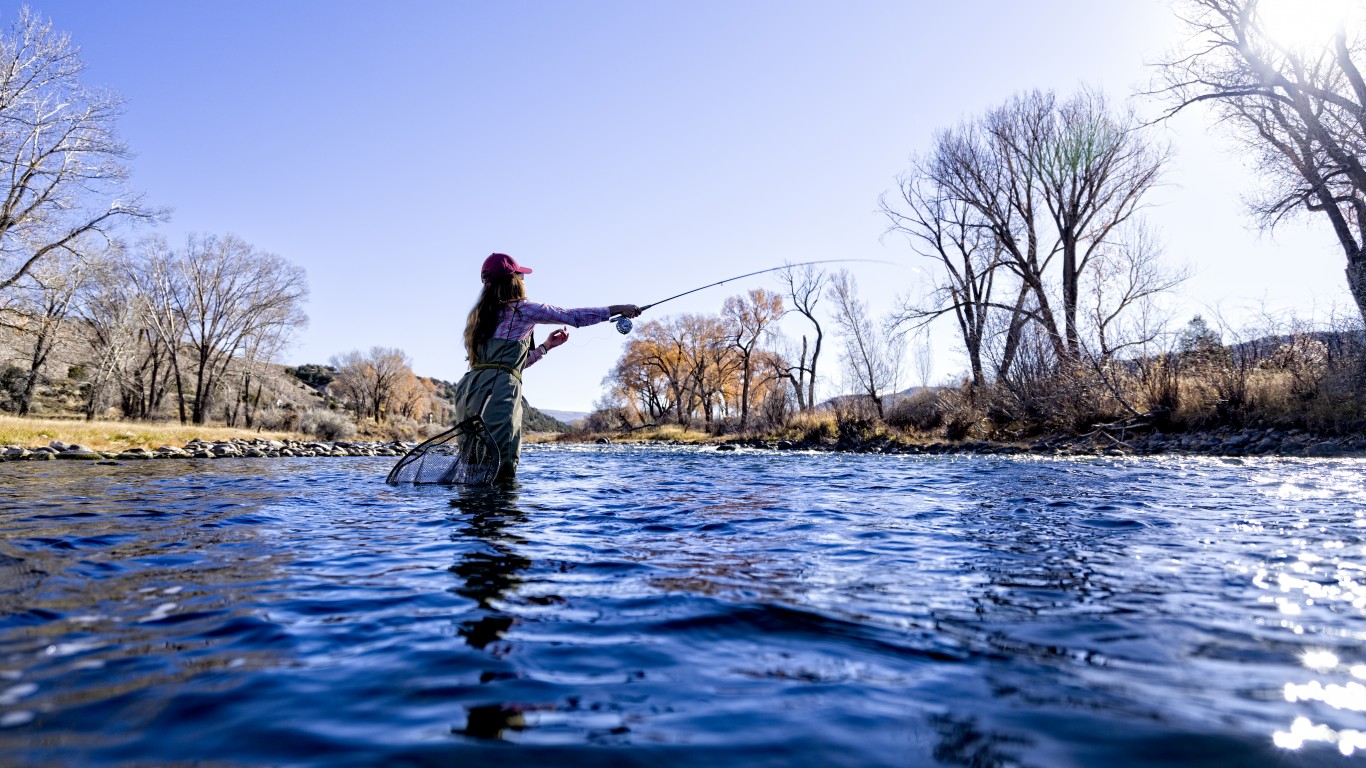
Meanwhile, some of the highest ranking states on this list have hundreds, if not thousands, of miles of coastline along an ocean or Great Lake, in addition to thousands of square miles of inland freshwater. Notably, several landlocked Western states where freshwater accounts for less than 2% of the total surface area rank highly on this list. Despite relatively limited access to fishing opportunities, states like Colorado and Montana have some of the best fly-fishing in the country, and sell hundreds of thousands of non-resident fishing licenses each year. (Here is a look at some of the biggest fish ever caught by state.)
Why It Matters
Not only a popular pastime, fishing is also big business in the United States. According to the FWS, the 50 states reported a combined $898 million in fishing license, tag, permit, and stamp sales in 2022 — and over 30% of that revenue came from out-of-state residents. All told, Americans spent a reported $99.4 billion on fishing in 2022, including $36.6 billion in trip related expenditures.
50. Hawaii

- Non-resident fishing licenses, tags, permits, & stamps issued, 2022: 883 (0.0% of all non-resident fishing permits issued nationwide)
- Non-resident fishing license, tag, permit, & stamp sales, 2022: $10,235 (40.1% of all fishing permit revenue in Hawaii)
- State surface area covered by water: 4,509 square miles (41.2% of surface area — 2nd highest of 50 states)
- Shoreline (Great Lakes and oceans): 1,052 miles
49. Connecticut

- Non-resident fishing licenses, tags, permits, & stamps issued, 2022: 23,636 (0.3% of all non-resident fishing permits issued nationwide)
- Non-resident fishing license, tag, permit, & stamp sales, 2022: $691,035 (15.3% of all fishing permit revenue in Connecticut)
- State surface area covered by water: 701 square miles (12.6% of surface area — 14th highest of 50 states)
- Shoreline (Great Lakes and oceans): 618 miles
48. New Jersey
 by Tony Fischer Photography")
- Non-resident fishing licenses, tags, permits, & stamps issued, 2022: 30,655 (0.3% of all non-resident fishing permits issued nationwide)
- Non-resident fishing license, tag, permit, & stamp sales, 2022: $782,354 (13.5% of all fishing permit revenue in New Jersey)
- State surface area covered by water: 1,368 square miles (15.7% of surface area — 10th highest of 50 states)
- Shoreline (Great Lakes and oceans): 1,792 miles
47. Rhode Island

- Non-resident fishing licenses, tags, permits, & stamps issued, 2022: 37,418 (0.4% of all non-resident fishing permits issued nationwide)
- Non-resident fishing license, tag, permit, & stamp sales, 2022: $139,348 (15.9% of all fishing permit revenue in Rhode Island)
- State surface area covered by water: 511 square miles (33.1% of surface area — 3rd highest of 50 states)
- Shoreline (Great Lakes and oceans): 384 miles
46. Vermont
- Non-resident fishing licenses, tags, permits, & stamps issued, 2022: 45,323 (0.5% of all non-resident fishing permits issued nationwide)
- Non-resident fishing license, tag, permit, & stamp sales, 2022: $1,709,014 (40.8% of all fishing permit revenue in Vermont)
- State surface area covered by water: 400 square miles (4.2% of surface area — 23rd highest of 50 states)
- Shoreline (Great Lakes and oceans): 00 miles
45. Delaware

- Non-resident fishing licenses, tags, permits, & stamps issued, 2022: 47,817 (0.5% of all non-resident fishing permits issued nationwide)
- Non-resident fishing license, tag, permit, & stamp sales, 2022: $909,765 (58.0% of all fishing permit revenue in Delaware)
- State surface area covered by water: 540 square miles (21.7% of surface area — 6th highest of 50 states)
- Shoreline (Great Lakes and oceans): 381 miles
44. Massachusetts
- Non-resident fishing licenses, tags, permits, & stamps issued, 2022: 50,101 (0.5% of all non-resident fishing permits issued nationwide)
- Non-resident fishing license, tag, permit, & stamp sales, 2022: $785,093 (11.3% of all fishing permit revenue in Massachusetts)
- State surface area covered by water: 2,754 square miles (26.1% of surface area — 4th highest of 50 states)
- Shoreline (Great Lakes and oceans): 1,519 miles
43. Kansas

- Non-resident fishing licenses, tags, permits, & stamps issued, 2022: 51,805 (0.6% of all non-resident fishing permits issued nationwide)
- Non-resident fishing license, tag, permit, & stamp sales, 2022: $1,503,228 (22.5% of all fishing permit revenue in Kansas)
- State surface area covered by water: 520 square miles (0.6% of surface area — 4th lowest of 50 states)
- Shoreline (Great Lakes and oceans): 00 miles
42. Indiana

- Non-resident fishing licenses, tags, permits, & stamps issued, 2022: 59,736 (0.6% of all non-resident fishing permits issued nationwide)
- Non-resident fishing license, tag, permit, & stamp sales, 2022: $1,452,688 (18.4% of all fishing permit revenue in Indiana)
- State surface area covered by water: 593 square miles (1.6% of surface area — 13th lowest of 50 states)
- Shoreline (Great Lakes and oceans): 45 miles
41. Nevada

- Non-resident fishing licenses, tags, permits, & stamps issued, 2022: 60,383 (0.6% of all non-resident fishing permits issued nationwide)
- Non-resident fishing license, tag, permit, & stamp sales, 2022: $2,226,484 (40.7% of all fishing permit revenue in Nevada)
- State surface area covered by water: 791 square miles (0.7% of surface area — 6th lowest of 50 states)
- Shoreline (Great Lakes and oceans): 00 miles
40. New Hampshire

- Non-resident fishing licenses, tags, permits, & stamps issued, 2022: 60,982 (0.7% of all non-resident fishing permits issued nationwide)
- Non-resident fishing license, tag, permit, & stamp sales, 2022: $2,442,326 (33.0% of all fishing permit revenue in New Hampshire)
- State surface area covered by water: 397 square miles (4.2% of surface area — 22nd highest of 50 states)
- Shoreline (Great Lakes and oceans): 131 miles
39. Iowa
- Non-resident fishing licenses, tags, permits, & stamps issued, 2022: 62,449 (0.7% of all non-resident fishing permits issued nationwide)
- Non-resident fishing license, tag, permit, & stamp sales, 2022: $1,919,747 (19.2% of all fishing permit revenue in Iowa)
- State surface area covered by water: 416 square miles (0.7% of surface area — 8th lowest of 50 states)
- Shoreline (Great Lakes and oceans): 00 miles
38. Illinois

- Non-resident fishing licenses, tags, permits, & stamps issued, 2022: 62,997 (0.7% of all non-resident fishing permits issued nationwide)
- Non-resident fishing license, tag, permit, & stamp sales, 2022: $1,368,181 (16.4% of all fishing permit revenue in Illinois)
- State surface area covered by water: 2,395 square miles (4.1% of surface area — 24th highest of 50 states)
- Shoreline (Great Lakes and oceans): 63 miles
37. North Dakota
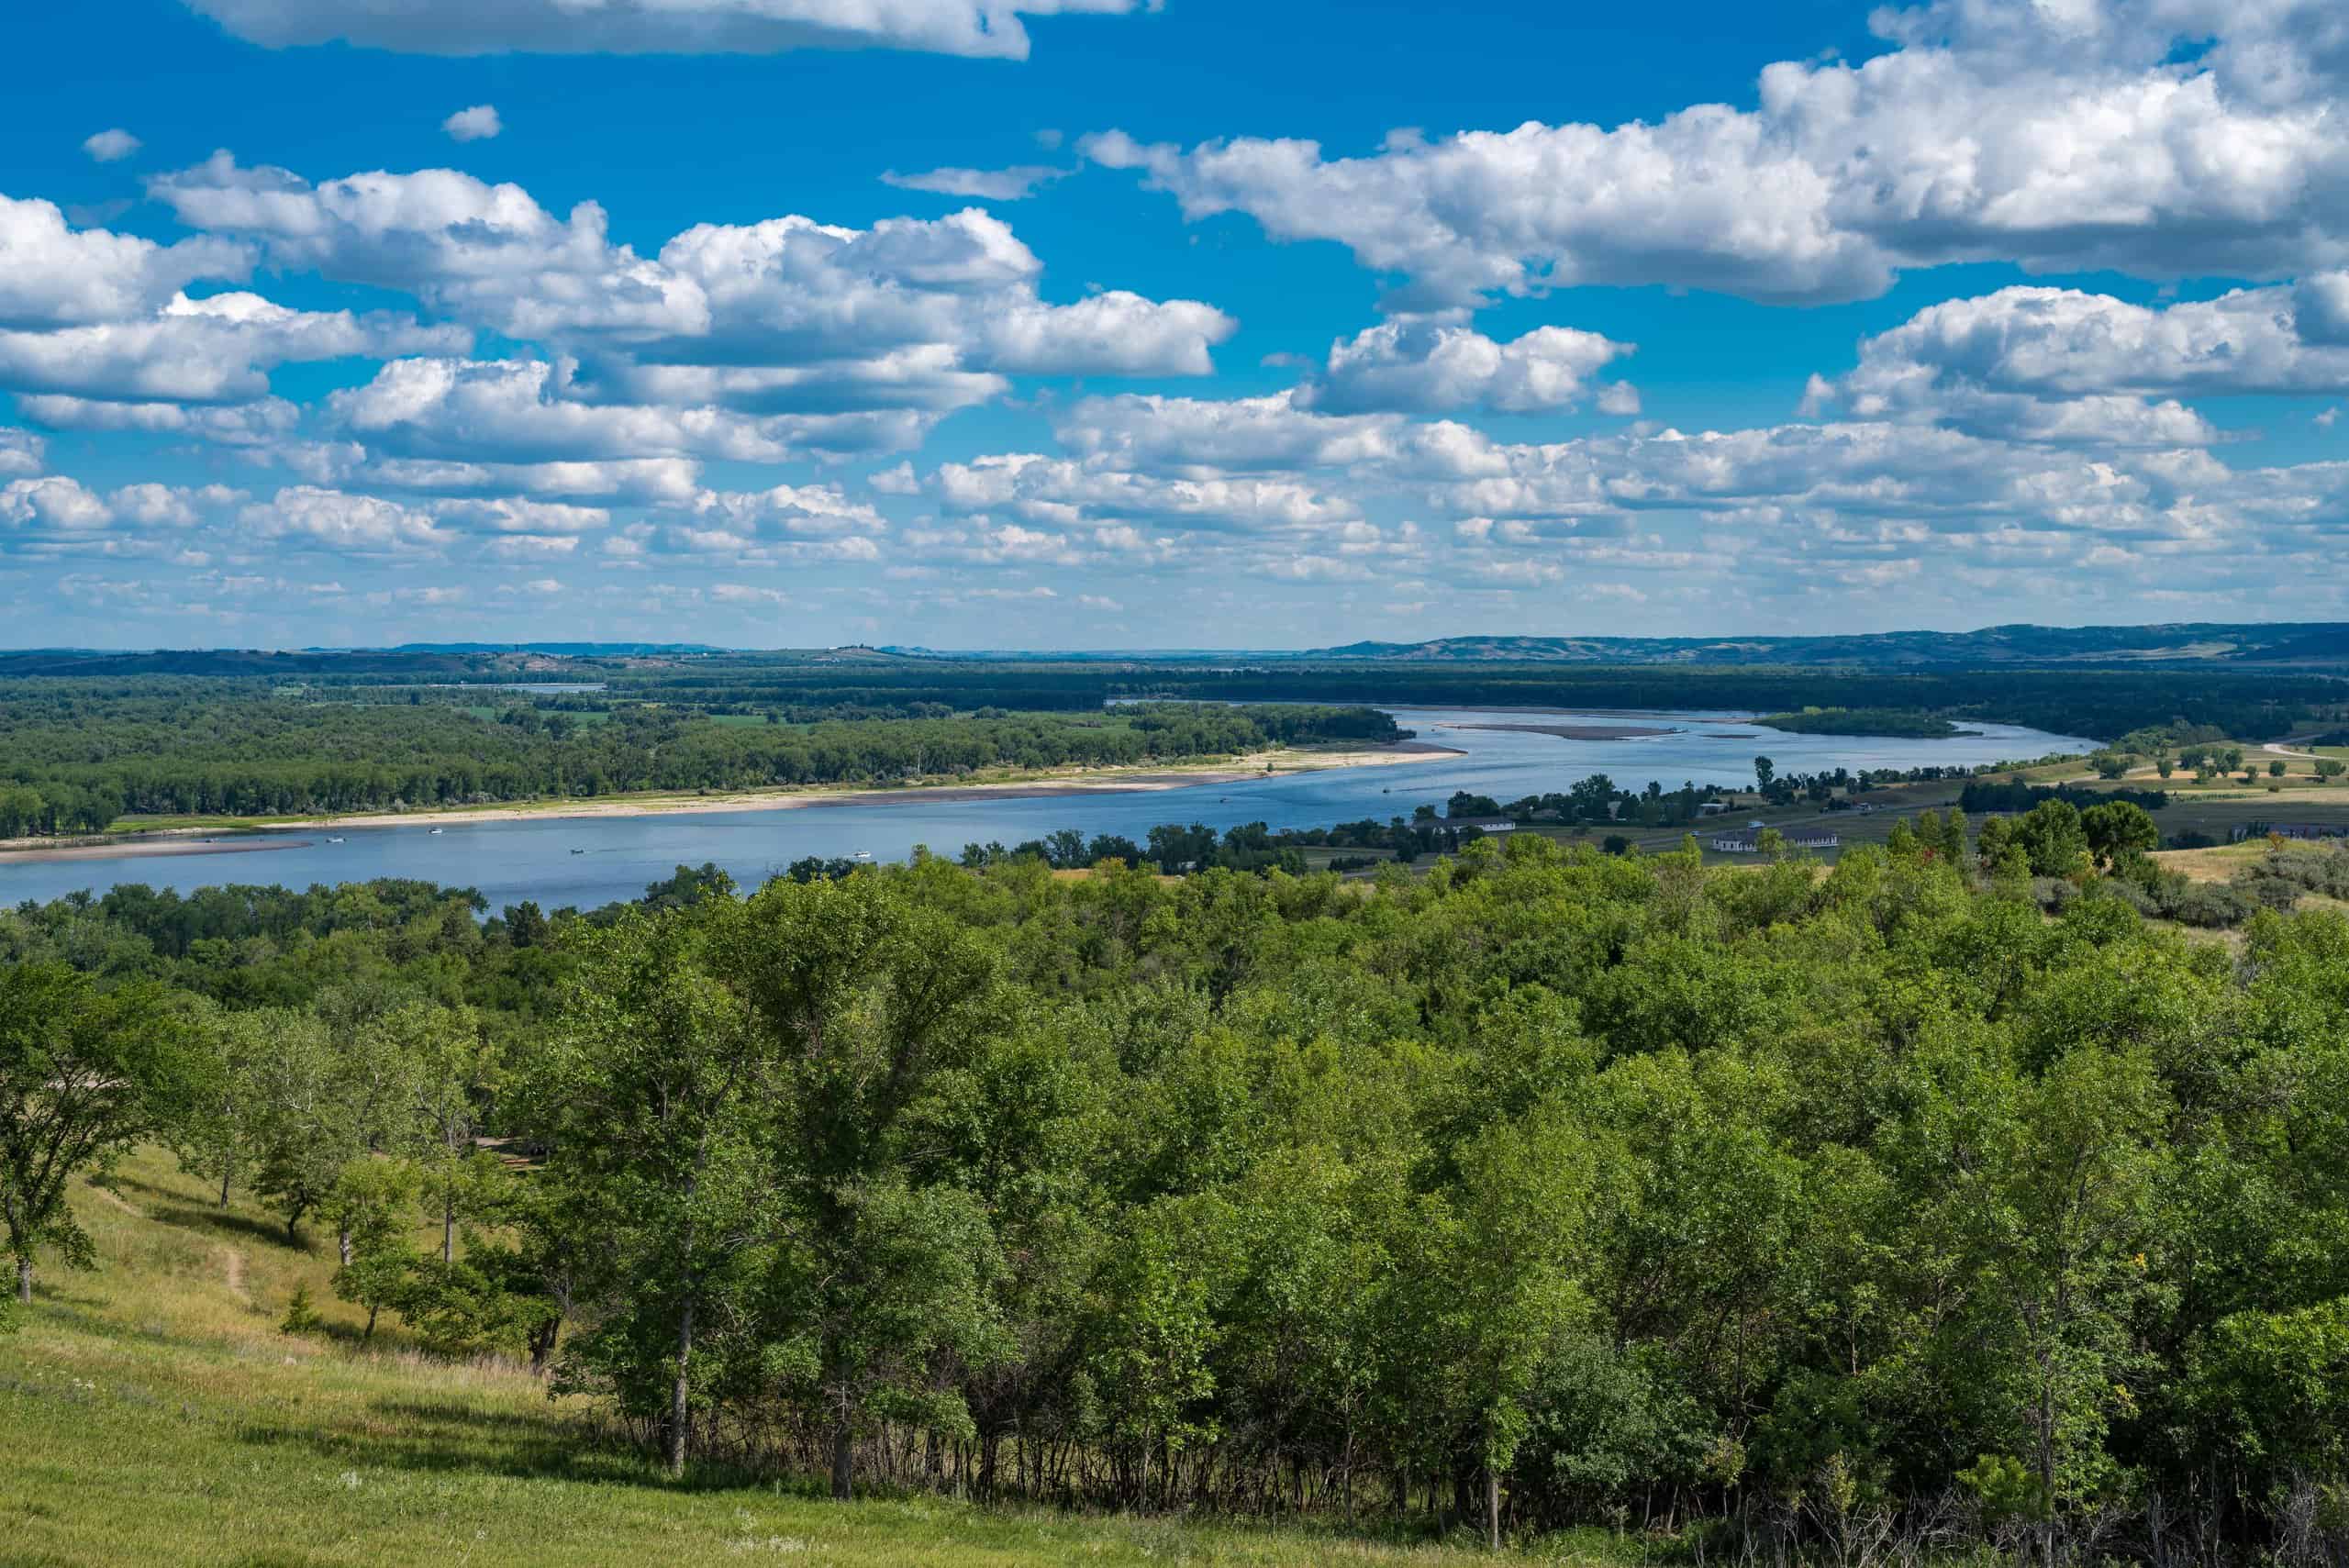
- Non-resident fishing licenses, tags, permits, & stamps issued, 2022: 64,712 (0.7% of all non-resident fishing permits issued nationwide)
- Non-resident fishing license, tag, permit, & stamp sales, 2022: $2,125,096 (52.8% of all fishing permit revenue in North Dakota)
- State surface area covered by water: 1,698 square miles (2.4% of surface area — 19th lowest of 50 states)
- Shoreline (Great Lakes and oceans): 00 miles
36. Mississippi
- Non-resident fishing licenses, tags, permits, & stamps issued, 2022: 72,959 (0.8% of all non-resident fishing permits issued nationwide)
- Non-resident fishing license, tag, permit, & stamp sales, 2022: $1,928,031 (30.5% of all fishing permit revenue in Mississippi)
- State surface area covered by water: 1,509 square miles (3.1% of surface area — 23rd lowest of 50 states)
- Shoreline (Great Lakes and oceans): 359 miles
35. Nebraska
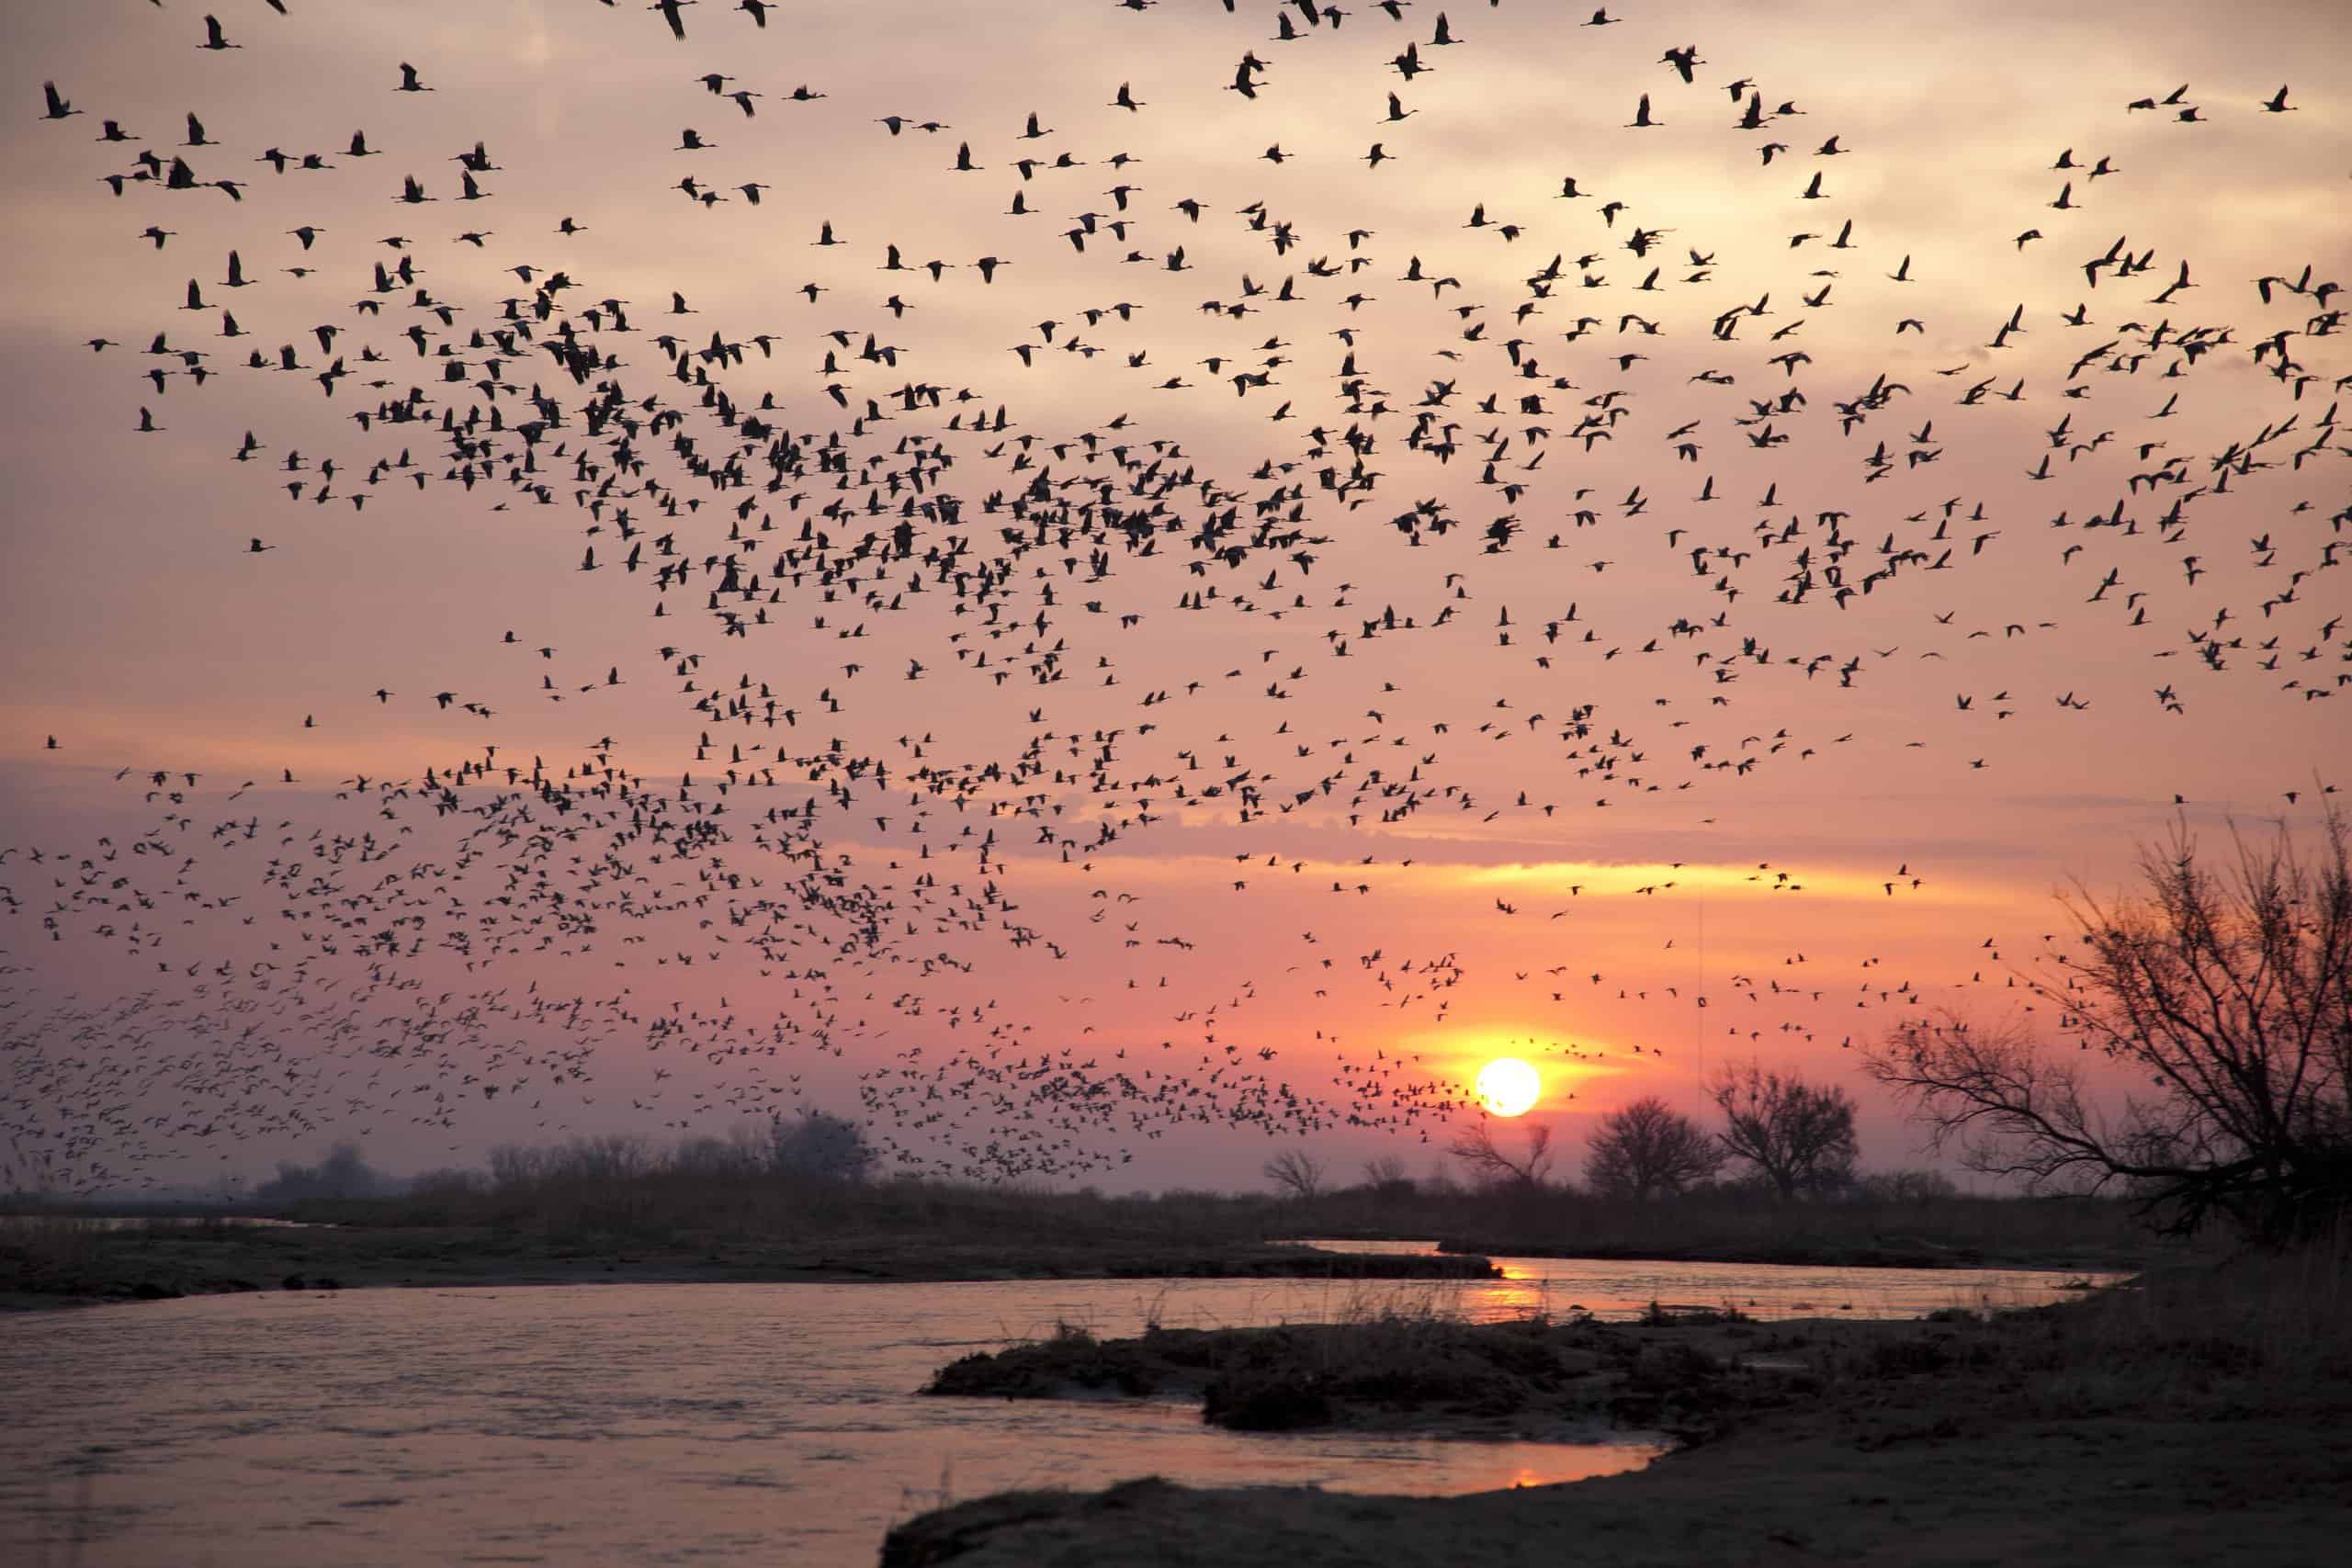
- Non-resident fishing licenses, tags, permits, & stamps issued, 2022: 76,675 (0.8% of all non-resident fishing permits issued nationwide)
- Non-resident fishing license, tag, permit, & stamp sales, 2022: $1,464,818 (18.3% of all fishing permit revenue in Nebraska)
- State surface area covered by water: 524 square miles (0.7% of surface area — 5th lowest of 50 states)
- Shoreline (Great Lakes and oceans): 00 miles
34. Kentucky

- Non-resident fishing licenses, tags, permits, & stamps issued, 2022: 85,347 (0.9% of all non-resident fishing permits issued nationwide)
- Non-resident fishing license, tag, permit, & stamp sales, 2022: $2,948,335 (25.9% of all fishing permit revenue in Kentucky)
- State surface area covered by water: 921 square miles (2.3% of surface area — 18th lowest of 50 states)
- Shoreline (Great Lakes and oceans): 00 miles
33. Maine

- Non-resident fishing licenses, tags, permits, & stamps issued, 2022: 92,604 (1.0% of all non-resident fishing permits issued nationwide)
- Non-resident fishing license, tag, permit, & stamp sales, 2022: $3,786,355 (40.3% of all fishing permit revenue in Maine)
- State surface area covered by water: 4,537 square miles (12.8% of surface area — 13th highest of 50 states)
- Shoreline (Great Lakes and oceans): 3,478 miles
32. Maryland
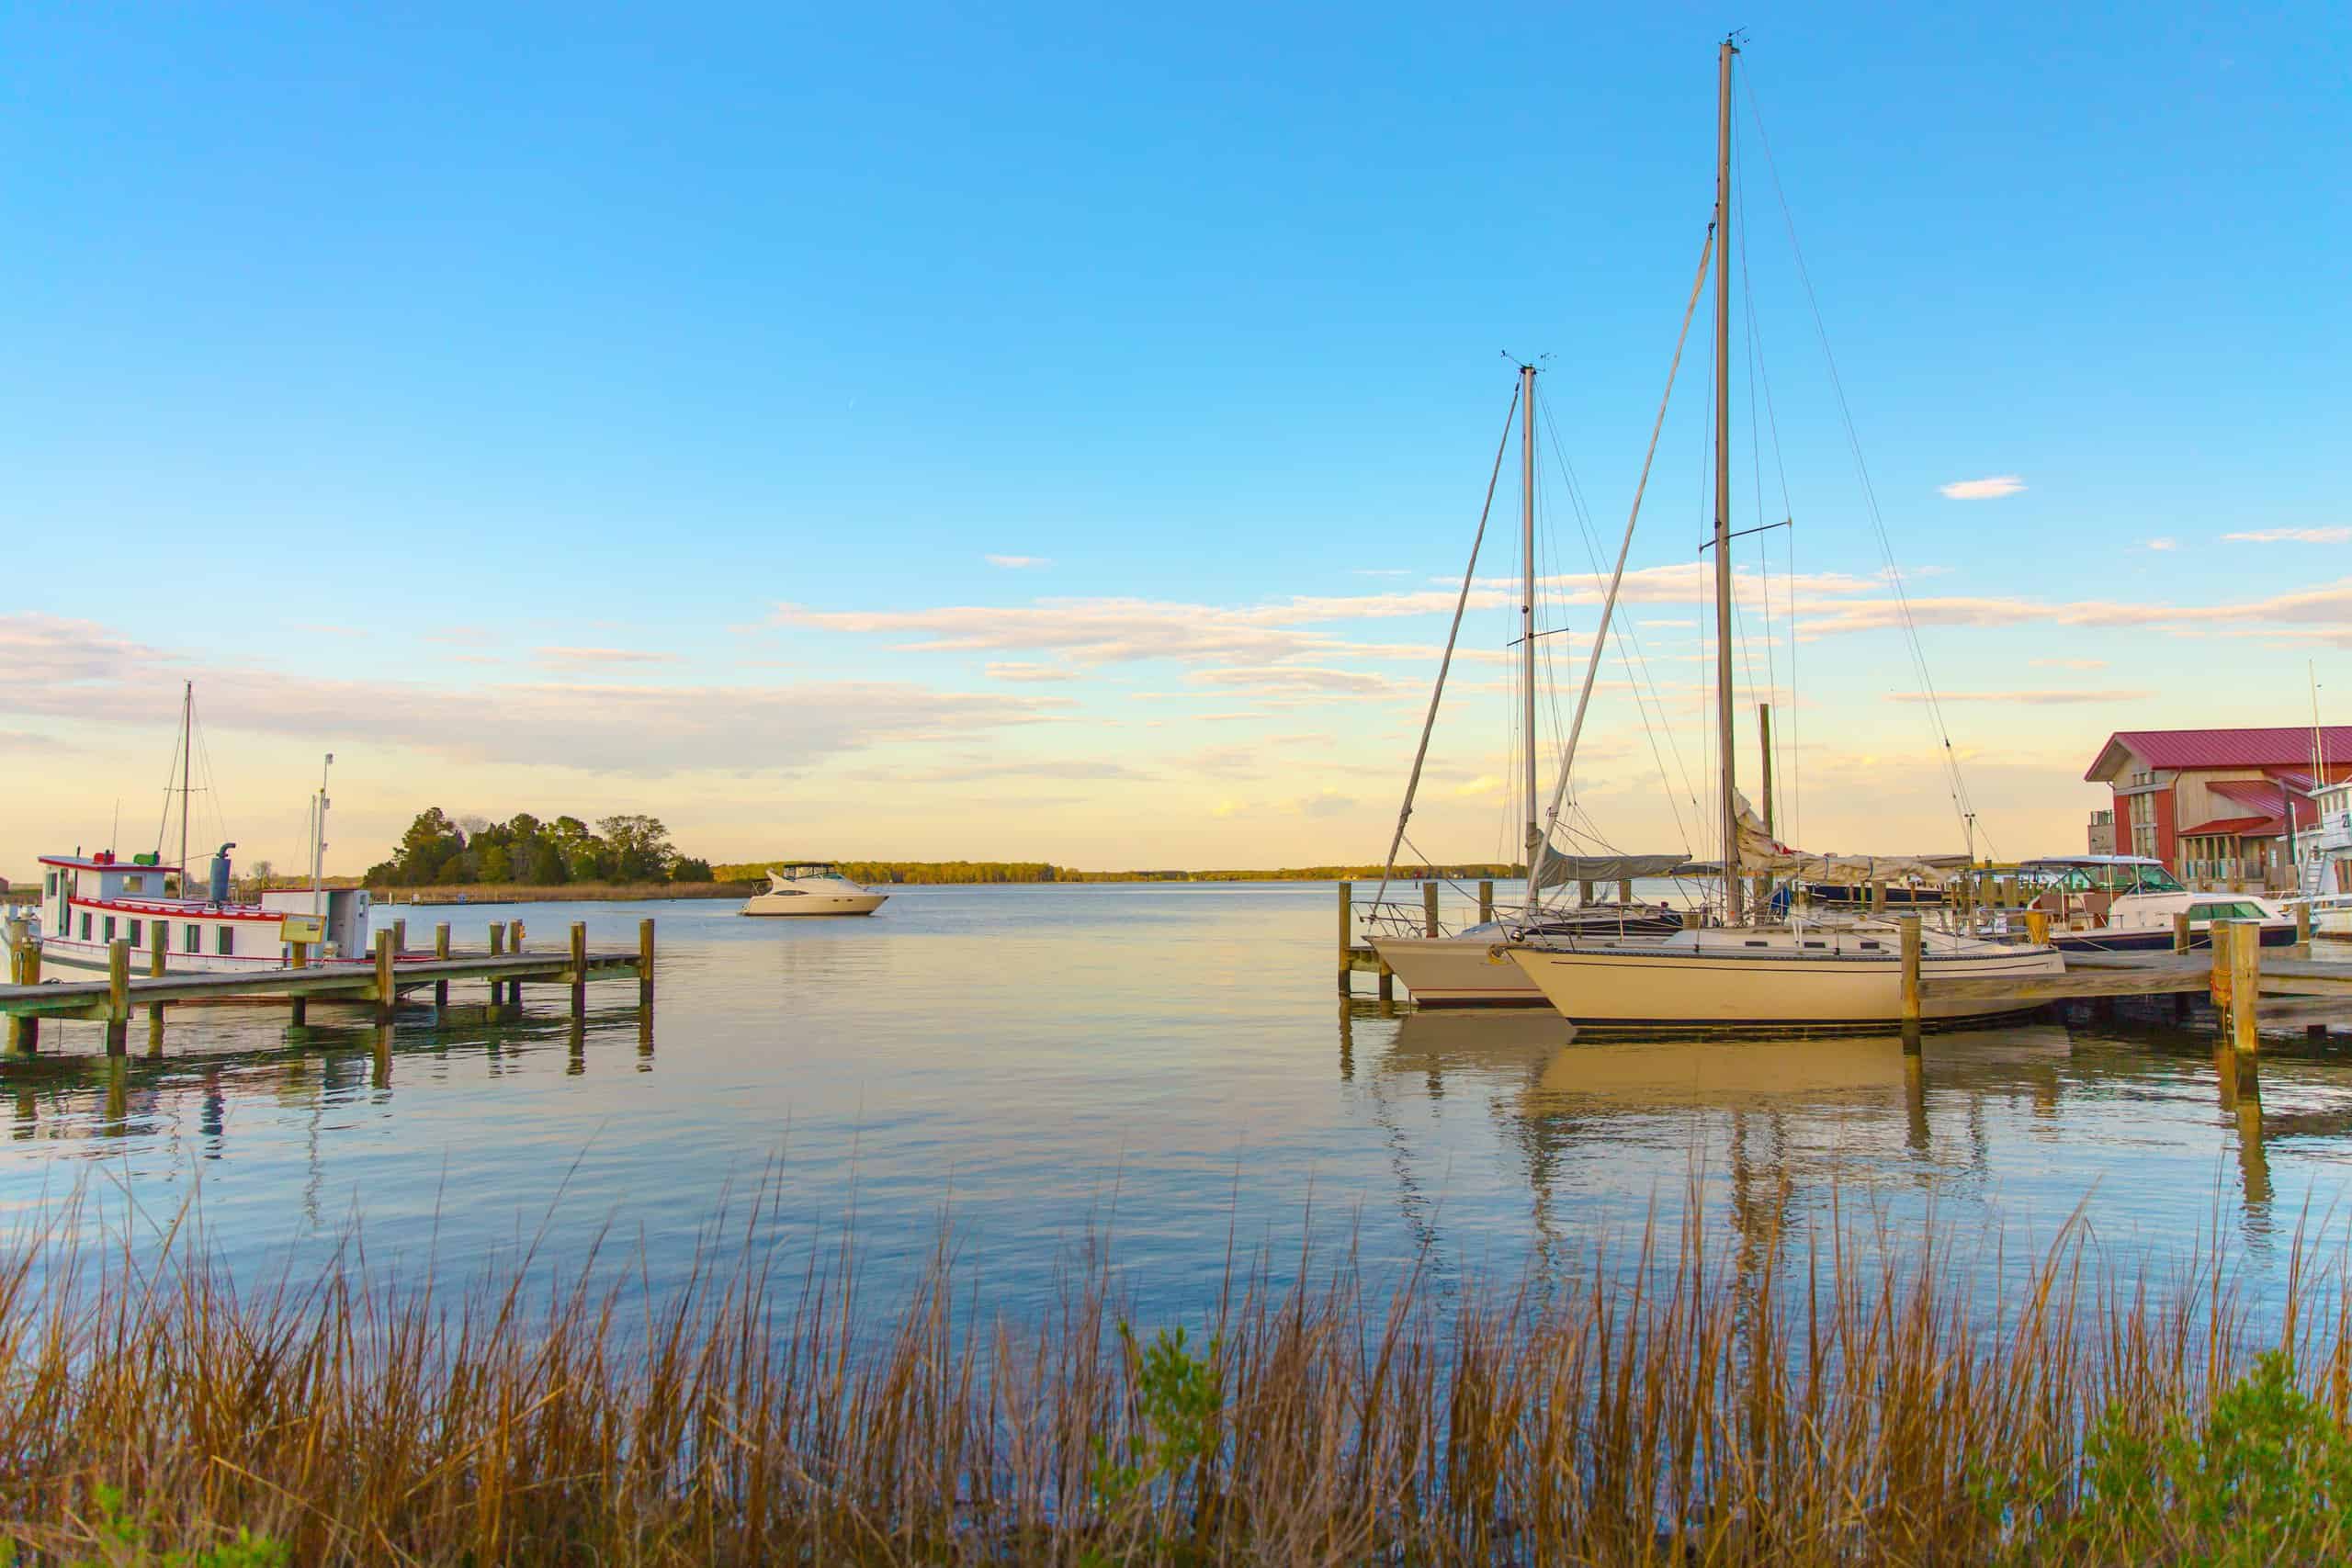
- Non-resident fishing licenses, tags, permits, & stamps issued, 2022: 99,405 (1.1% of all non-resident fishing permits issued nationwide)
- Non-resident fishing license, tag, permit, & stamp sales, 2022: $2,471,464 (27.8% of all fishing permit revenue in Maryland)
- State surface area covered by water: 2,699 square miles (21.8% of surface area — 5th highest of 50 states)
- Shoreline (Great Lakes and oceans): 3,190 miles
31. Oklahoma
- Non-resident fishing licenses, tags, permits, & stamps issued, 2022: 101,449 (1.1% of all non-resident fishing permits issued nationwide)
- Non-resident fishing license, tag, permit, & stamp sales, 2022: $5,132,426 (39.3% of all fishing permit revenue in Oklahoma)
- State surface area covered by water: 1,304 square miles (1.9% of surface area — 15th lowest of 50 states)
- Shoreline (Great Lakes and oceans): 00 miles
30. Virginia

- Non-resident fishing licenses, tags, permits, & stamps issued, 2022: 101,835 (1.1% of all non-resident fishing permits issued nationwide)
- Non-resident fishing license, tag, permit, & stamp sales, 2022: $2,872,300 (10.1% of all fishing permit revenue in Virginia)
- State surface area covered by water: 3,285 square miles (7.7% of surface area — 18th highest of 50 states)
- Shoreline (Great Lakes and oceans): 3,315 miles
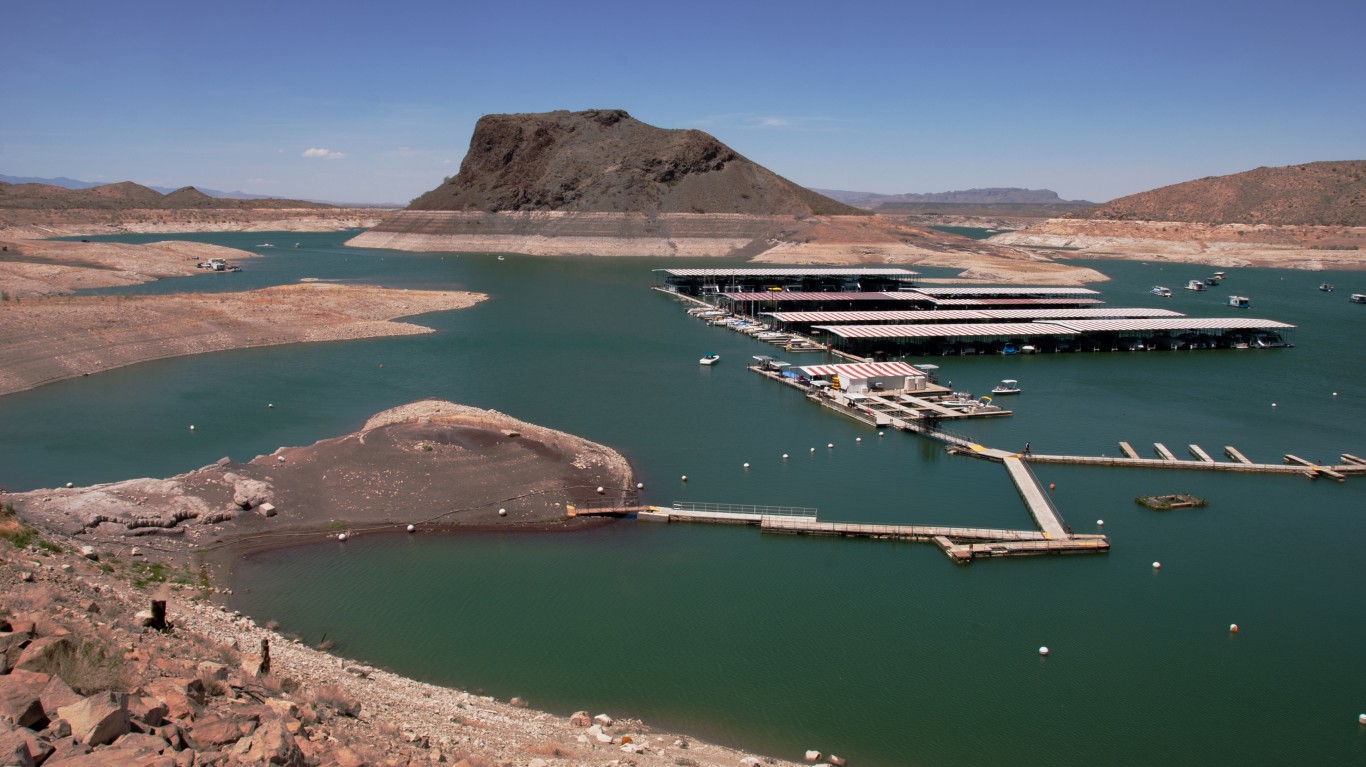
29. Arizona
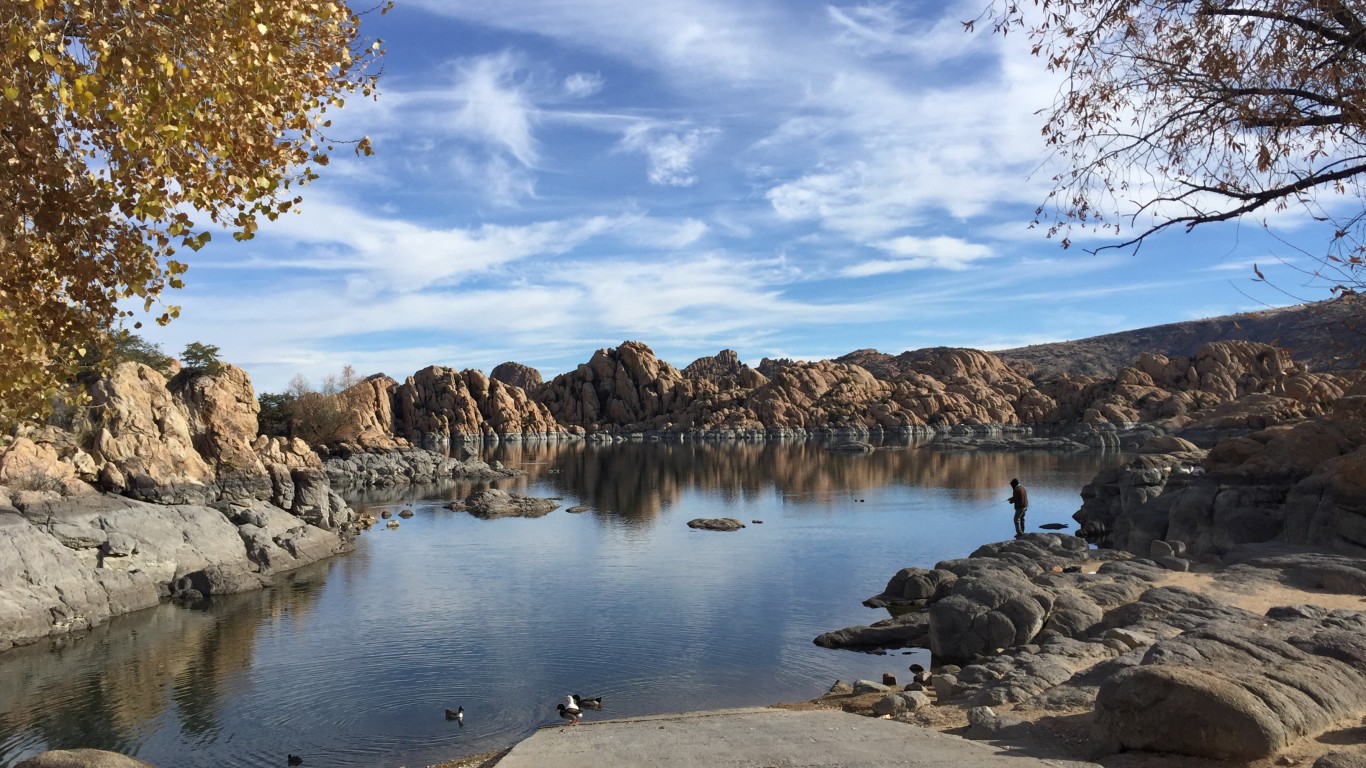
- Non-resident fishing licenses, tags, permits, & stamps issued, 2022: 104,021 (1.1% of all non-resident fishing permits issued nationwide)
- Non-resident fishing license, tag, permit, & stamp sales, 2022: $5,233,677 (36.3% of all fishing permit revenue in Arizona)
- State surface area covered by water: 396 square miles (0.3% of surface area — 2nd lowest of 50 states)
- Shoreline (Great Lakes and oceans): 00 miles
28. South Dakota
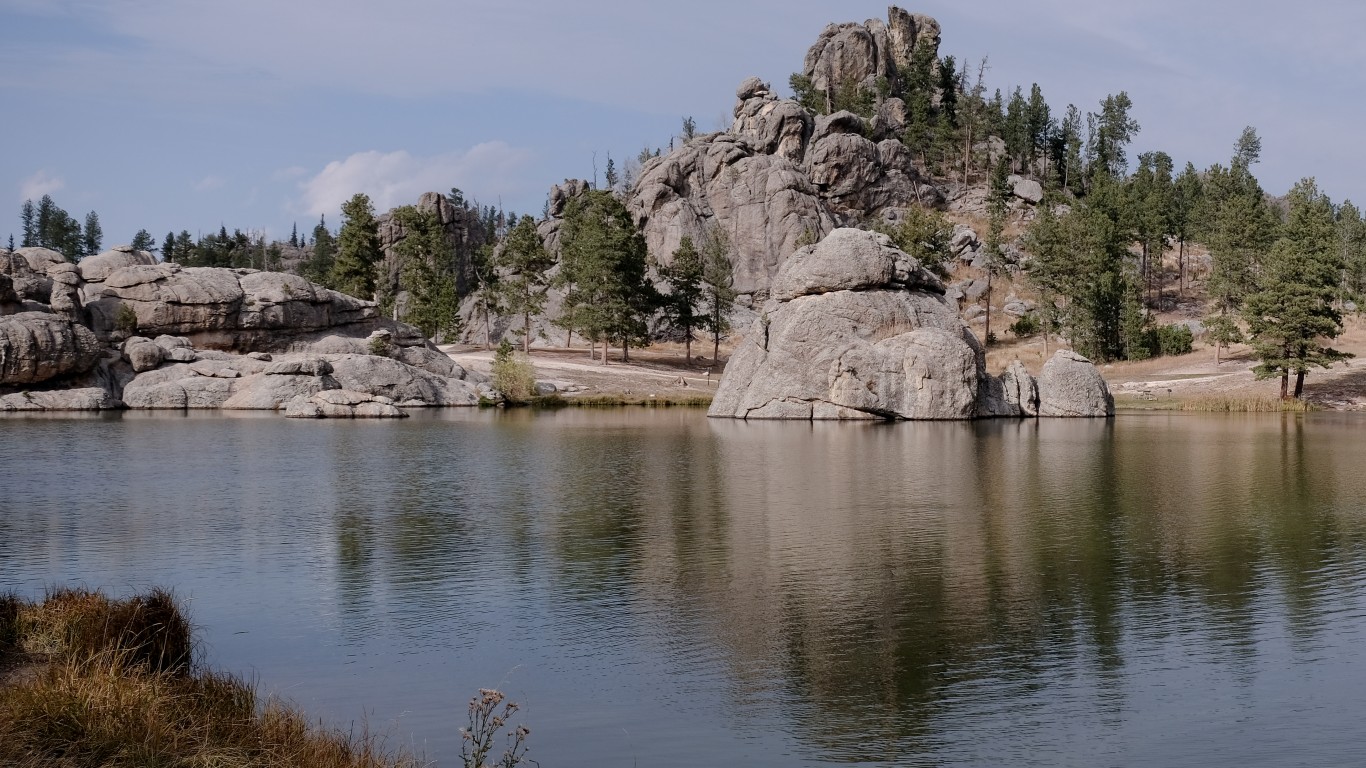
- Non-resident fishing licenses, tags, permits, & stamps issued, 2022: 104,949 (1.1% of all non-resident fishing permits issued nationwide)
- Non-resident fishing license, tag, permit, & stamp sales, 2022: $4,147,645 (55.0% of all fishing permit revenue in South Dakota)
- State surface area covered by water: 1,305 square miles (1.7% of surface area — 14th lowest of 50 states)
- Shoreline (Great Lakes and oceans): 00 miles
27. Ohio

- Non-resident fishing licenses, tags, permits, & stamps issued, 2022: 136,204 (1.5% of all non-resident fishing permits issued nationwide)
- Non-resident fishing license, tag, permit, & stamp sales, 2022: $3,659,818 (18.3% of all fishing permit revenue in Ohio)
- State surface area covered by water: 3,965 square miles (8.8% of surface area — 16th highest of 50 states)
- Shoreline (Great Lakes and oceans): 312 miles
26. Utah

- Non-resident fishing licenses, tags, permits, & stamps issued, 2022: 140,144 (1.5% of all non-resident fishing permits issued nationwide)
- Non-resident fishing license, tag, permit, & stamp sales, 2022: $4,408,110 (25.5% of all fishing permit revenue in Utah)
- State surface area covered by water: 2,727 square miles (3.2% of surface area — 24th lowest of 50 states)
- Shoreline (Great Lakes and oceans): 00 miles
25. Pennsylvania

- Non-resident fishing licenses, tags, permits, & stamps issued, 2022: 141,671 (1.5% of all non-resident fishing permits issued nationwide)
- Non-resident fishing license, tag, permit, & stamp sales, 2022: $4,559,128 (15.0% of all fishing permit revenue in Pennsylvania)
- State surface area covered by water: 1,312 square miles (2.8% of surface area — 22nd lowest of 50 states)
- Shoreline (Great Lakes and oceans): 140 miles
24. California

- Non-resident fishing licenses, tags, permits, & stamps issued, 2022: 153,944 (1.6% of all non-resident fishing permits issued nationwide)
- Non-resident fishing license, tag, permit, & stamp sales, 2022: $4,889,261 (6.4% of all fishing permit revenue in California)
- State surface area covered by water: 7,916 square miles (4.8% of surface area — 21st highest of 50 states)
- Shoreline (Great Lakes and oceans): 3,427 miles
23. Washington

- Non-resident fishing licenses, tags, permits, & stamps issued, 2022: 158,019 (1.7% of all non-resident fishing permits issued nationwide)
- Non-resident fishing license, tag, permit, & stamp sales, 2022: $5,222,027 (14.1% of all fishing permit revenue in Washington)
- State surface area covered by water: 4,842 square miles (6.8% of surface area — 19th highest of 50 states)
- Shoreline (Great Lakes and oceans): 3,026 miles
22. Texas
- Non-resident fishing licenses, tags, permits, & stamps issued, 2022: 172,297 (1.8% of all non-resident fishing permits issued nationwide)
- Non-resident fishing license, tag, permit, & stamp sales, 2022: $6,425,844 (9.7% of all fishing permit revenue in Texas)
- State surface area covered by water: 7,365 square miles (2.7% of surface area — 21st lowest of 50 states)
- Shoreline (Great Lakes and oceans): 3,359 miles
21. West Virginia
- Non-resident fishing licenses, tags, permits, & stamps issued, 2022: 173,271 (1.9% of all non-resident fishing permits issued nationwide)
- Non-resident fishing license, tag, permit, & stamp sales, 2022: $1,721,970 (27.8% of all fishing permit revenue in West Virginia)
- State surface area covered by water: 192 square miles (0.8% of surface area — 9th lowest of 50 states)
- Shoreline (Great Lakes and oceans): 00 miles
20. Alabama

- Non-resident fishing licenses, tags, permits, & stamps issued, 2022: 183,209 (2.0% of all non-resident fishing permits issued nationwide)
- Non-resident fishing license, tag, permit, & stamp sales, 2022: $6,033,097 (33.7% of all fishing permit revenue in Alabama)
- State surface area covered by water: 1,775 square miles (3.4% of surface area — 25th highest of 50 states)
- Shoreline (Great Lakes and oceans): 607 miles
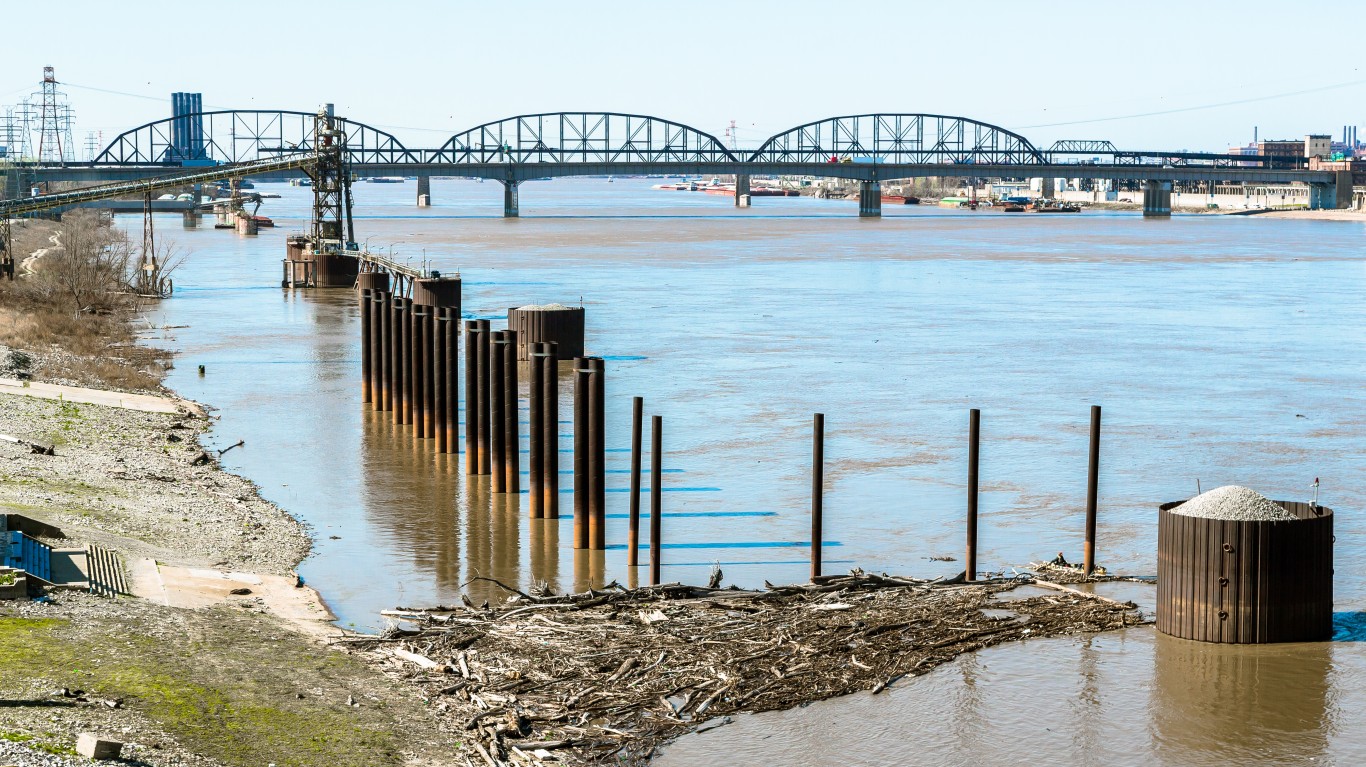
19. Missouri

- Non-resident fishing licenses, tags, permits, & stamps issued, 2022: 183,428 (2.0% of all non-resident fishing permits issued nationwide)
- Non-resident fishing license, tag, permit, & stamp sales, 2022: $4,621,429 (31.4% of all fishing permit revenue in Missouri)
- State surface area covered by water: 965 square miles (1.4% of surface area — 12th lowest of 50 states)
- Shoreline (Great Lakes and oceans): 00 miles
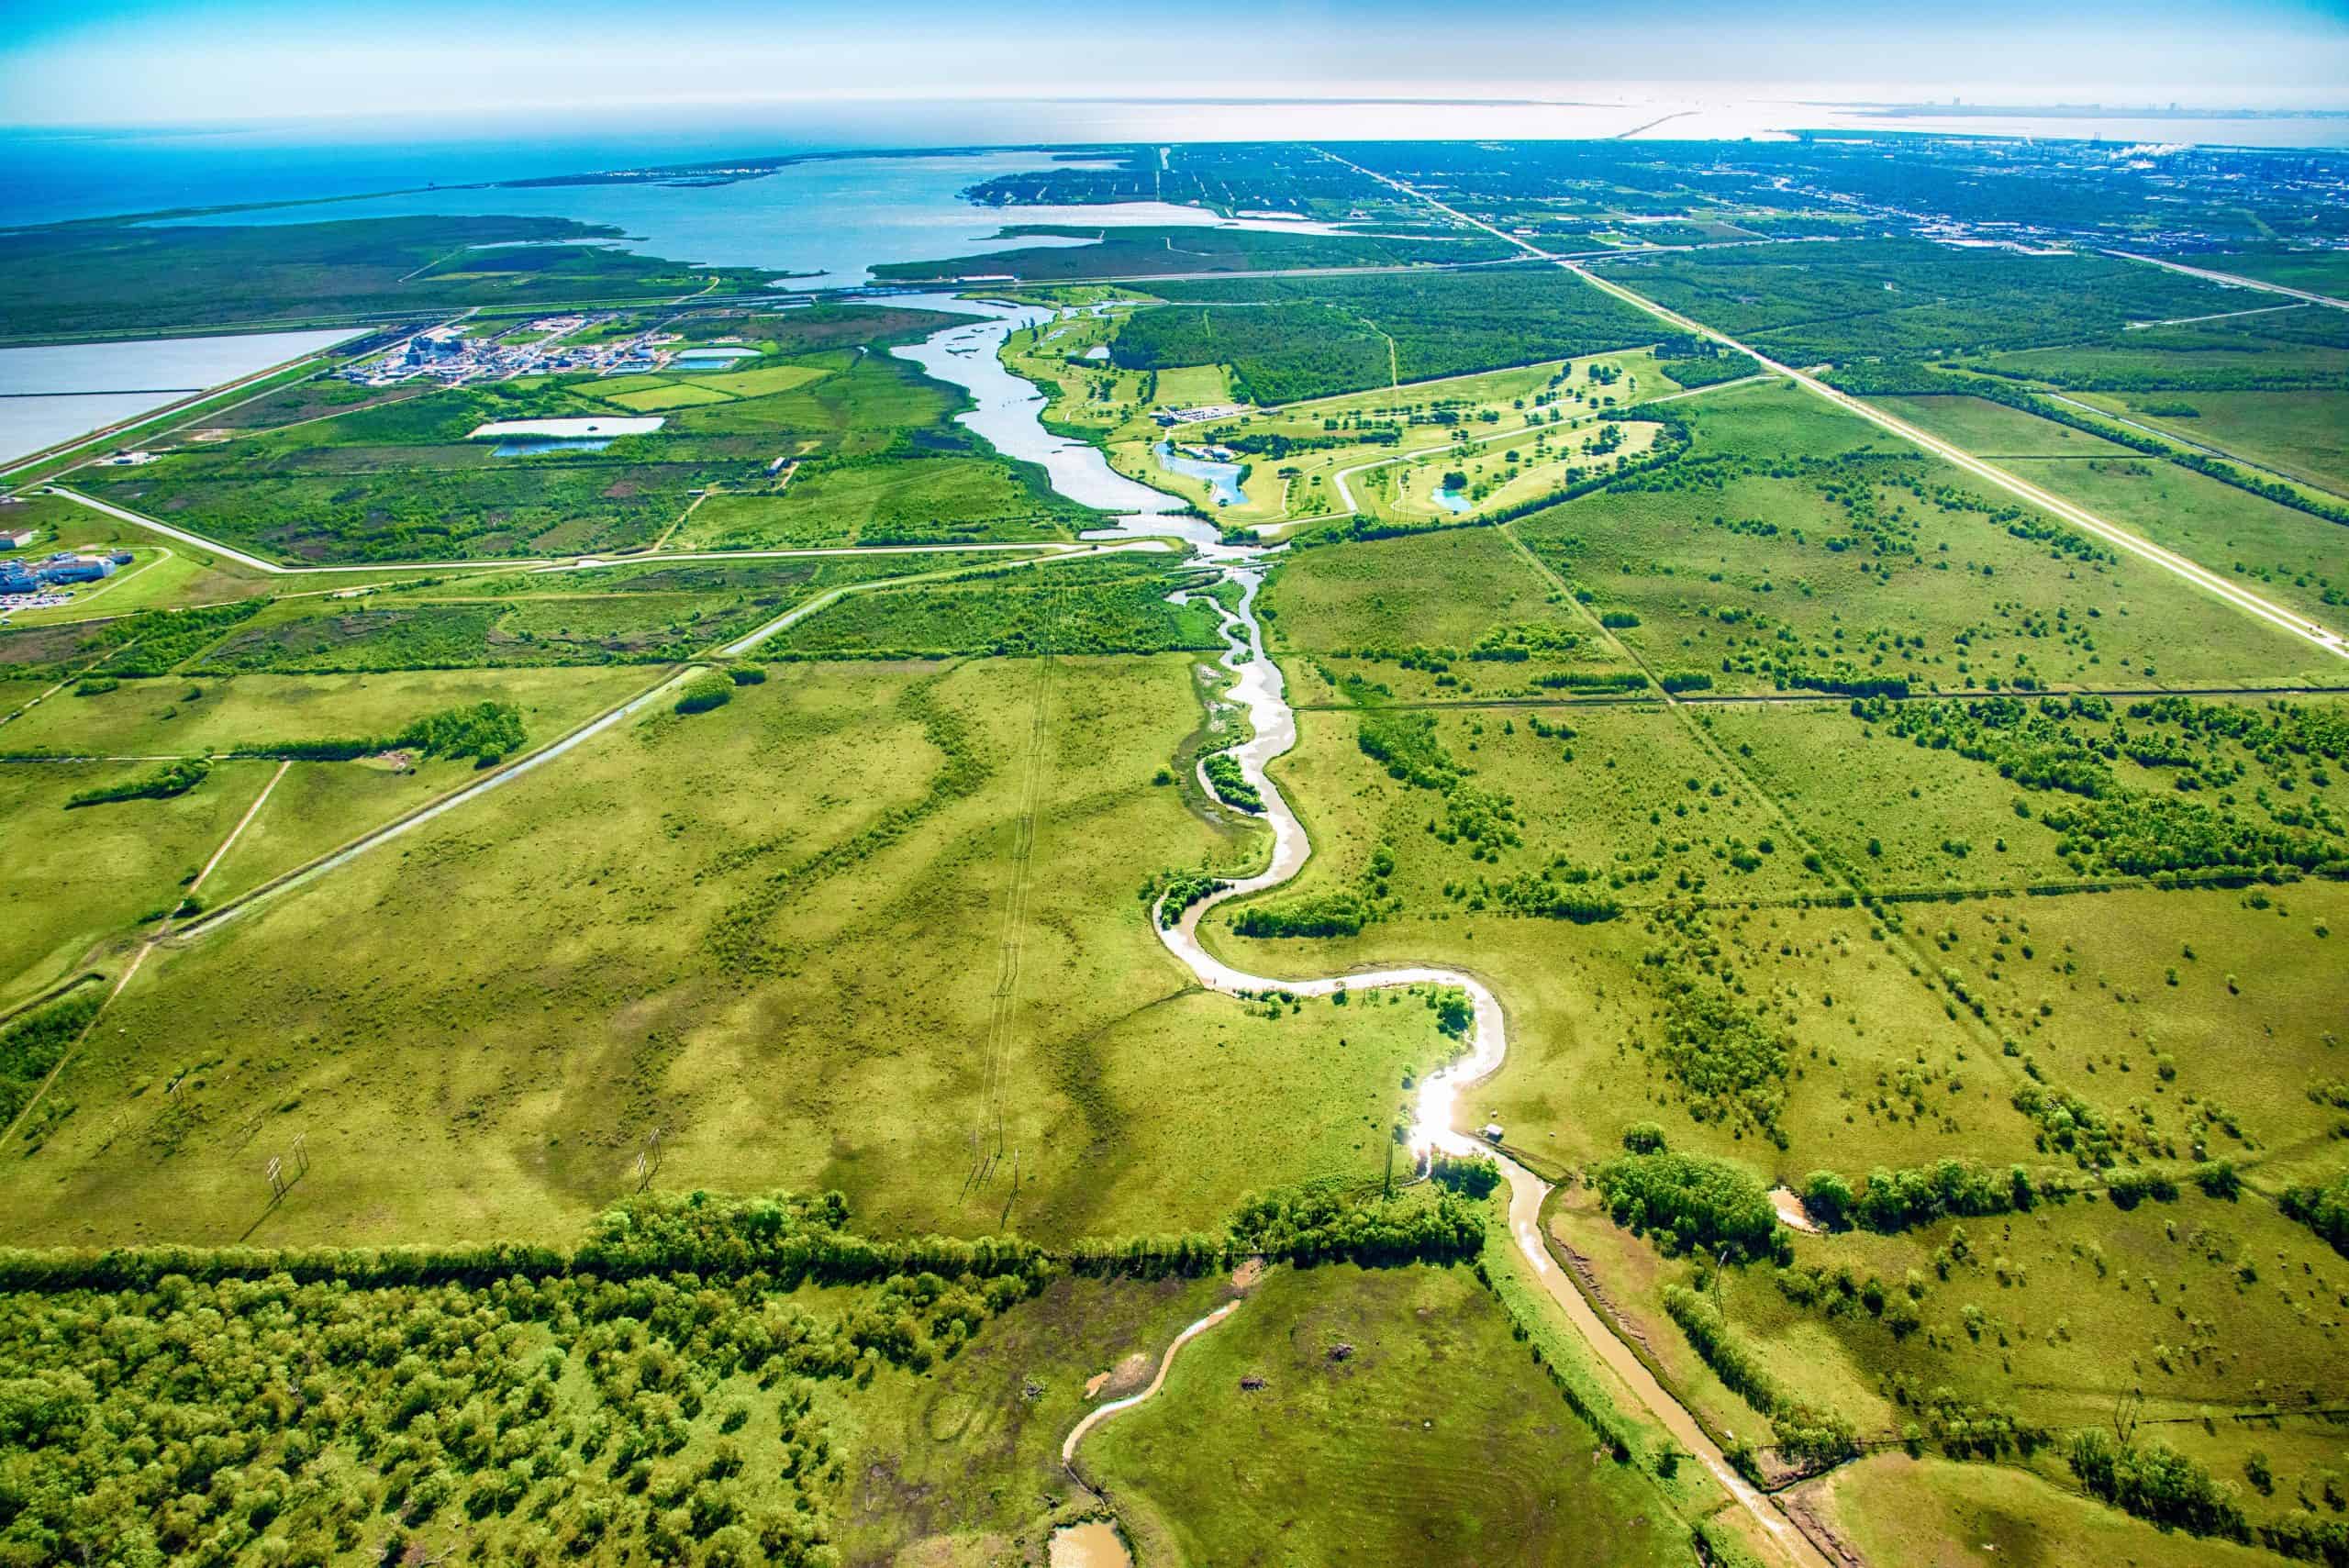
18. Louisiana

- Non-resident fishing licenses, tags, permits, & stamps issued, 2022: 202,144 (2.2% of all non-resident fishing permits issued nationwide)
- Non-resident fishing license, tag, permit, & stamp sales, 2022: $4,149,573 (37.3% of all fishing permit revenue in Louisiana)
- State surface area covered by water: 9,174 square miles (17.5% of surface area — 8th highest of 50 states)
- Shoreline (Great Lakes and oceans): 7,721 miles
17. Arkansas
- Non-resident fishing licenses, tags, permits, & stamps issued, 2022: 215,061 (2.3% of all non-resident fishing permits issued nationwide)
- Non-resident fishing license, tag, permit, & stamp sales, 2022: $4,866,468 (49.0% of all fishing permit revenue in Arkansas)
- State surface area covered by water: 1,143 square miles (2.1% of surface area — 16th lowest of 50 states)
- Shoreline (Great Lakes and oceans): 00 miles
16. New York

- Non-resident fishing licenses, tags, permits, & stamps issued, 2022: 215,688 (2.3% of all non-resident fishing permits issued nationwide)
- Non-resident fishing license, tag, permit, & stamp sales, 2022: $5,775,527 (26.5% of all fishing permit revenue in New York)
- State surface area covered by water: 7,429 square miles (13.6% of surface area — 12th highest of 50 states)
- Shoreline (Great Lakes and oceans): 2,625 miles
15. Oregon
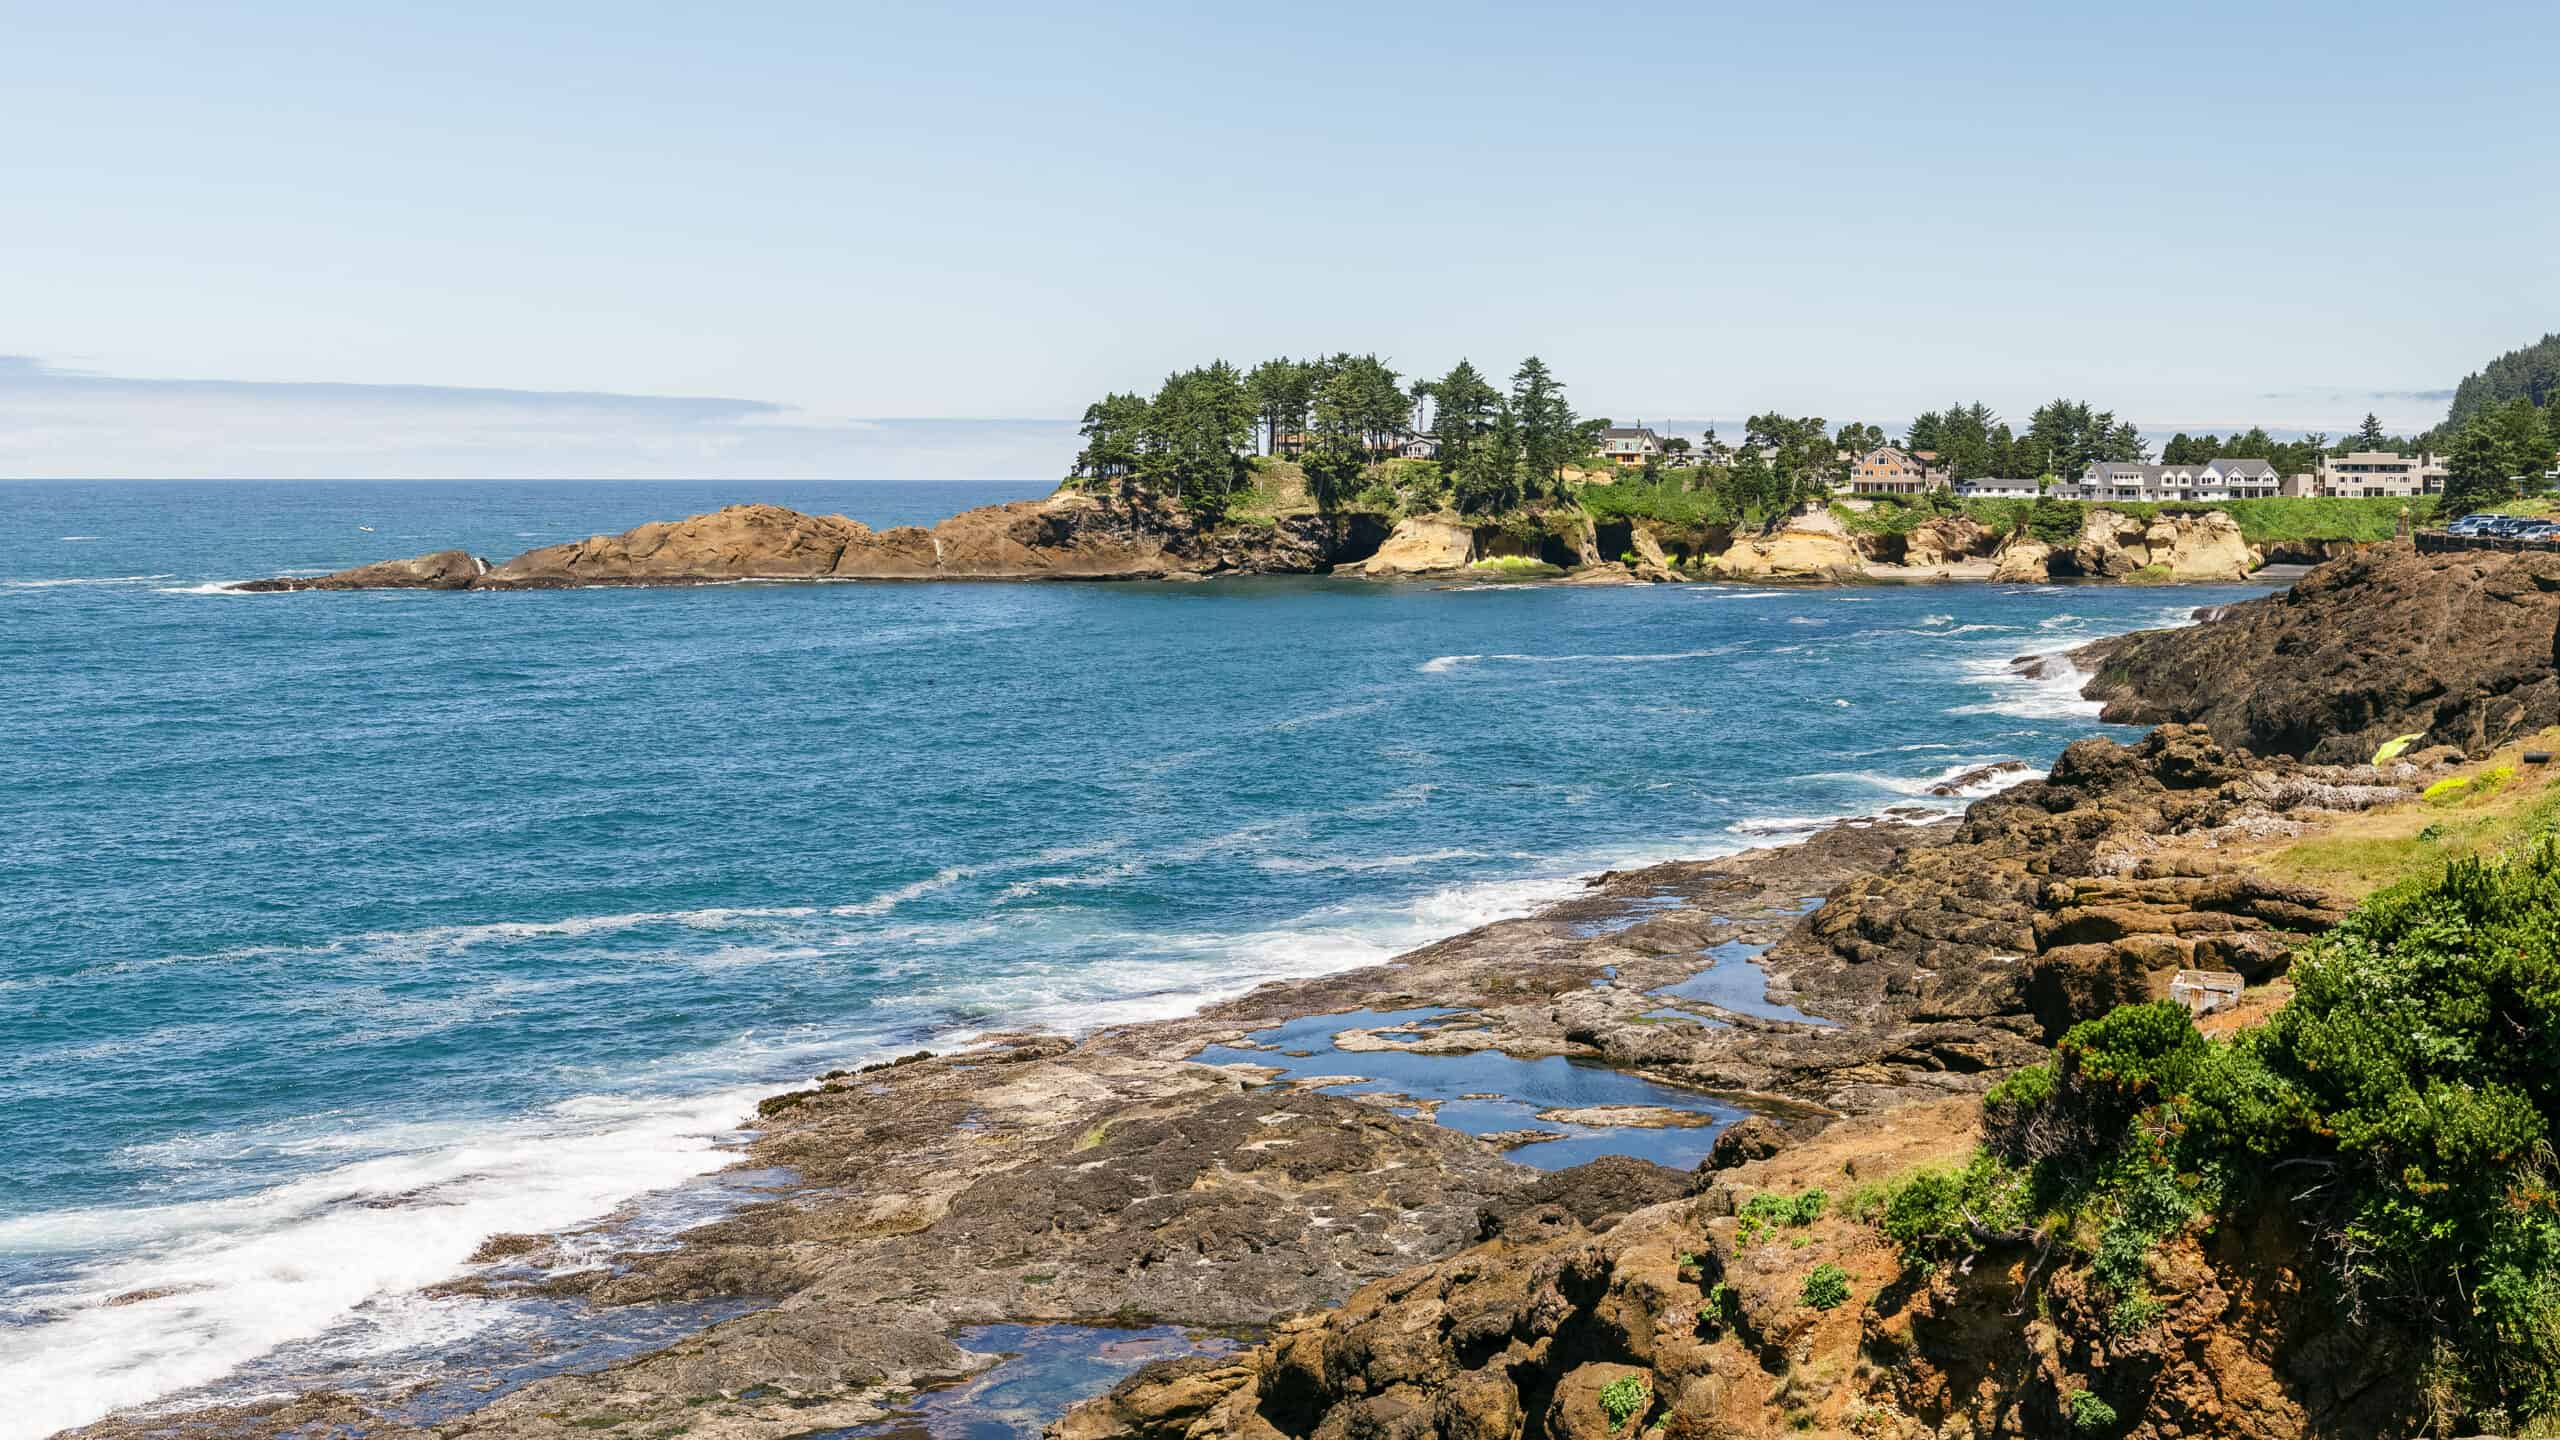
- Non-resident fishing licenses, tags, permits, & stamps issued, 2022: 217,658 (2.3% of all non-resident fishing permits issued nationwide)
- Non-resident fishing license, tag, permit, & stamp sales, 2022: $8,614,226 (25.7% of all fishing permit revenue in Oregon)
- State surface area covered by water: 2,391 square miles (2.4% of surface area — 20th lowest of 50 states)
- Shoreline (Great Lakes and oceans): 1,410 miles
14. Georgia

- Non-resident fishing licenses, tags, permits, & stamps issued, 2022: 221,189 (2.4% of all non-resident fishing permits issued nationwide)
- Non-resident fishing license, tag, permit, & stamp sales, 2022: $3,318,536 (21.1% of all fishing permit revenue in Georgia)
- State surface area covered by water: 1,912 square miles (3.2% of surface area — 25th lowest of 50 states)
- Shoreline (Great Lakes and oceans): 2,344 miles
13. New Mexico
- Non-resident fishing licenses, tags, permits, & stamps issued, 2022: 229,300 (2.4% of all non-resident fishing permits issued nationwide)
- Non-resident fishing license, tag, permit, & stamp sales, 2022: $2,786,201 (33.4% of all fishing permit revenue in New Mexico)
- State surface area covered by water: 292 square miles (0.2% of surface area — the lowest of 50 states)
- Shoreline (Great Lakes and oceans): 00 miles
12. South Carolina

- Non-resident fishing licenses, tags, permits, & stamps issued, 2022: 230,871 (2.5% of all non-resident fishing permits issued nationwide)
- Non-resident fishing license, tag, permit, & stamp sales, 2022: $2,321,338 (36.5% of all fishing permit revenue in South Carolina)
- State surface area covered by water: 1,960 square miles (6.1% of surface area — 20th highest of 50 states)
- Shoreline (Great Lakes and oceans): 2,876 miles
11. Wyoming
- Non-resident fishing licenses, tags, permits, & stamps issued, 2022: 231,511 (2.5% of all non-resident fishing permits issued nationwide)
- Non-resident fishing license, tag, permit, & stamp sales, 2022: $6,617,055 (77.1% of all fishing permit revenue in Wyoming)
- State surface area covered by water: 720 square miles (0.7% of surface area — 7th lowest of 50 states)
- Shoreline (Great Lakes and oceans): 00 miles
10. Idaho
- Non-resident fishing licenses, tags, permits, & stamps issued, 2022: 247,744 (2.6% of all non-resident fishing permits issued nationwide)
- Non-resident fishing license, tag, permit, & stamp sales, 2022: $10,241,245 (55.8% of all fishing permit revenue in Idaho)
- State surface area covered by water: 926 square miles (1.1% of surface area — 11th lowest of 50 states)
- Shoreline (Great Lakes and oceans): 00 miles
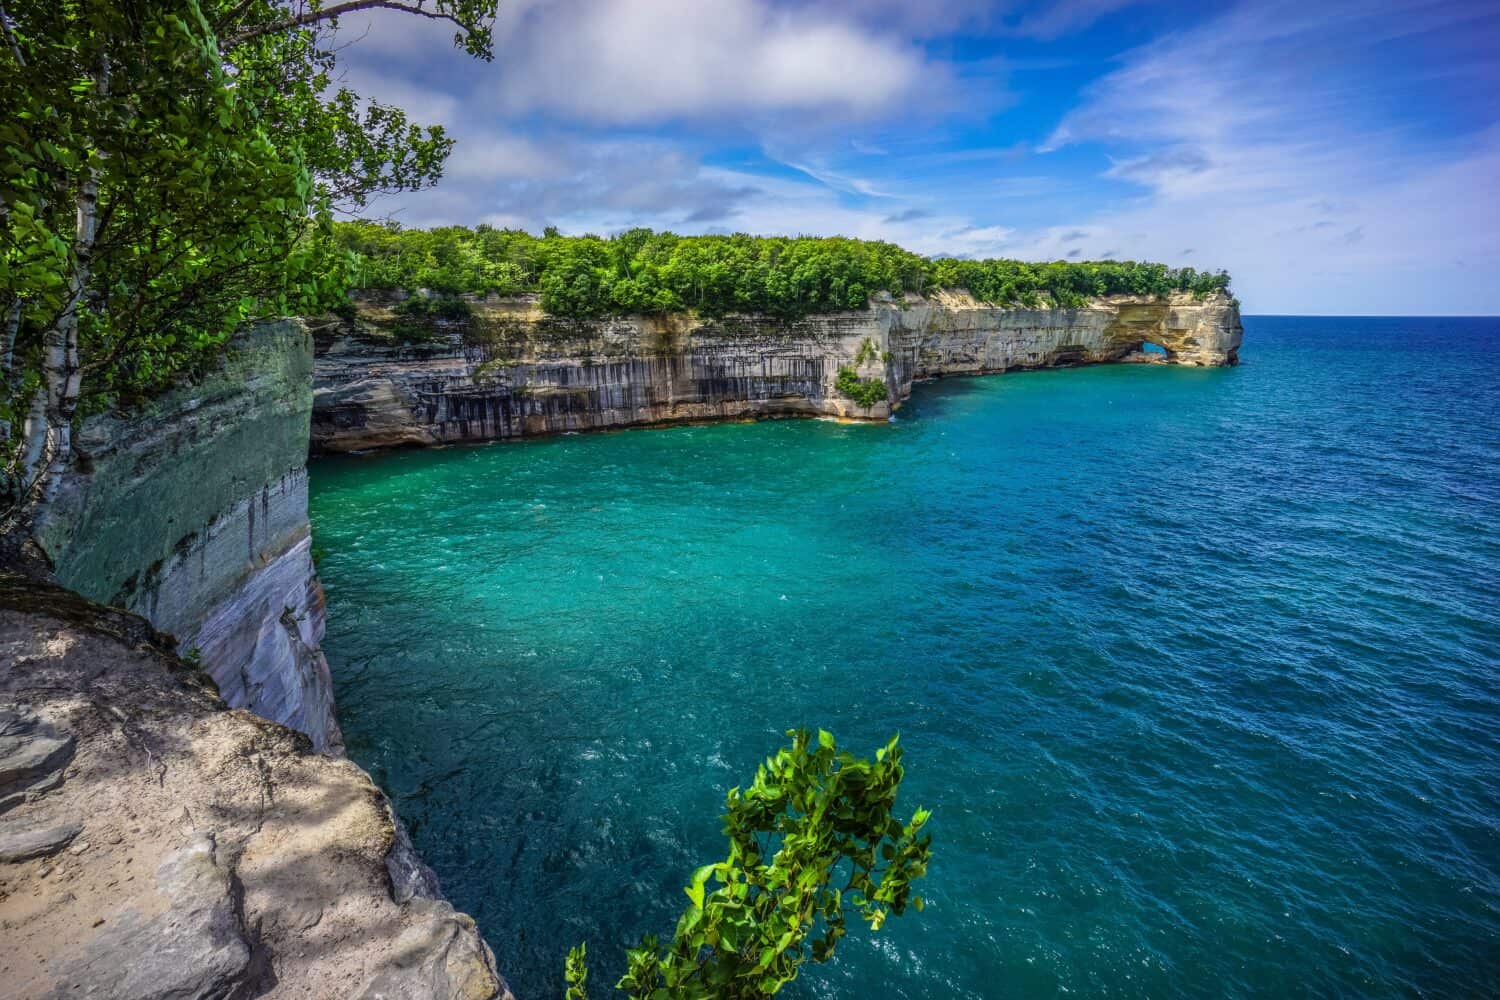
9. Michigan
- Non-resident fishing licenses, tags, permits, & stamps issued, 2022: 252,180 (2.7% of all non-resident fishing permits issued nationwide)
- Non-resident fishing license, tag, permit, & stamp sales, 2022: $9,275,692 (31.1% of all fishing permit revenue in Michigan)
- State surface area covered by water: 40,175 square miles (41.5% of surface area — the highest of 50 states)
- Shoreline (Great Lakes and oceans): 3,224 miles
8. North Carolina
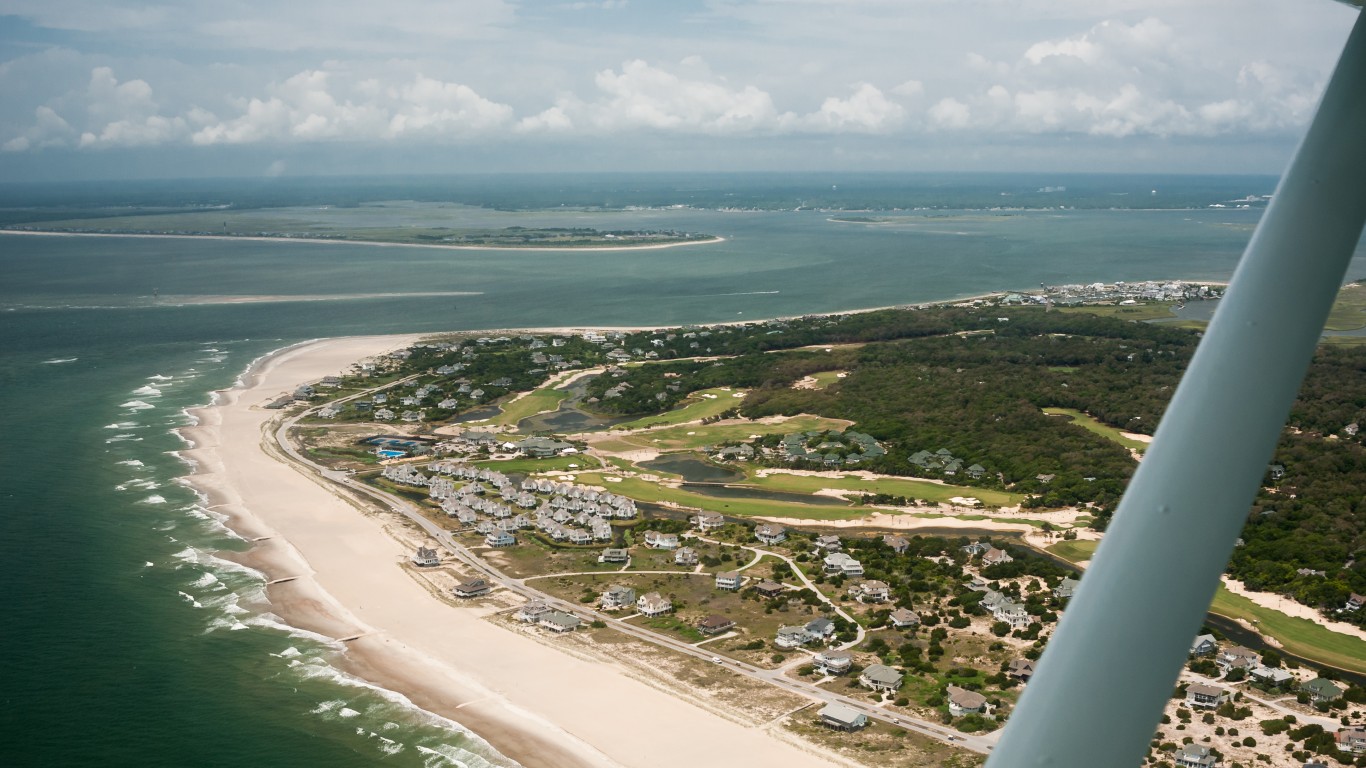
- Non-resident fishing licenses, tags, permits, & stamps issued, 2022: 275,808 (2.9% of all non-resident fishing permits issued nationwide)
- Non-resident fishing license, tag, permit, & stamp sales, 2022: $6,324,127 (22.1% of all fishing permit revenue in North Carolina)
- State surface area covered by water: 5,201 square miles (9.7% of surface area — 15th highest of 50 states)
- Shoreline (Great Lakes and oceans): 3,375 miles
7. Minnesota
- Non-resident fishing licenses, tags, permits, & stamps issued, 2022: 377,439 (4.0% of all non-resident fishing permits issued nationwide)
- Non-resident fishing license, tag, permit, & stamp sales, 2022: $13,376,465 (34.8% of all fishing permit revenue in Minnesota)
- State surface area covered by water: 7,309 square miles (8.4% of surface area — 17th highest of 50 states)
- Shoreline (Great Lakes and oceans): 189 miles
6. Tennessee
- Non-resident fishing licenses, tags, permits, & stamps issued, 2022: 388,475 (4.1% of all non-resident fishing permits issued nationwide)
- Non-resident fishing license, tag, permit, & stamp sales, 2022: $13,353,929 (30.6% of all fishing permit revenue in Tennessee)
- State surface area covered by water: 909 square miles (2.2% of surface area — 17th lowest of 50 states)
- Shoreline (Great Lakes and oceans): 00 miles
5. Wisconsin
- Non-resident fishing licenses, tags, permits, & stamps issued, 2022: 448,237 (4.8% of all non-resident fishing permits issued nationwide)
- Non-resident fishing license, tag, permit, & stamp sales, 2022: $12,146,592 (35.1% of all fishing permit revenue in Wisconsin)
- State surface area covered by water: 11,339 square miles (17.3% of surface area — 9th highest of 50 states)
- Shoreline (Great Lakes and oceans): 820 miles
4. Alaska
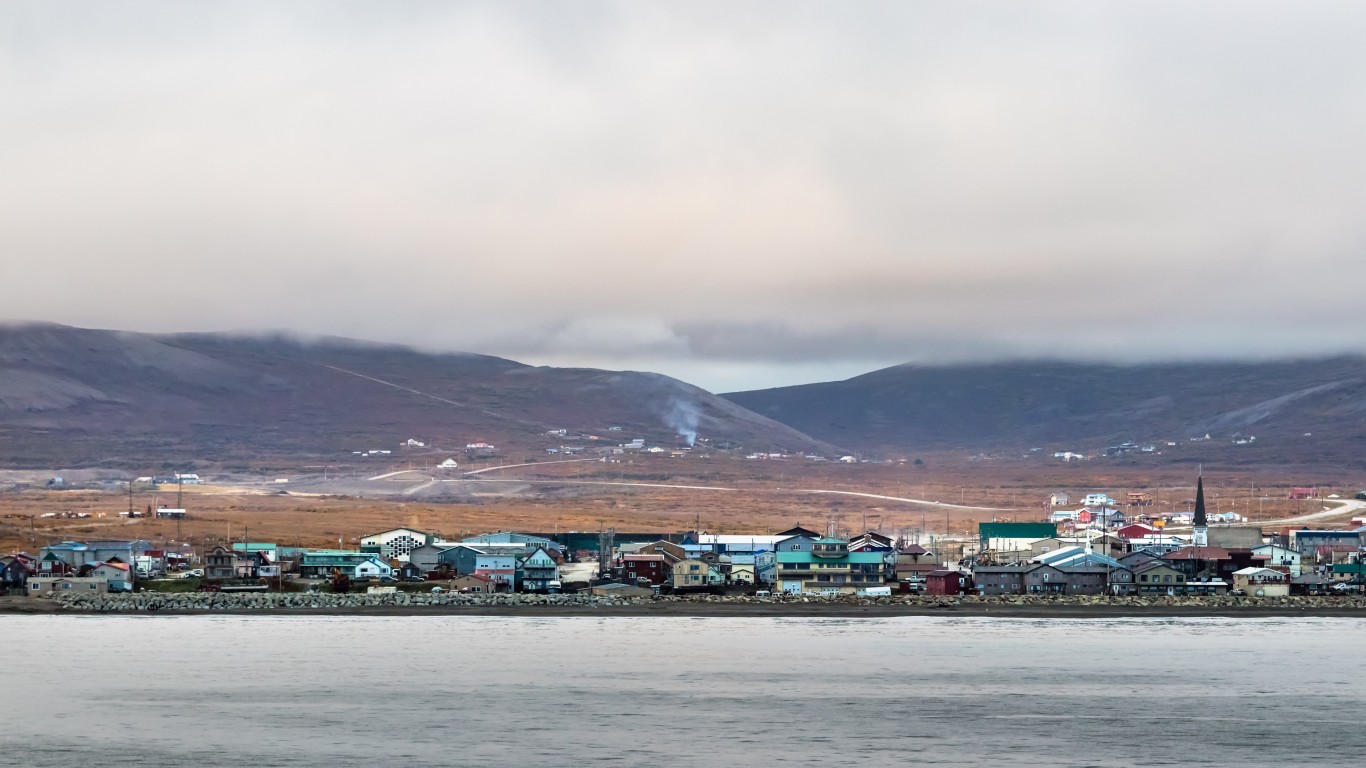
- Non-resident fishing licenses, tags, permits, & stamps issued, 2022: 492,860 (5.3% of all non-resident fishing permits issued nationwide)
- Non-resident fishing license, tag, permit, & stamp sales, 2022: $15,817,365 (75.6% of all fishing permit revenue in Alaska)
- State surface area covered by water: 94,743 square miles (14.2% of surface area — 11th highest of 50 states)
- Shoreline (Great Lakes and oceans): 33,904 miles
3. Colorado
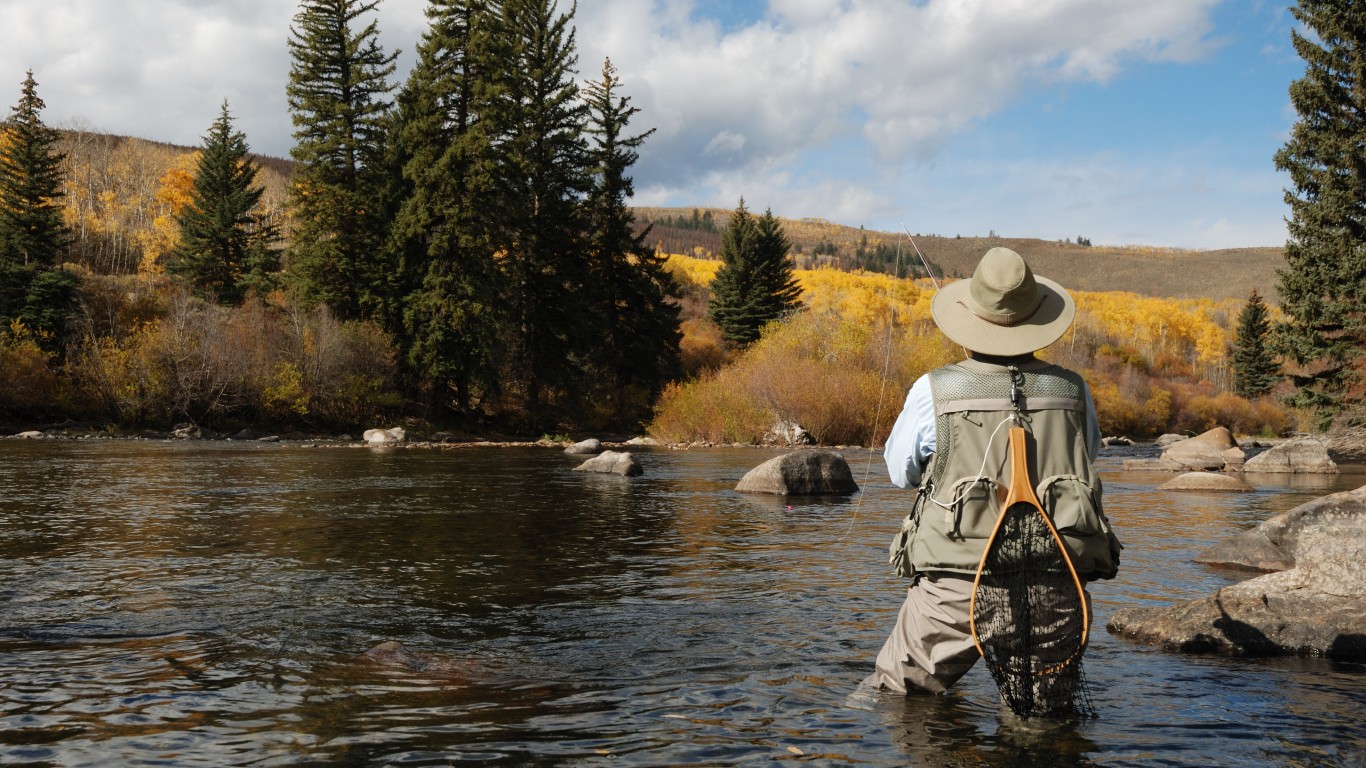
- Non-resident fishing licenses, tags, permits, & stamps issued, 2022: 511,912 (5.5% of all non-resident fishing permits issued nationwide)
- Non-resident fishing license, tag, permit, & stamp sales, 2022: $12,335,290 (41.2% of all fishing permit revenue in Colorado)
- State surface area covered by water: 452 square miles (0.4% of surface area — 3rd lowest of 50 states)
- Shoreline (Great Lakes and oceans): 00 miles
2. Montana
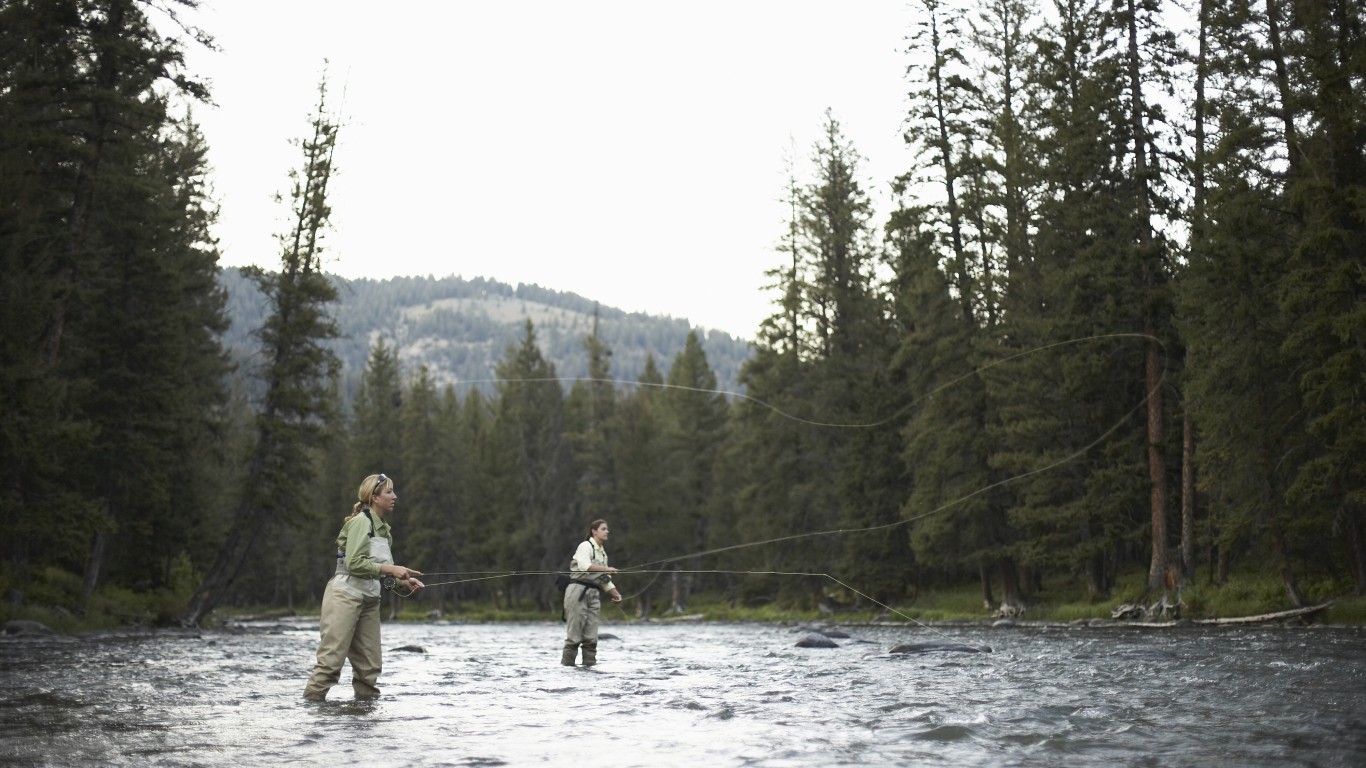
- Non-resident fishing licenses, tags, permits, & stamps issued, 2022: 739,575 (7.9% of all non-resident fishing permits issued nationwide)
- Non-resident fishing license, tag, permit, & stamp sales, 2022: $16,647,712 (72.5% of all fishing permit revenue in Montana)
- State surface area covered by water: 1,494 square miles (1.0% of surface area — 10th lowest of 50 states)
- Shoreline (Great Lakes and oceans): 00 miles
1. Florida
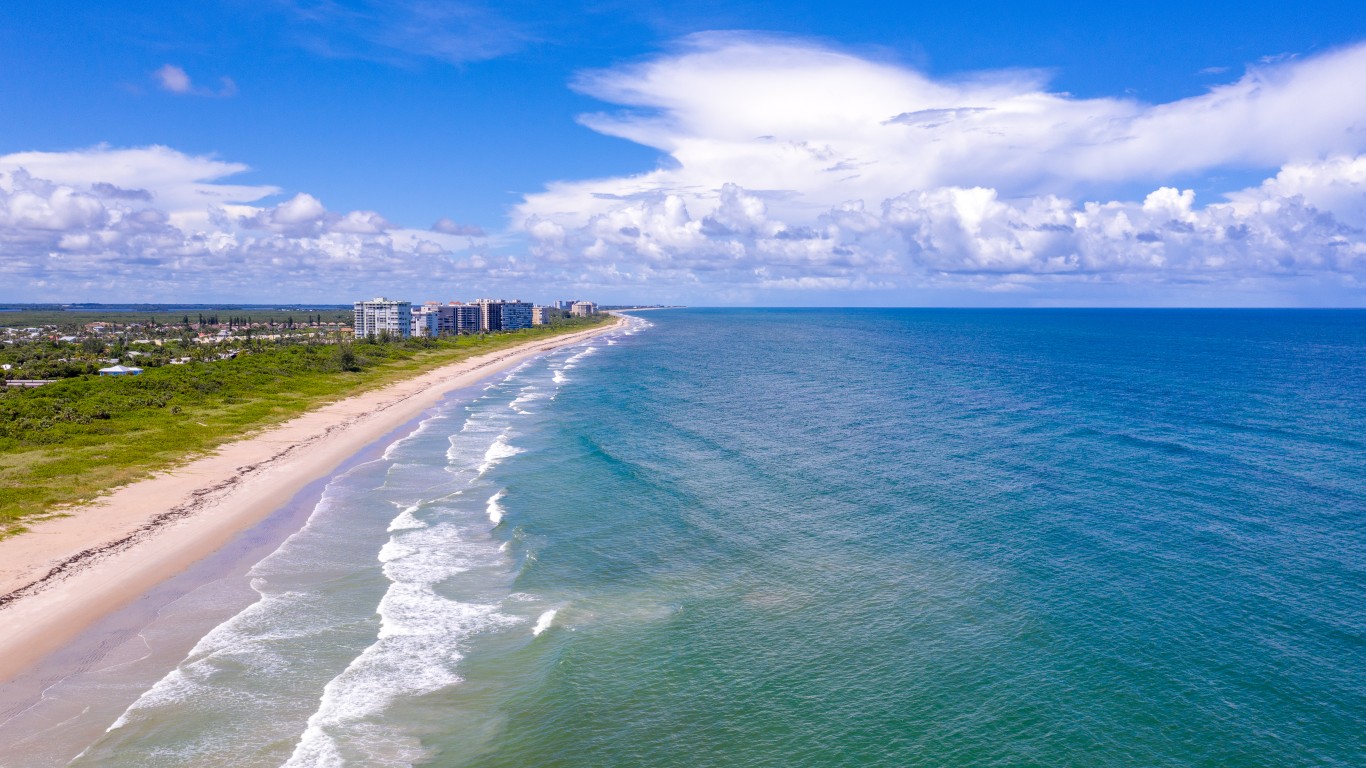
- Non-resident fishing licenses, tags, permits, & stamps issued, 2022: 917,665 (9.8% of all non-resident fishing permits issued nationwide)
- Non-resident fishing license, tag, permit, & stamp sales, 2022: $25,753,980 (54.4% of all fishing permit revenue in Florida)
- State surface area covered by water: 12,133 square miles (18.5% of surface area — 7th highest of 50 states)
- Shoreline (Great Lakes and oceans): 8,436 miles
It’s Your Money, Your Future—Own It (sponsor)
Are you ahead, or behind on retirement? For families with more than $500,000 saved for retirement, finding a financial advisor who puts your interest first can be the difference, and today it’s easier than ever. SmartAsset’s free tool matches you with up to three fiduciary financial advisors who serve your area in minutes. Each advisor has been carefully vetted and must act in your best interests. Start your search now.
If you’ve saved and built a substantial nest egg for you and your family, don’t delay; get started right here and help your retirement dreams become a retirement reality.
Thank you for reading! Have some feedback for us?
Contact the 24/7 Wall St. editorial team.
Latest from 24/7


Our expert who first called NVIDIA in 2009 is predicting 2025 will see a historic AI breakthrough.
You can follow him investing $500,000 of his own money on our top AI stocks for free.