Guns and Hunting
Tracking America’s Gun Purchases — A Yearly History Since 1986
Thomas Jackson / Stone via Getty Images
Published: December 18, 2024 12:10 pm
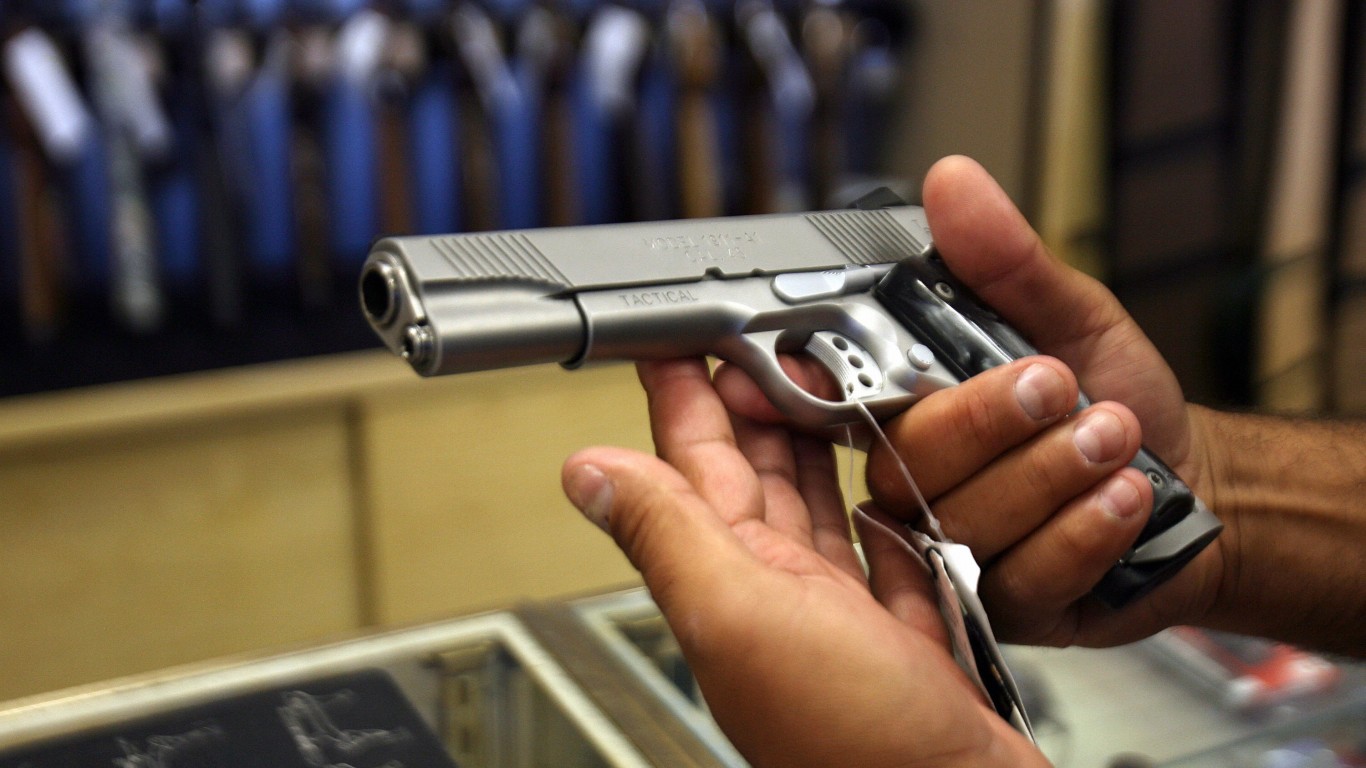
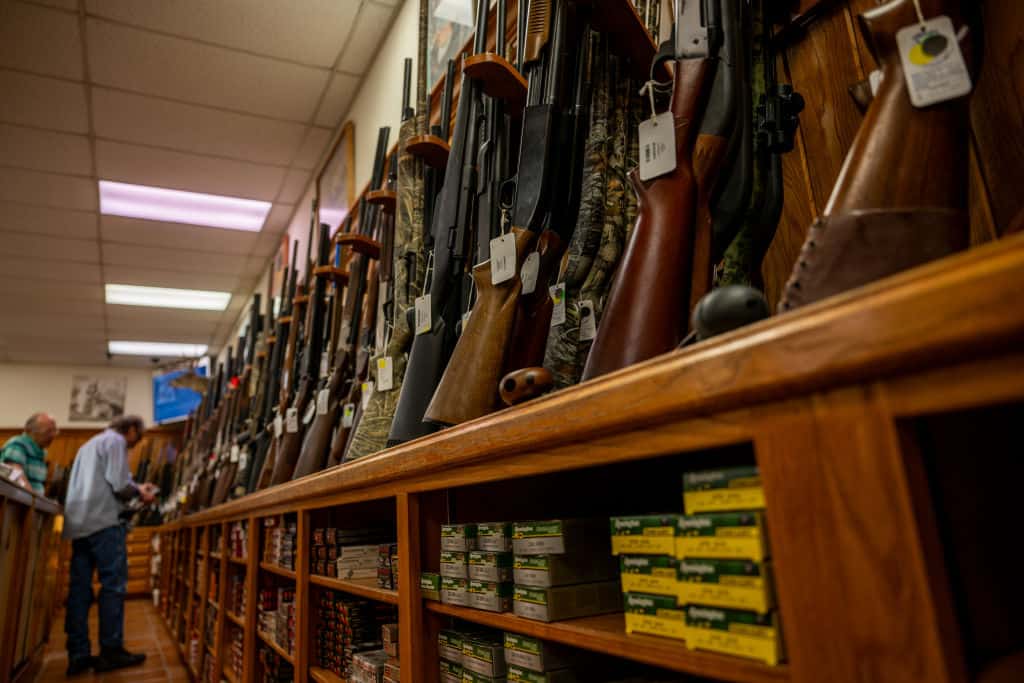
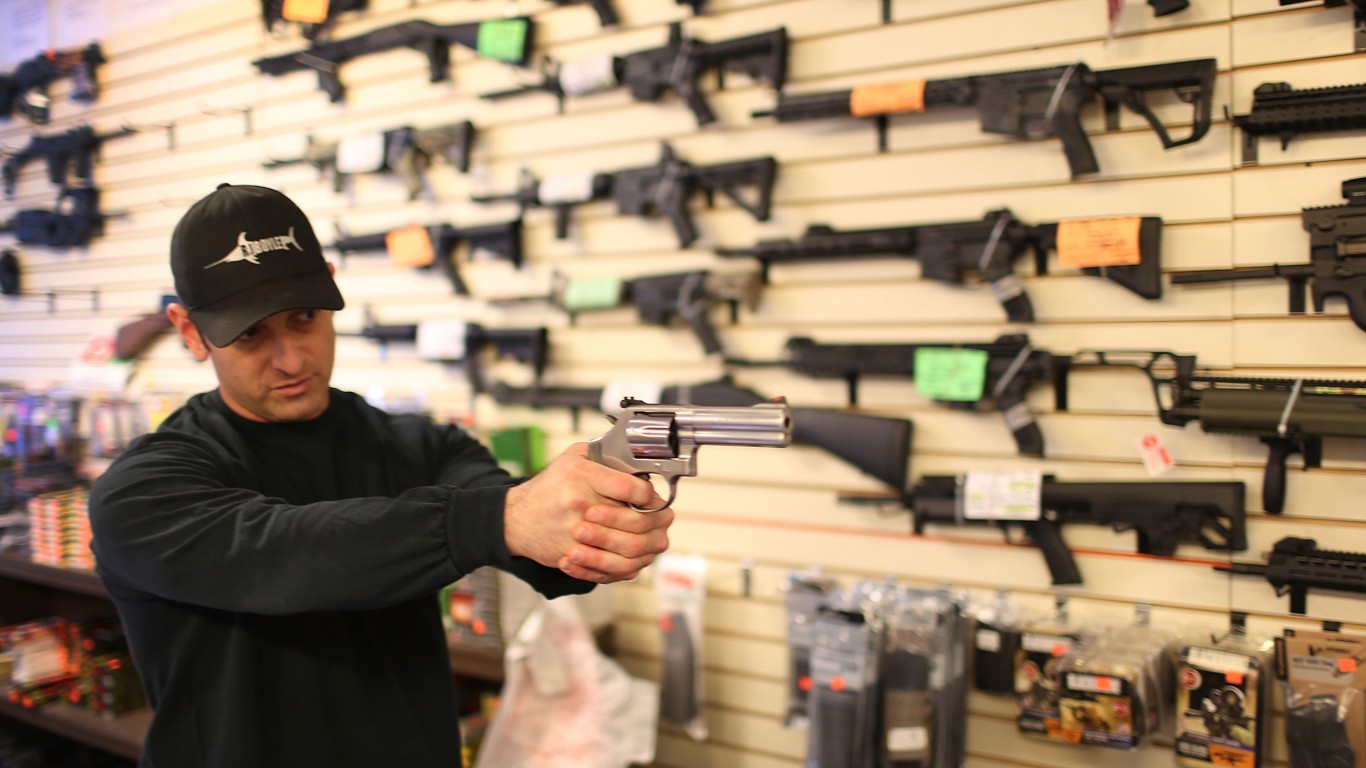
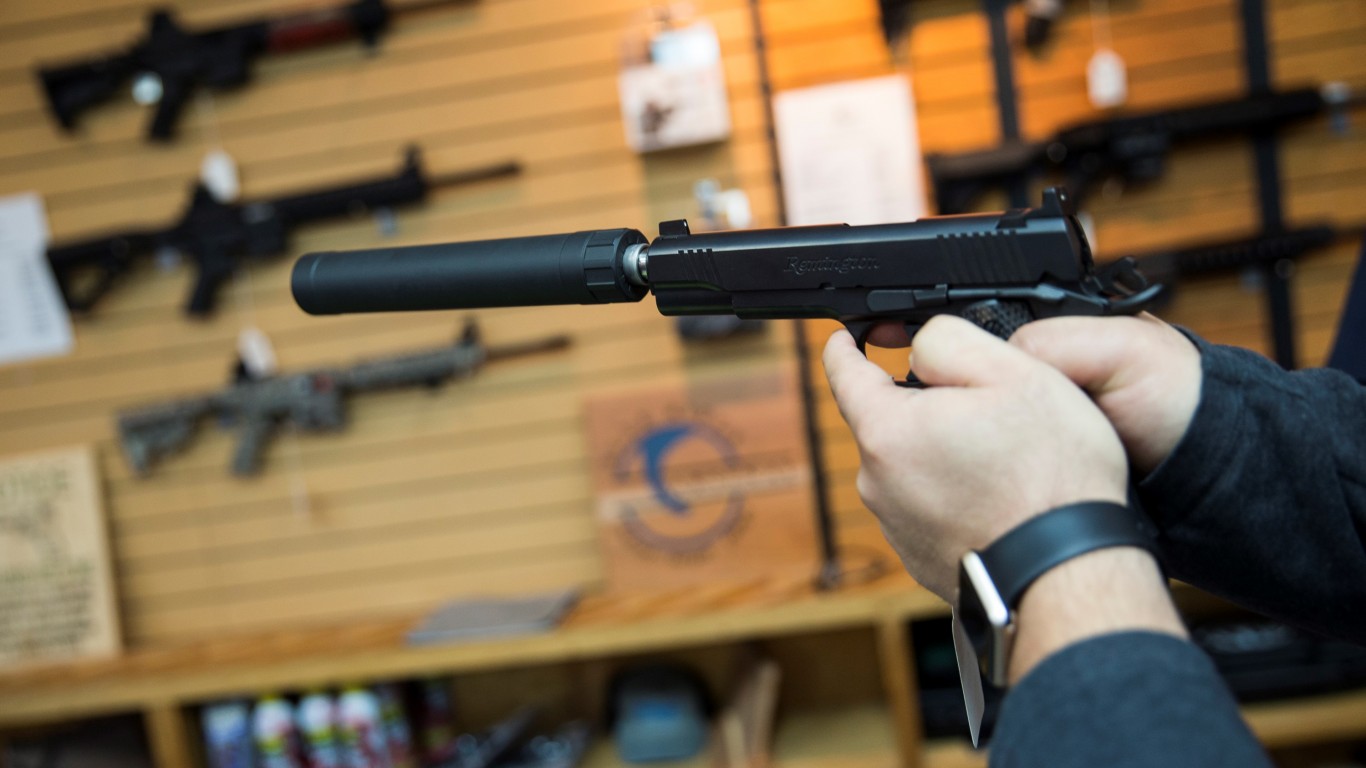
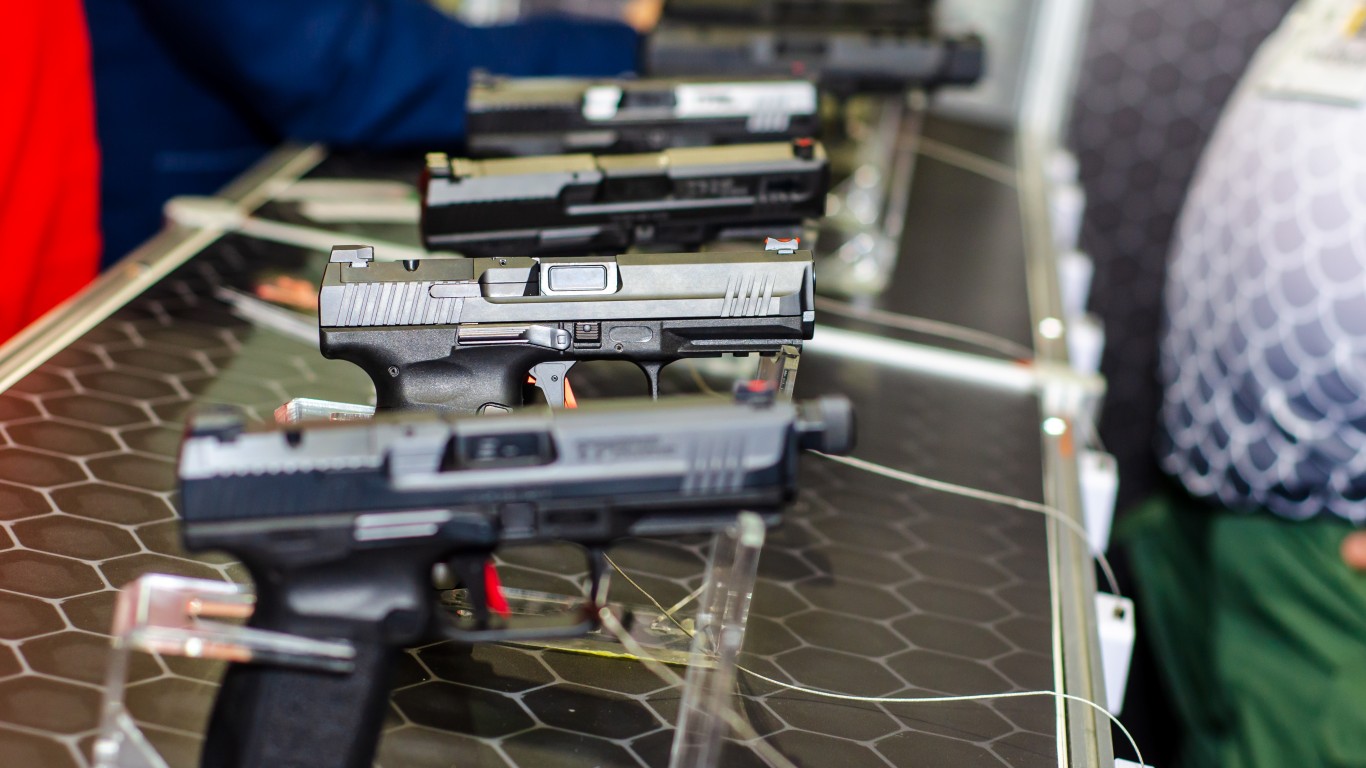
There are more guns in America than people — 120 guns for every 100 citizens. The Second Amendment of the U.S. Constitution guarantees citizens the right to bear arms, and one-third of Americans report owning at least one firearm. According to Pew Research , the number one reason Americans own a gun is for personal protection. Other reasons to own a gun include hunting, sport shooting, to keep as collector’s items, or for their jobs. Gun ownership in America has been increasing over the years. 24/7 took a look back to see just how this has changed by reviewing the data as far back as 1986 on gun ownership. (Although the US has many American gun manufacturers, also see the countries where guns are being imported from .)
24/7 Wall St. calculated the number of guns Americans have bought in each of the last 35 years using historical firearm production, import, and export data from the ATF. For every year between 1986 and 2020, we tallied the number of firearms manufactured in, and imported to, the U.S., and subtracted the number of firearms that were exported to foreign markets. Import data was not yet available for 2021 or 2022 at the time of this writing, and as a result, numbers for these years only reflect estimated domestic sales of American-made firearms.
Why It Matters
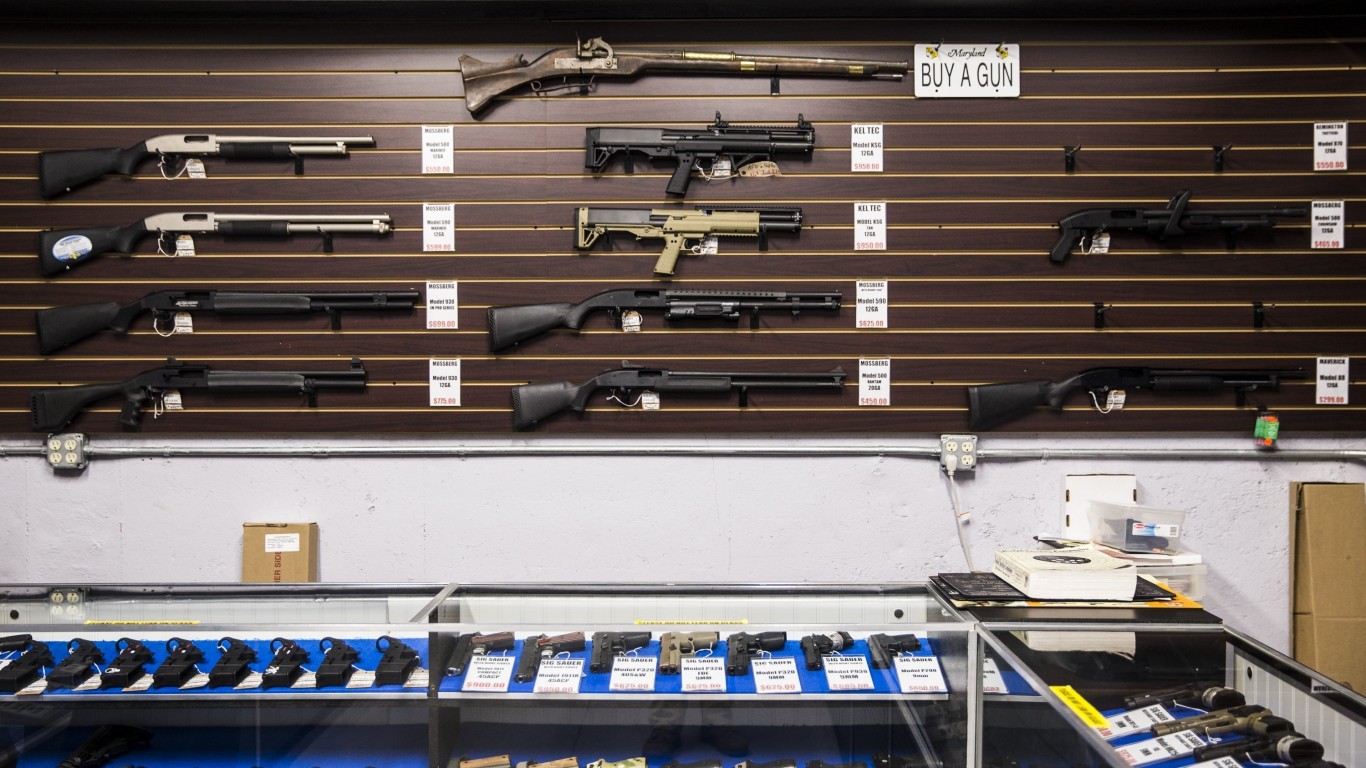
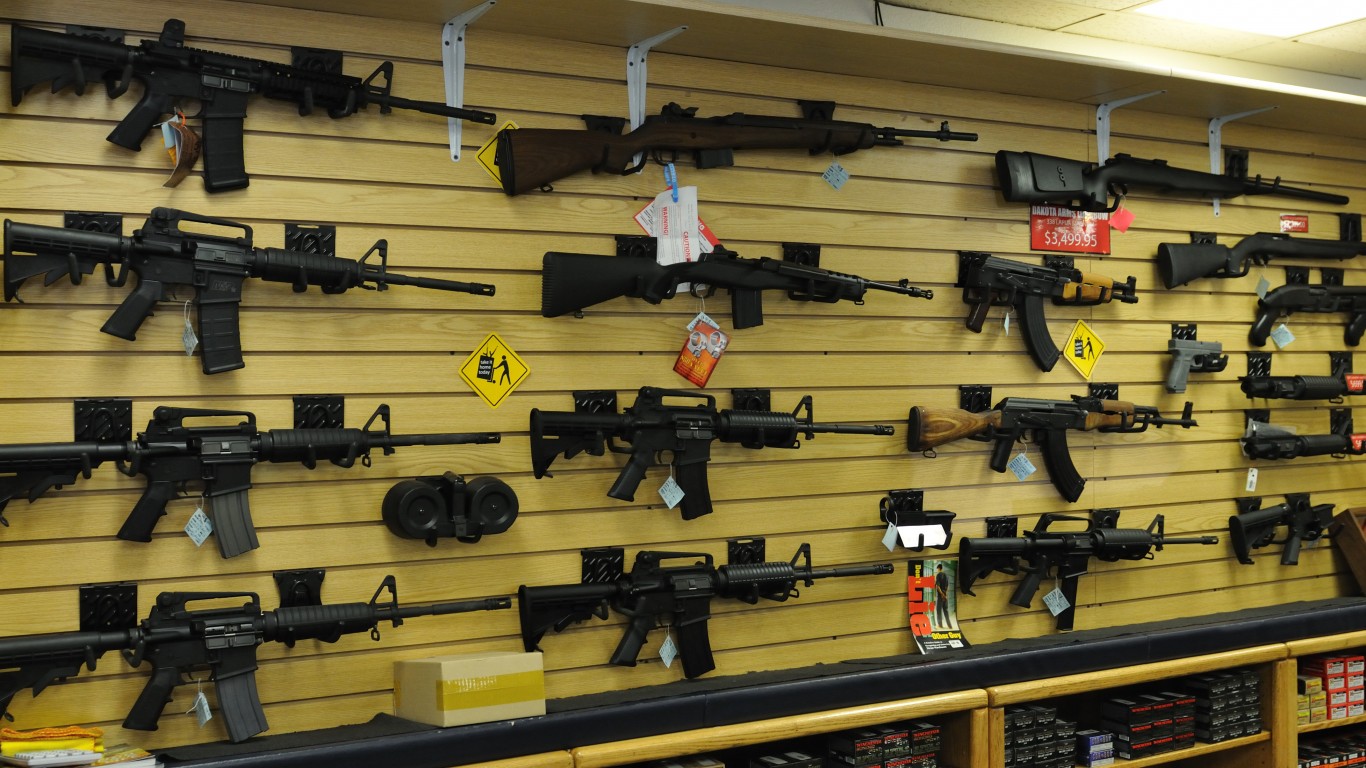
Wikimedia Commons / Public Domain The United States is the largest consumer market for firearms by a wide margin. To meet demand — which has hit unprecedented highs in recent years — many of the world’s largest gunmakers have manufacturing operations in the United States. Of the 287.9 million firearms estimated to have been sold in the U.S. since 1986, more than two-thirds were manufactured domestically — and over half were sold in 2010 or later. Rising demand has likely been driven in part by changes in consumer preferences and an increasingly pro-gun regulatory environment.
Est. U.S. firearm sales in 1986: 3,524,486 — the fewest in last 35 years (80.1% U.S. made; 19.9% imported)Est. U.S. handgun sales in 1986: 1,534,305 — the fewest in last 35 years (84.9% U.S. made; 15.1% imported)Est. U.S. rifle sales in 1986: 1,202,283 — 34th most in last 35 years (77.6% U.S. made; 22.4% imported)Est. U.S. shotgun sales in 1986: 783,539 — the fewest in last 35 years (74.3% U.S. made; 25.7% imported)
Portland Press Herald / Portland Press Herald via Getty Images
Est. U.S. firearm sales in 1987: 4,335,131 — 31st most in last 35 years (75.5% U.S. made; 24.5% imported)Est. U.S. handgun sales in 1987: 1,869,634 — 25th most in last 35 years (81.7% U.S. made; 18.3% imported)Est. U.S. rifle sales in 1987: 1,379,280 — 31st most in last 35 years (70.0% U.S. made; 30.0% imported)Est. U.S. shotgun sales in 1987: 1,089,232 — 27th most in last 35 years (71.8% U.S. made; 28.2% imported)
GABRIEL BOUYS / AFP via Getty Images
Est. U.S. firearm sales in 1988: 4,982,963 — 22nd most in last 35 years (74.4% U.S. made; 25.6% imported)Est. U.S. handgun sales in 1988: 2,345,516 — 20th most in last 35 years (73.5% U.S. made; 26.5% imported)Est. U.S. rifle sales in 1988: 1,373,451 — 32nd most in last 35 years (79.4% U.S. made; 20.6% imported)Est. U.S. shotgun sales in 1988: 1,231,379 — 14th most in last 35 years (69.8% U.S. made; 30.2% imported)
IPGGutenbergUKLtd / iStock / Getty Images Plus via Getty Images
Est. U.S. firearm sales in 1989: 5,164,892 — 19th most in last 35 years (80.5% U.S. made; 19.5% imported)Est. U.S. handgun sales in 1989: 2,354,994 — 19th most in last 35 years (81.3% U.S. made; 18.7% imported)Est. U.S. rifle sales in 1989: 1,627,305 — 26th most in last 35 years (82.0% U.S. made; 18.0% imported)Est. U.S. shotgun sales in 1989: 1,142,479 — 24th most in last 35 years (76.0% U.S. made; 24.0% imported)
wingedwolf / iStock via Getty Images
Est. U.S. firearm sales in 1990: 4,442,152 — 29th most in last 35 years (81.0% U.S. made; 19.0% imported)Est. U.S. handgun sales in 1990: 2,110,221 — 22nd most in last 35 years (78.7% U.S. made; 21.3% imported)Est. U.S. rifle sales in 1990: 1,343,335 — 33rd most in last 35 years (84.9% U.S. made; 15.1% imported)Est. U.S. shotgun sales in 1990: 936,485 — 32nd most in last 35 years (79.5% U.S. made; 20.5% imported)
DmyTo / iStock via Getty Images
Est. U.S. firearm sales in 1991: 3,882,598 — 34th most in last 35 years (81.4% U.S. made; 18.6% imported)Est. U.S. handgun sales in 1991: 1,939,116 — 23rd most in last 35 years (84.9% U.S. made; 15.1% imported)Est. U.S. rifle sales in 1991: 1,103,700 — the fewest in last 35 years (71.8% U.S. made; 28.2% imported)Est. U.S. shotgun sales in 1991: 826,766 — 34th most in last 35 years (86.0% U.S. made; 14.0% imported)
ASphotowed / iStock via Getty Images
Est. U.S. firearm sales in 1992: 6,618,755 — 16th most in last 35 years (57.0% U.S. made; 43.0% imported)Est. U.S. handgun sales in 1992: 2,930,536 — 16th most in last 35 years (66.5% U.S. made; 33.5% imported)Est. U.S. rifle sales in 1992: 2,335,007 — 13th most in last 35 years (39.0% U.S. made; 61.0% imported)Est. U.S. shotgun sales in 1992: 1,341,010 — 9th most in last 35 years (67.0% U.S. made; 33.0% imported)
The Washington Post / The Washington Post via Getty Images
Est. U.S. firearm sales in 1993: 7,667,754 — 13th most in last 35 years (60.3% U.S. made; 39.7% imported)Est. U.S. handgun sales in 1993: 3,709,645 — 13th most in last 35 years (67.5% U.S. made; 32.5% imported)Est. U.S. rifle sales in 1993: 2,671,944 — 11th most in last 35 years (40.4% U.S. made; 59.6% imported)Est. U.S. shotgun sales in 1993: 1,219,579 — 17th most in last 35 years (79.8% U.S. made; 20.2% imported)
Joe Sohm/Visions of America / Universal Images Group via Getty Images
Est. U.S. firearm sales in 1994: 6,649,646 — 15th most in last 35 years (71.7% U.S. made; 28.3% imported)Est. U.S. handgun sales in 1994: 3,333,022 — 15th most in last 35 years (72.5% U.S. made; 27.5% imported)Est. U.S. rifle sales in 1994: 2,082,640 — 17th most in last 35 years (59.3% U.S. made; 40.7% imported)Est. U.S. shotgun sales in 1994: 1,226,268 — 15th most in last 35 years (90.4% U.S. made; 9.6% imported)
Anadolu Agency / Anadolu Agency via Getty Images
Est. U.S. firearm sales in 1995: 4,995,525 — 21st most in last 35 years (77.9% U.S. made; 22.1% imported)Est. U.S. handgun sales in 1995: 2,199,438 — 21st most in last 35 years (67.9% U.S. made; 32.1% imported)Est. U.S. rifle sales in 1995: 1,581,471 — 28th most in last 35 years (83.5% U.S. made; 16.5% imported)Est. U.S. shotgun sales in 1995: 1,208,470 — 20th most in last 35 years (88.7% U.S. made; 11.3% imported)
Anadolu Agency / Anadolu Agency via Getty Images
Est. U.S. firearm sales in 1996: 4,404,020 — 30th most in last 35 years (80.0% U.S. made; 20.0% imported)Est. U.S. handgun sales in 1996: 1,822,832 — 26th most in last 35 years (73.1% U.S. made; 26.9% imported)Est. U.S. rifle sales in 1996: 1,612,326 — 27th most in last 35 years (83.7% U.S. made; 16.3% imported)Est. U.S. shotgun sales in 1996: 956,997 — 31st most in last 35 years (86.6% U.S. made; 13.4% imported)
Anadolu Agency / Anadolu Agency via Getty Images
Est. U.S. firearm sales in 1997: 4,257,838 — 32nd most in last 35 years (77.9% U.S. made; 22.1% imported)Est. U.S. handgun sales in 1997: 1,772,849 — 29th most in last 35 years (73.3% U.S. made; 26.7% imported)Est. U.S. rifle sales in 1997: 1,533,652 — 29th most in last 35 years (76.6% U.S. made; 23.4% imported)Est. U.S. shotgun sales in 1997: 936,011 — 33rd most in last 35 years (88.6% U.S. made; 11.4% imported)
ROB KERR / AFP via Getty Images
Est. U.S. firearm sales in 1998: 4,510,056 — 28th most in last 35 years (77.8% U.S. made; 22.2% imported)Est. U.S. handgun sales in 1998: 1,771,111 — 30th most in last 35 years (70.0% U.S. made; 30.0% imported)Est. U.S. rifle sales in 1998: 1,718,625 — 24th most in last 35 years (85.5% U.S. made; 14.5% imported)Est. U.S. shotgun sales in 1998: 998,327 — 30th most in last 35 years (78.0% U.S. made; 22.0% imported)
Spend A Day Touring, LLC / CC BY-SA 2.0 / Flickr
Est. U.S. firearm sales in 1999: 4,719,228 — 25th most in last 35 years (81.1% U.S. made; 18.9% imported)Est. U.S. handgun sales in 1999: 1,556,003 — 34th most in last 35 years (80.2% U.S. made; 19.8% imported)Est. U.S. rifle sales in 1999: 1,702,207 — 25th most in last 35 years (88.4% U.S. made; 11.6% imported)Est. U.S. shotgun sales in 1999: 1,425,209 — 6th most in last 35 years (72.9% U.S. made; 27.1% imported)
jfbenning / iStock Editorial via Getty Images
Est. U.S. firearm sales in 2000: 4,717,696 — 26th most in last 35 years (76.8% U.S. made; 23.2% imported)Est. U.S. handgun sales in 2000: 1,670,998 — 32nd most in last 35 years (72.1% U.S. made; 27.9% imported)Est. U.S. rifle sales in 2000: 1,832,294 — 21st most in last 35 years (83.7% U.S. made; 16.3% imported)Est. U.S. shotgun sales in 2000: 1,195,340 — 23rd most in last 35 years (72.2% U.S. made; 27.8% imported)
mtcurado / iStock Unreleased via Getty Images
Est. U.S. firearm sales in 2001: 4,126,940 — 33rd most in last 35 years (66.9% U.S. made; 33.1% imported)Est. U.S. handgun sales in 2001: 1,593,124 — 33rd most in last 35 years (55.4% U.S. made; 44.6% imported)Est. U.S. rifle sales in 2001: 1,461,477 — 30th most in last 35 years (84.4% U.S. made; 15.6% imported)Est. U.S. shotgun sales in 2001: 1,061,969 — 29th most in last 35 years (59.7% U.S. made; 40.3% imported)
2023 Getty Images / Getty Images News via Getty Images
Est. U.S. firearm sales in 2002: 4,845,376 — 24th most in last 35 years (66.4% U.S. made; 33.6% imported)Est. U.S. handgun sales in 2002: 1,773,687 — 28th most in last 35 years (58.2% U.S. made; 41.8% imported)Est. U.S. rifle sales in 2002: 1,962,279 — 20th most in last 35 years (74.1% U.S. made; 25.9% imported)Est. U.S. shotgun sales in 2002: 1,089,183 — 28th most in last 35 years (65.1% U.S. made; 34.9% imported)
2023 Getty Images / Getty Images News via Getty Images
Est. U.S. firearm sales in 2003: 4,632,994 — 27th most in last 35 years (68.3% U.S. made; 31.7% imported)Est. U.S. handgun sales in 2003: 1,708,423 — 31st most in last 35 years (63.1% U.S. made; 36.9% imported)Est. U.S. rifle sales in 2003: 1,796,639 — 23rd most in last 35 years (76.1% U.S. made; 23.9% imported)Est. U.S. shotgun sales in 2003: 1,103,943 — 26th most in last 35 years (63.1% U.S. made; 36.9% imported)
2022 Getty Images / Getty Images News via Getty Images
Est. U.S. firearm sales in 2004: 4,869,964 — 23rd most in last 35 years (60.8% U.S. made; 39.2% imported)Est. U.S. handgun sales in 2004: 1,822,385 — 27th most in last 35 years (54.0% U.S. made; 46.0% imported)Est. U.S. rifle sales in 2004: 1,827,688 — 22nd most in last 35 years (69.1% U.S. made; 30.9% imported)Est. U.S. shotgun sales in 2004: 1,207,794 — 21st most in last 35 years (58.0% U.S. made; 42.0% imported)
2023 Getty Images / Getty Images News via Getty Images
Est. U.S. firearm sales in 2005: 5,153,487 — 20th most in last 35 years (59.1% U.S. made; 40.9% imported)Est. U.S. handgun sales in 2005: 1,907,335 — 24th most in last 35 years (54.0% U.S. made; 46.0% imported)Est. U.S. rifle sales in 2005: 2,021,374 — 19th most in last 35 years (66.3% U.S. made; 33.7% imported)Est. U.S. shotgun sales in 2005: 1,209,587 — 19th most in last 35 years (54.8% U.S. made; 45.2% imported)
Feifei Cui-Paoluzzo / Moment via Getty Images
Est. U.S. firearm sales in 2006: 5,718,325 — 18th most in last 35 years (57.5% U.S. made; 42.5% imported)Est. U.S. handgun sales in 2006: 2,399,739 — 18th most in last 35 years (51.4% U.S. made; 48.6% imported)Est. U.S. rifle sales in 2006: 2,053,069 — 18th most in last 35 years (67.9% U.S. made; 32.1% imported)Est. U.S. shotgun sales in 2006: 1,263,667 — 12th most in last 35 years (52.0% U.S. made; 48.0% imported)
Joe Raedle / Getty Images News via Getty Images
Est. U.S. firearm sales in 2007: 6,461,824 — 17th most in last 35 years (57.5% U.S. made; 42.5% imported)Est. U.S. handgun sales in 2007: 2,917,743 — 17th most in last 35 years (52.5% U.S. made; 47.5% imported)Est. U.S. rifle sales in 2007: 2,162,110 — 16th most in last 35 years (70.8% U.S. made; 29.2% imported)Est. U.S. shotgun sales in 2007: 1,344,034 — 8th most in last 35 years (46.0% U.S. made; 54.0% imported)
Anadolu Agency / Anadolu Agency via Getty Images
Est. U.S. firearm sales in 2008: 6,876,842 — 14th most in last 35 years (62.1% U.S. made; 37.9% imported)Est. U.S. handgun sales in 2008: 3,426,961 — 14th most in last 35 years (57.2% U.S. made; 42.8% imported)Est. U.S. rifle sales in 2008: 2,232,356 — 15th most in last 35 years (73.0% U.S. made; 27.0% imported)Est. U.S. shotgun sales in 2008: 1,125,484 — 25th most in last 35 years (52.4% U.S. made; 47.6% imported)
DOMINICK REUTER / AFP via Getty Images
Est. U.S. firearm sales in 2009: 8,968,180 — 11th most in last 35 years (59.8% U.S. made; 40.2% imported)Est. U.S. handgun sales in 2009: 4,511,091 — 11th most in last 35 years (51.6% U.S. made; 48.4% imported)Est. U.S. rifle sales in 2009: 3,051,789 — 9th most in last 35 years (71.7% U.S. made; 28.3% imported)Est. U.S. shotgun sales in 2009: 1,274,923 — 11th most in last 35 years (56.2% U.S. made; 43.8% imported)
Anadolu Agency / Anadolu Agency via Getty Images
Est. U.S. firearm sales in 2010: 8,057,210 — 12th most in last 35 years (64.8% U.S. made; 35.2% imported)Est. U.S. handgun sales in 2010: 4,494,635 — 12th most in last 35 years (60.3% U.S. made; 39.7% imported)Est. U.S. rifle sales in 2010: 2,301,487 — 14th most in last 35 years (76.2% U.S. made; 23.8% imported)Est. U.S. shotgun sales in 2010: 1,209,930 — 18th most in last 35 years (57.9% U.S. made; 42.1% imported)
TIMOTHY A. CLARY / AFP via Getty Images
Est. U.S. firearm sales in 2011: 9,497,402 — 10th most in last 35 years (65.8% U.S. made; 34.2% imported)Est. U.S. handgun sales in 2011: 4,752,010 — 10th most in last 35 years (63.7% U.S. made; 36.3% imported)Est. U.S. rifle sales in 2011: 3,236,904 — 8th most in last 35 years (69.2% U.S. made; 30.8% imported)Est. U.S. shotgun sales in 2011: 1,336,579 — 10th most in last 35 years (60.4% U.S. made; 39.6% imported)
Boston Globe / Boston Globe via Getty Images
Est. U.S. firearm sales in 2012: 13,135,646 — 4th most in last 35 years (63.1% U.S. made; 36.9% imported)Est. U.S. handgun sales in 2012: 6,634,485 — 7th most in last 35 years (60.4% U.S. made; 39.6% imported)Est. U.S. rifle sales in 2012: 4,330,775 — 4th most in last 35 years (71.3% U.S. made; 28.7% imported)Est. U.S. shotgun sales in 2012: 1,879,617 — 3rd most in last 35 years (48.2% U.S. made; 51.8% imported)
Anadolu Agency / Anadolu Agency via Getty Images
Est. U.S. firearm sales in 2013: 15,991,210 — 3rd most in last 35 years (65.4% U.S. made; 34.6% imported)Est. U.S. handgun sales in 2013: 8,073,647 — 3rd most in last 35 years (61.7% U.S. made; 38.3% imported)Est. U.S. rifle sales in 2013: 5,355,628 — the most in last 35 years (71.8% U.S. made; 28.2% imported)Est. U.S. shotgun sales in 2013: 2,089,541 — 2nd most in last 35 years (55.2% U.S. made; 44.8% imported)
Anadolu Agency / Anadolu Agency via Getty Images
Est. U.S. firearm sales in 2014: 12,254,962 — 8th most in last 35 years (70.4% U.S. made; 29.6% imported)Est. U.S. handgun sales in 2014: 6,410,701 — 8th most in last 35 years (65.9% U.S. made; 34.1% imported)Est. U.S. rifle sales in 2014: 3,963,507 — 5th most in last 35 years (80.0% U.S. made; 20.0% imported)Est. U.S. shotgun sales in 2014: 1,523,373 — 5th most in last 35 years (57.4% U.S. made; 42.6% imported)
picture alliance / picture alliance via Getty Images
Est. U.S. firearm sales in 2015: 12,945,416 — 5th most in last 35 years (69.6% U.S. made; 30.4% imported)Est. U.S. handgun sales in 2015: 6,749,106 — 6th most in last 35 years (63.4% U.S. made; 36.6% imported)Est. U.S. rifle sales in 2015: 4,347,909 — 3rd most in last 35 years (81.2% U.S. made; 18.8% imported)Est. U.S. shotgun sales in 2015: 1,402,769 — 7th most in last 35 years (54.1% U.S. made; 45.9% imported)
Anadolu Agency / Anadolu Agency via Getty Images
Est. U.S. firearm sales in 2016: 16,258,394 — 2nd most in last 35 years (68.4% U.S. made; 31.6% imported)Est. U.S. handgun sales in 2016: 9,051,208 — 2nd most in last 35 years (59.4% U.S. made; 40.6% imported)Est. U.S. rifle sales in 2016: 4,821,743 — 2nd most in last 35 years (84.9% U.S. made; 15.1% imported)Est. U.S. shotgun sales in 2016: 1,560,431 — 4th most in last 35 years (52.8% U.S. made; 47.2% imported)
artas / iStock via Getty Images
Est. U.S. firearm sales in 2017: 12,331,748 — 7th most in last 35 years (63.6% U.S. made; 36.4% imported)Est. U.S. handgun sales in 2017: 7,402,669 — 4th most in last 35 years (55.6% U.S. made; 44.4% imported)Est. U.S. rifle sales in 2017: 2,917,530 — 10th most in last 35 years (80.4% U.S. made; 19.6% imported)Est. U.S. shotgun sales in 2017: 1,255,247 — 13th most in last 35 years (49.6% U.S. made; 50.4% imported)
artas / iStock via Getty Images
Est. U.S. firearm sales in 2018: 12,804,242 — 6th most in last 35 years (66.4% U.S. made; 33.6% imported)Est. U.S. handgun sales in 2018: 7,131,118 — 5th most in last 35 years (58.8% U.S. made; 41.2% imported)Est. U.S. rifle sales in 2018: 3,366,994 — 7th most in last 35 years (80.6% U.S. made; 19.4% imported)Est. U.S. shotgun sales in 2018: 1,222,283 — 16th most in last 35 years (41.6% U.S. made; 58.4% imported)
Spencer Platt / Getty Images News via Getty Images
Est. U.S. firearm sales in 2019: 10,681,126 — 9th most in last 35 years (62.7% U.S. made; 37.3% imported)Est. U.S. handgun sales in 2019: 6,067,861 — 9th most in last 35 years (57.2% U.S. made; 42.8% imported)Est. U.S. rifle sales in 2019: 2,470,129 — 12th most in last 35 years (73.7% U.S. made; 26.3% imported)Est. U.S. shotgun sales in 2019: 1,201,668 — 22nd most in last 35 years (38.1% U.S. made; 61.9% imported)
Spencer Platt / Getty Images News via Getty Images
Est. U.S. firearm sales in 2020: 17,366,316 — the most in last 35 years (60.7% U.S. made; 39.3% imported)Est. U.S. handgun sales in 2020: 10,131,519 — the most in last 35 years (60.2% U.S. made; 39.8% imported)Est. U.S. rifle sales in 2020: 3,536,097 — 6th most in last 35 years (75.3% U.S. made; 24.7% imported)Est. U.S. shotgun sales in 2020: 2,383,745 — the most in last 35 years (19.2% U.S. made; 80.8% imported)
Michael Saechang / CC BY-SA 2.0 / Flickr
Est. U.S. firearm sales in 2021: 13,346,235 (U.S.-made firearms only)Est. U.S. handgun sales in 2021: 7,649,276 (U.S.-made handguns only)Est. U.S. rifle sales in 2021: 3,774,080 (U.S.-made rifles only)Est. U.S. shotgun sales in 2021: 647,939 (U.S.-made shotguns only)
Est. U.S. firearm sales in 2022: 12,763,846 (U.S.-made firearms only)Est. U.S. handgun sales in 2022: 6,619,082 (U.S.-made handguns only)Est. U.S. rifle sales in 2022: 3,359,975 (U.S.-made rifles only)Est. U.S. shotgun sales in 2022: 619,038 (U.S.-made shotguns only)
The Average American Has No Idea How Much Money You Can Make Today (Sponsor)
The last few years made people forget how much banks and CD’s can pay. Meanwhile, interest rates have spiked and many can afford to pay you much more, but most are keeping yields low and hoping you won’t notice.
But there is good news. To win qualified customers, some accounts are paying almost 10x the national average! That’s an incredible way to keep your money safe and earn more at the same time. Our top pick for high yield savings accounts includes other benefits as well. You can earn up to 3.80% with a Checking & Savings Account today Sign up and get up to $300 with direct deposit. No account fees. FDIC Insured.
Click here to see how much more you could be earning on your savings today . It takes just a few minutes to open an account to make your money work for you.
Our top pick for high yield savings accounts includes other benefits as well. You can earn up to 4.00% with a Checking & Savings Account from Sofi. Sign up and get up to $300 with direct deposit. No account fees. FDIC Insured.
1 https://www.fdic.gov/national-rates-and-rate-caps
Thank you for reading! Have some feedback for us?Contact the 24/7 Wall St. editorial team .


")
