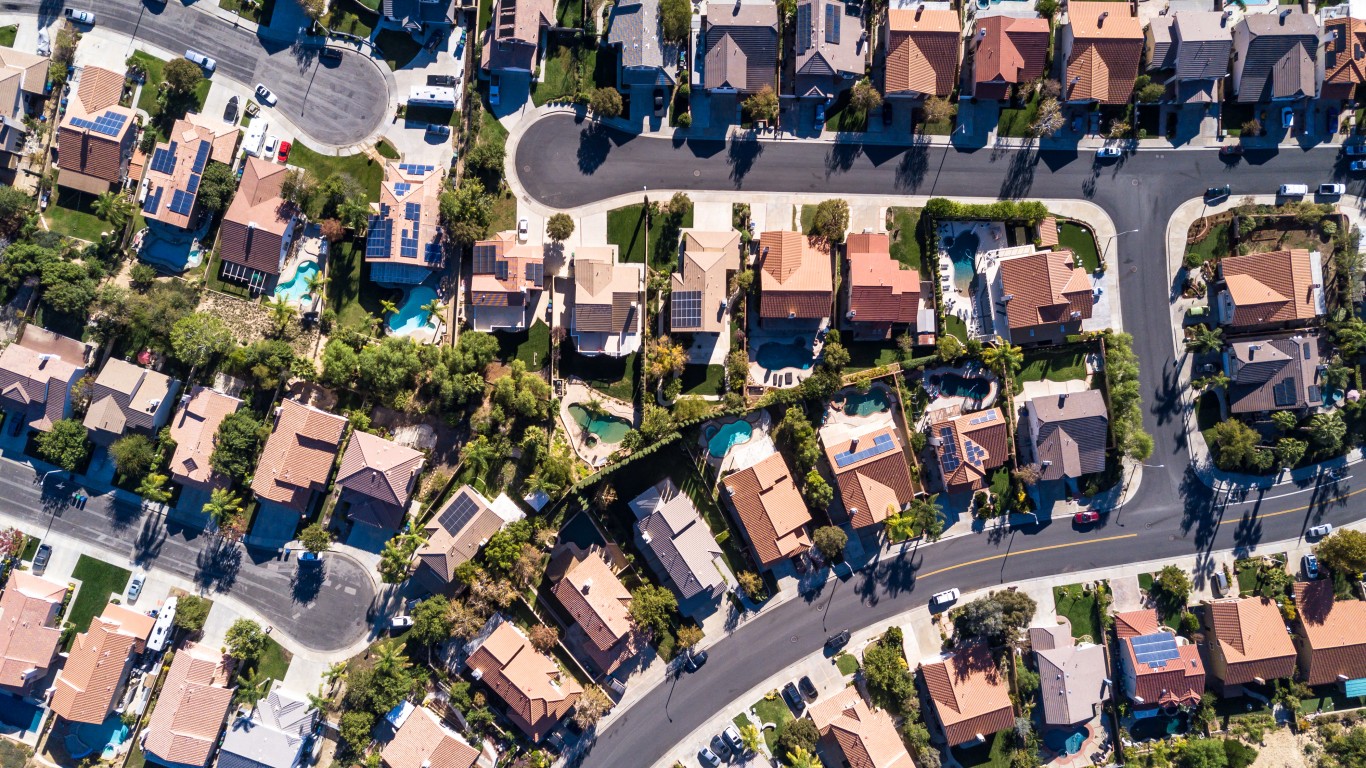
 House flipping’s status as an aspirational American pastime took some hits during the recession but, like disco or SUVs, it has never gone extinct. On the contrary, it is back with a vengeance. Cable TV shows glorify expert flippers and infomercials flog seminars for novice investors eager to dive into this risky market.
Read: The Best Cities to Flip a House
Yet there is a catch. Homebuyers that dabble in flipping homes may vie against Wall St.-funded teams that turn over hundreds or even thousands of distressed properties in short periods.
Although many American housing markets are staging a recovery, there is a deep inventory of foreclosed or bank-owned properties that investors can tap into at below-market prices. And it is working: house flippers have grossed an impressive $29,342 on average for each property in the first half of this year, according to RealtyTrac, a leading supplier of foreclosure industry data. From purchase to sale, the average flipped home is turned around in just 106 days.
Wall St.-backed home flippers enjoy the advantage of scale and cash purchases, says Prof. Christopher Leinberger, head of the real estate program at George Washington University School of Business. That is particularly true in large housing markets such as Las Vegas or Phoenix that have a bounty of bank-owned residences. “I would think that a small player would have a better opportunity in a small town,” Leinberger says.
While small towns within large metropolitan statistical areas (MSAs) sport impressive gross profits, large housing markets such as New York City, Washington, D.C., and San Jose, Calif., boast the most profitable average flipped home sales.
Nearly two-thirds of the homes being flipped are sold to first-time homebuyers who seek a modest, 1,500 square-foot-size starter home — three bedrooms and two baths in a residential neighborhood, for example.
Once predominantly practiced in West Coast metropolitan areas such as Las Vegas, Phoenix and Los Angeles, house-flipping action is not restricted to those areas. Daren Blomquist, VP of RealtyTrac, says, “Investing seems to move from West to East and we’re seeing investors starting to move to East coast markets.”
When it comes to house flipping, of course, location matters greatly. “If you’re looking to do a lot of flips I would avoid overly crowded markets,” advises Blomquist. “But if you’re looking to do a flip or two a year or if you’re getting into it as a hobby or make some income, my advice is stick to the market that you know well. There almost always will be a potential property and a prime opportunity that you can jump on when it [becomes available.]”
24/7 Wall St. asked RealtyTrac for home flip data for the first six months of 2012 for nation’s top 500 MSAs. We highlighted the 10 foreclosure centers where flippers are turning the highest average profits on sales of residential homes this year. We defined foreclosure centers as the best-known cities within metropolitan statistical areas that had an above-average number of house flips in the first half of 2012. We also excluded those markets with fewer than 205 flips in 2012, which was the national average. In addition to these RealtyTrac data, we included in our analysis home price change projections from Fiserv as of the first quarter of 2012. Additional home price data were collected from Trulia.
These are the best cities to in which to flip a house.
10. Seattle-Tacoma-Bellevue, Wash.
> Avg. gross profit: $58,930
> Homes flipped through mid-2012: 1,446
> Avg. home price: $306,878 (30th highest)
> Avg. days to flip: 113
Rising single-family home prices ought to stimulate the greater Seattle housing market, but real estate agents and buyers have complained about inventory constraints. Even foreclosed homes, while still plentiful, are starting to be cleared off bank books. RealtyTrac reports that in the first half of 2012 there were 7,530 foreclosure filings, down 49% from the same period last year. For now, though, home prices are rising slowly. Through the first half of 2012, the average home in Seattle sold for $306,878, an increase of about 1%, or roughly $3,000 from the second half of 2011.
9. San Jose-Sunnyvale-Santa Clara, Calif.
> Avg. gross profit: $61,758
> Homes flipped through mid-2012: 1,102
> Avg. home price: $615,071 (2nd highest)
> Avg. days to flip: 105
If it were not for bank-owned properties coming onto the market, prices — already among the highest in the nation — probably would be even higher due to a lack of single-family home inventory. According to Trulia, in San Jose there are 1,225 resale and new homes on the market, which pales in comparison to 3,661 homes in the various stages of the foreclosure process. Through June 2012, the average sale price for a foreclosed property in San Jose was $393,156. While expensive, this was still a 42.4% discount from the average price of $682,021 for a nonforeclosed home in the area.
Also Read: Small Towns with Soaring Housing Markets
8. Richmond, Va.
> Avg. gross profit: $65,092
> Homes flipped through mid-2012: 385
> Avg. home price: $196,319 (116th highest)
> Avg. days to flip: 109
In Richmond, a well-known hub of current or former defense industry workers, the housing recovery has been slow to take hold. The number of housing sales has dropped nearly 25% since the same time last year, according to Trulia. Richmond’s average sales price has dropped by $7,936 compared to last year. The number of bank-owned or foreclosed properties has stayed fairly constant on a year-over-year basis.
7. Philadelphia-Camden-Wilmington, Pa.-N.J.-Del.-Md.
> Avg. gross profit: $69,212
> Homes flipped through mid-2012: 819
> Avg. home price: $213,156 (92nd highest)
> Avg. days to flip: 110
It is small wonder that with high resale prices, coupled by an ample supply of bank-owned properties, the home-flipping business is picking up steam in the greater Philadelphia market. There were 15,256 foreclosure filings in Philadelphia during the first half of 2012, up almost 30% from the second half of 2011. Sales of foreclosed properties followed, rising almost 25% from the second half of 2011.
6. Raleigh, N.C.
> Avg. gross profit: $69,253
> Homes flipped through mid-2012: 455
> Avg. home price: $223,359 (78th highest)
> Avg. days to flip: 114
The greater Raleigh area has seen a 63% increase in the number of flipped home sales for the first half of 2012, compared to the first half of 2011, while the available inventory of foreclosed homes has remained constant. And yet, in Raleigh, which is North Carolina’s second-largest housing market after Charlotte, median home prices declined by only 8.2% from prerecession peak value. The U.S. median home price fell by more than 33% during the recession.
5. Omaha-Council Bluffs, Neb.-Iowa
> Avg. gross profit: $71,384
> Homes flipped through mid-2012: 253
> Avg. home price: $196,325 (115th highest)
> Avg. days to flip: 117
In the first half of 2012, house flipping more than doubled in volume in the greater Omaha region, compared to the same period in 2011. In that time, foreclosed housing inventory rose by nearly one-third. These flipped homes may be slowing a broader recovery in the local housing market because home prices have decreased by 20% on a year-over-year basis, according to Trulia data.
4. Washington-Arlington-Alexandria, D.C.-Va.-Md.-W. Va.
> Avg. gross profit: $72,297
> Homes flipped through mid-2012: 1,925
> Avg. home price: $370,919 (20th highest)
> Avg. days to flip: 110
Conditions are right for a boom year for house flippers in the Washington, D.C., area. First, there’s a decline in the available stock of foreclosed properties in the greater Washington, D.C., housing market, according to RealtyTrac data, which has strained the inventory of single-family homes for sale. Demand is rising for homes in the area, and sales volume is up by more than 22% compared to last year, according to Trulia.
Also Read: Ten Towns That Cannot Turnaround
3. Oxnard-Thousand Oaks-Ventura, Calif.
> Avg. gross profit: $78,106
> Homes flipped through mid-2012: 535
> Avg. home price: $416,790 (14th highest)
> Avg. days to flip: 112
In an area where one in every 62 homes is in foreclosure, news of a decrease in the supply of foreclosure filings must seem like welcome news to the local housing market. Still, the greater Ventura area is highly appealing to house flippers because the heavily discounted properties are sold quickly for significant gross profits, according to RealtyTrac data. The housing market of Ventura’s metropolitan region, the Oxnard-Thousand Oaks-Ventura MSA, was one of the biggest decliners in the country, falling by 43.6% from its peak in the first quarter of 2006, the median home price in the area fell by 43.6%.
2. Lake Havasu City-Kingman, Ariz.
> Avg. gross profit: $87,513
> Homes flipped through mid-2012: 219
> Avg. home price: $114,578 (216th lowest)
> Avg. days to flip: 99
Lake Havasu may not be a nationally renowned house-flipping Mecca, but gross profits reported this year may soon burnish its reputation. Yet the party willnot last as long as its neighboring area of Phoenix, which has a substantially larger inventory of foreclosed properties. Foreclosure filing decreased by 37% in the first half of 2012, compared to the same period in 2011. Foreclosed property buyers in Lake Havasu paid an average price of $108,078 in the first six months of 2012 — when the average foreclosed property was flipped for a profit of $87,513.
1. New York-Northern New Jersey-Long Island, N.Y.-N.J.-Pa.
> Avg. gross profit: $118,376
> Homes flipped through mid-2012: 949
> Avg. home price: $441,910 (13th highest)
> Avg. days to flip: 118
The New York area is the largest housing market in the United States, with more than 7.5 million housing units and nearly 18.9 million residents. And true to its big league reputation, there is no more profitable place for house flippers to turn around distressed properties, according to RealtyTrac data. But the available supply of foreclosed homes is slowly waning, off 14% in the first half of 2012 compared to the prior year. This has limited foreclosure sales, which fell 23.7% year-over-year. In the first six months of this year, the average foreclosed home sold at a discount of 39.4% to the average nonforeclosed home, down from 45.1% the year before.
-Rusty Weston
Also Read: Cities with the Most Homes in Foreclosure
Get Ready To Retire (Sponsored)
Start by taking a quick retirement quiz from SmartAsset that will match you with up to 3 financial advisors that serve your area and beyond in 5 minutes, or less.
Each advisor has been vetted by SmartAsset and is held to a fiduciary standard to act in your best interests.
Here’s how it works:
1. Answer SmartAsset advisor match quiz
2. Review your pre-screened matches at your leisure. Check out the advisors’ profiles.
3. Speak with advisors at no cost to you. Have an introductory call on the phone or introduction in person and choose whom to work with in the future
Get started right here.
Thank you for reading! Have some feedback for us?
Contact the 24/7 Wall St. editorial team.


