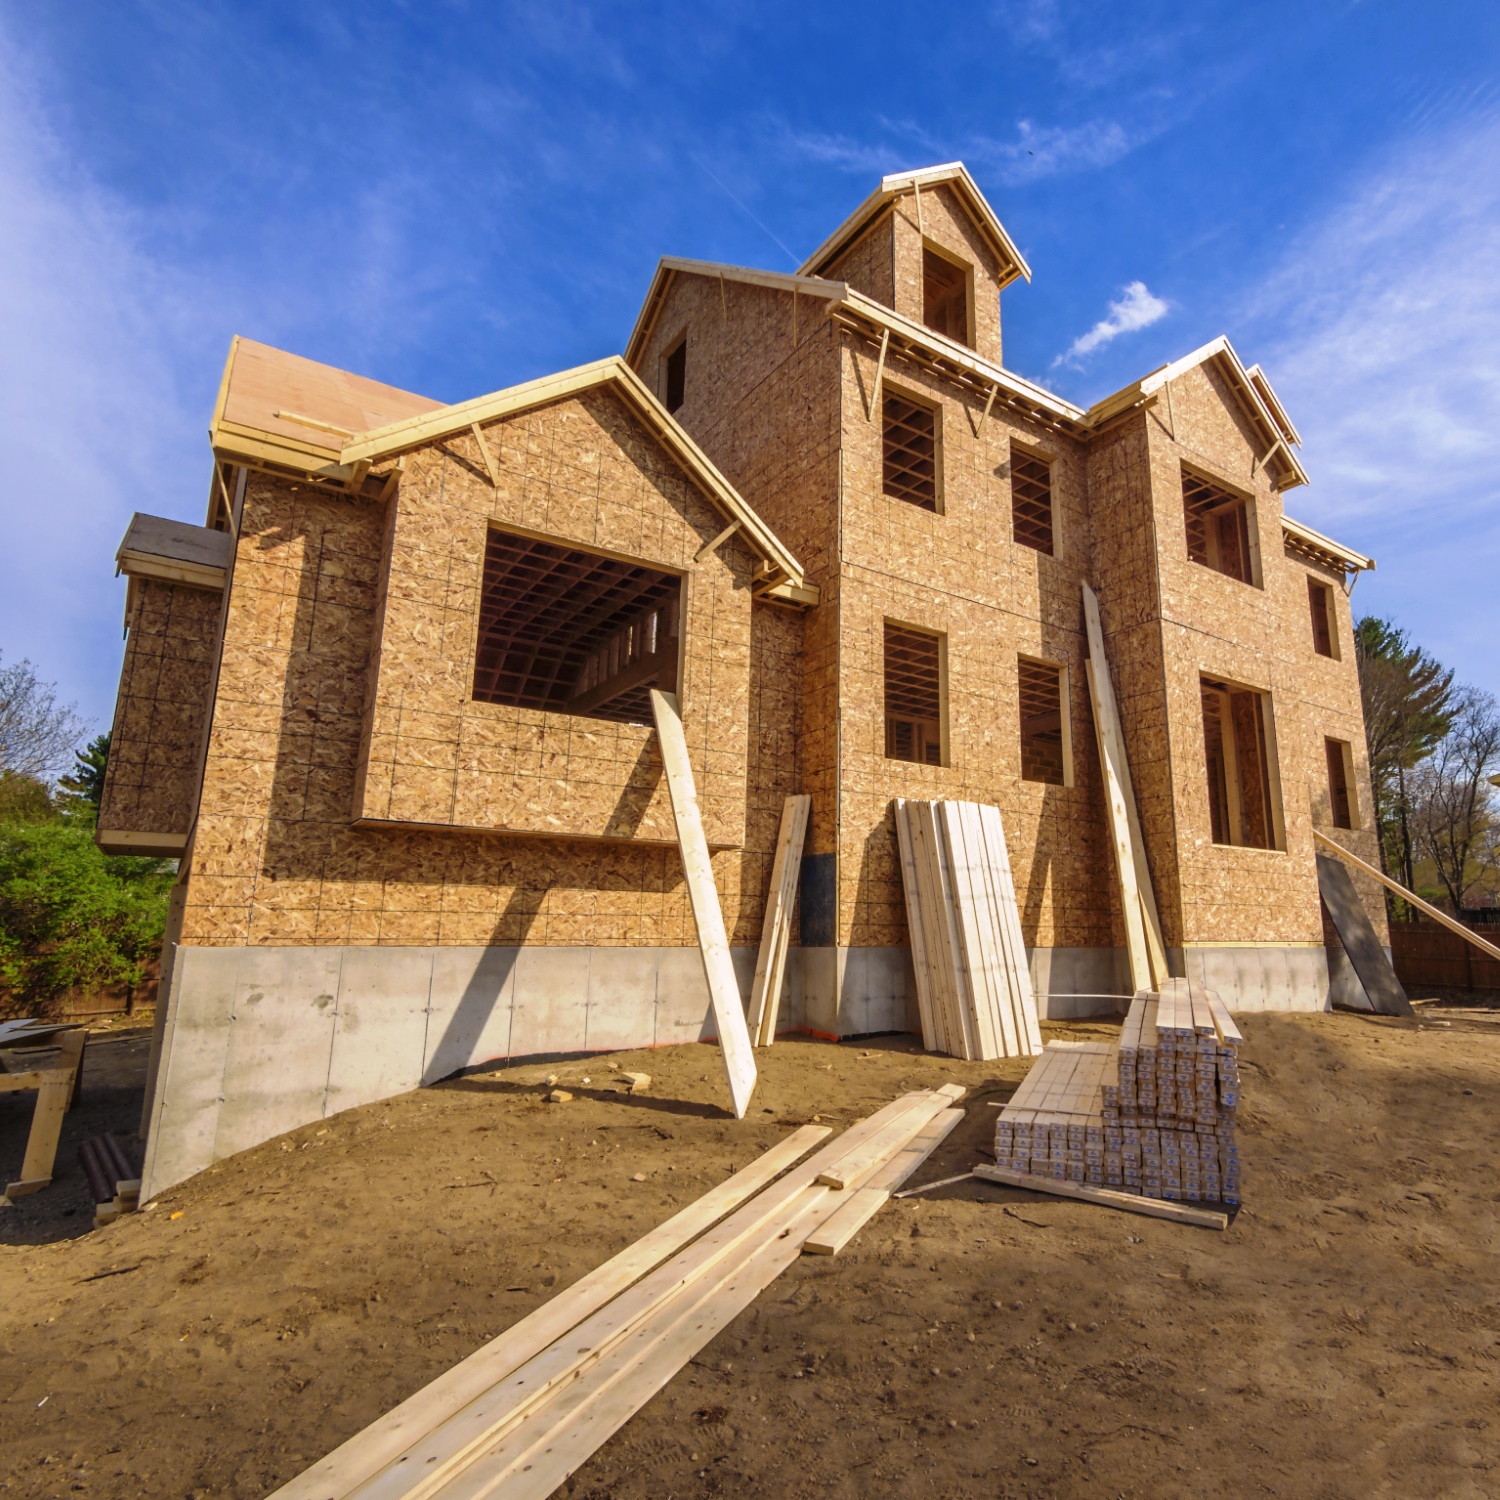
While U.S. home prices have been on the rise for the past few years, that increase is due in part to a lack of inventory of houses for sale. This is happening despite steady, if not exciting, employment gains.
The historical ratio of jobs to new building permits is 1.6, according to a report from the National Association of Realtors (NAR), compared with a ratio of 3.4 today. More than 80% of the 171 housing markets included in the NAR study had ratios above the historical average.
Lawrence Yun, the NAR’s chief economist said:
Inadequate single-family home construction since the Great Recession has had a detrimental impact on the housing market by accelerating price growth and making it very difficult for prospective buyers to find an affordable home – especially young adults. Without the expected pick-up in building as job gains rose in recent years, new and existing inventory has shrunk, prices have shot up and affordability has eroded despite mortgage rates at or near historic lows.
Using its own data plus data from the Bureau of Labor Statistics and the Census Bureau, NAR was able to calculate an implied shortfall in the number of permits based on the ratio three-year job gains (2013 through 2015) to the number of building permits issued. Here are the 10 cities with the largest shortfalls in new building permits:
- New York (218,541 permits required)
- Dallas (132,482 permits required)
- San Francisco (127,412 permits required)
- Miami (118,937 permits required)
- Chicago (94,457 permits required)
- Atlanta (93,627 permits required)
- Seattle (73,135 permits required)
- San Jose, California (69,042 permits required)
- Denver (67,403 permits required)
- San Diego (55,825 permits required)
The 10 metro areas with the highest ratios of jobs to permits compared with the historical average of 1.6 are:
- Trenton, New Jersey: 25.1
- San Jose, California: 21.1
- San Francisco, California: 18.2
- San Diego, California: 12.3
- New York City: 12.1
- Rockford, Illinois: 12.1
- Miami, Florida: 11.4
- Reading, Pennsylvania: 10.3
- Springfield, Massachusetts: 10.2
- Hartford, Connecticut: 10.1
All told 138 of the cities NAR reviewed had jobs-to-permits ratios higher than the historical average of 1.6. The full list of all 171 cities is available at the NAR Website.
The Average American Has No Idea How Much Money You Can Make Today (Sponsor)
The last few years made people forget how much banks and CD’s can pay. Meanwhile, interest rates have spiked and many can afford to pay you much more, but most are keeping yields low and hoping you won’t notice.
But there is good news. To win qualified customers, some accounts are paying almost 10x the national average! That’s an incredible way to keep your money safe and earn more at the same time. Our top pick for high yield savings accounts includes other benefits as well. You can earn up to 3.80% with a Checking & Savings Account today Sign up and get up to $300 with direct deposit. No account fees. FDIC Insured.
Click here to see how much more you could be earning on your savings today. It takes just a few minutes to open an account to make your money work for you.
Our top pick for high yield savings accounts includes other benefits as well. You can earn up to 4.00% with a Checking & Savings Account from Sofi. Sign up and get up to $300 with direct deposit. No account fees. FDIC Insured.
Thank you for reading! Have some feedback for us?
Contact the 24/7 Wall St. editorial team.
Latest from 24/7


Our expert who first called NVIDIA in 2009 is predicting 2025 will see a historic AI breakthrough.
You can follow him investing $500,000 of his own money on our top AI stocks for free.