Home price data has given the impression that values have risen in almost every part of the country this past year. Leading research, like the S&P CoreLogic Case-Shiller Home Price Indices, shows improvements across all major markets. Among the reasons given are historically low-interest rates and baby boomers who want to cash in on positive home equity. However, the picture painted by prices on a more granular basis shows a wide range of price changes across America’s 248 largest markets.
The Federal Housing Finance Agency issues its FHFA House Price Index (FHFA HPI) once a quarter. The index covers all 50 states and, in some periods, up to 400 markets. The most recent data cover home prices through the third quarter of 2020 and compare them to quarterly, annual and five-year changes.
24/7 Wall St. looked at the annual home price changes from the end of the quarter using the FHFA HPI data.
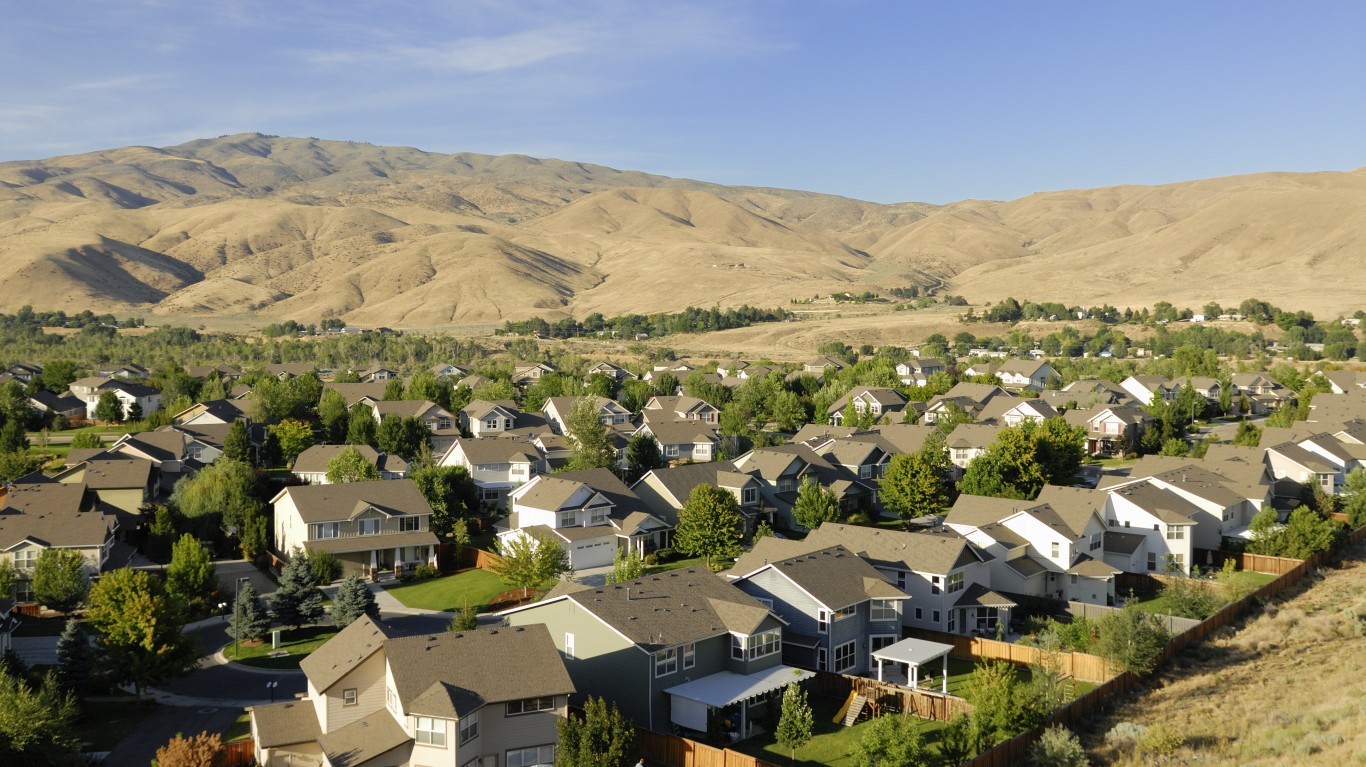
Housing markets with high home price increases were often located in Idaho, Washington and Utah. In fact, Idaho cities held the top three places. Prices rose 11.33% in Idaho Falls, 10.23% in Boise City and 10.13% in Coeur d’Alene. Anecdotal evidence exists that Idaho is among the places people in California’s large cities have moved due to the COVID-19 pandemic. The same has been said of cities in Utah and Washington. Some other cities are harder to explain. These include Fort Wayne, Indiana, where prices have risen 7.22% in the past year, and Huntsville, Alabama, where they are 8.27% higher.
[nativounit]
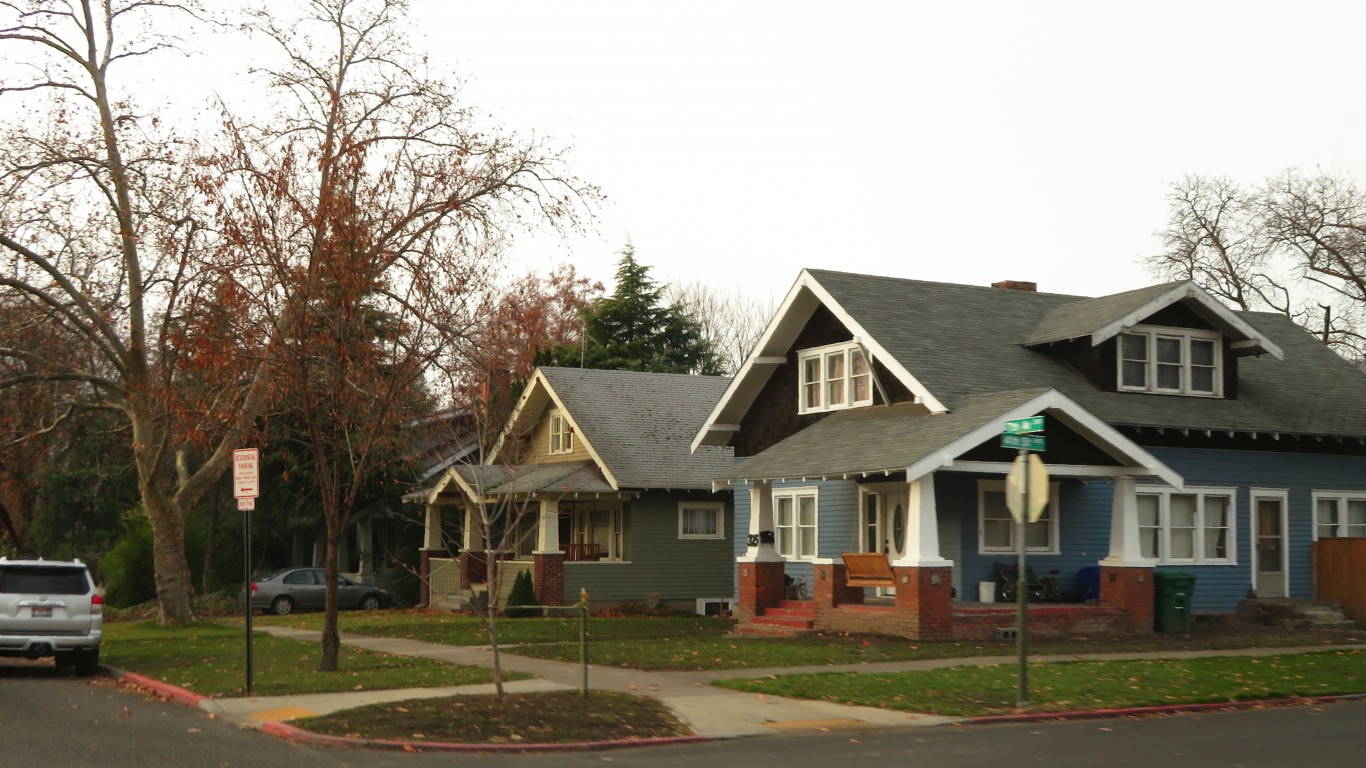
The places home prices have fallen in the past year, or increased very little, are dominated by expensive cities people may have left both for the chance to “get more house for the money” or move to less congested areas as COVID-19 has spread. San Francisco has been hit the hardest, based on home prices over the past year, down 4.92%. In nearby San Rafael, they have fallen 1.97%.
Several other cities on the list of where home prices have faltered include large metros like Chicago, where prices have risen only 2.23%. Less easy to explain are groups of cities in Iowa and other places in Illinois.
Mortgage interest rates are expected to stay low, well into 2021. So, due to affordability, the housing market should stay hot in most places. However, if 2020 shows anything, it is that home prices changes are very uneven.
[recirclink id=827103]
| Metro Area | Rank | 1-Year Change | 5-Year Change |
|---|---|---|---|
| Idaho Falls, Idaho | 1 | 11.33% | 62.94% |
| Boise City, Idaho | 2 | 10.23% | 74.35% |
| Coeur d’Alene, Idaho | 3 | 10.13% | 63.70% |
| Olympia, Washington | 4 | 9.08% | 50.11% |
| Spokane, Washington | 5 | 9.06% | 58.03% |
| Tacoma, Washington | 6 | 8.59% | 62.21% |
| Yakima, Washington | 7 | 8.49% | 45.65% |
| Bremerton, Washington | 8 | 8.46% | 52.24% |
| Lake Havasu City, Arizona | 9 | 8.44% | 48.45% |
| Phoenix, Arizona | 10 | 8.32% | 44.76% |
| Huntsville, Alabama | 11 | 8.27% | 27.22% |
| Pueblo, Colorado | 12 | 8.07% | 50.24% |
| Longview, Washington | 13 | 7.75% | 53.94% |
| Athens, Georgia | 14 | 7.63% | 41.82% |
| Ogden, Utah | 15 | 7.56% | 49.77% |
| Fort Wayne, Indiana | 16 | 7.22% | 36.30% |
| Tucson, Arizona | 17 | 7.15% | 38.43% |
| Salt Lake City, Utah | 18 | 7.07% | 47.72% |
| Chattanooga, Tennessee | 19 | 7.06% | 33.18% |
| Logan, Utah | 20 | 7.04% | 46.27% |
| Metro Area | Rank | 1-Year Change | 5-Year Change |
|---|---|---|---|
| San Francisco, California | 248 | −4.94% | 16.84% |
| San Rafael, California | 247 | −1.97% | 12.53% |
| San Jose, California | 246 | −1.76% | 19.86% |
| Honolulu, Hawaii | 245 | −0.84% | 15.70% |
| Santa Cruz, California | 244 | 0.07% | 21.95% |
| Bismarck, North Dakota | 243 | 1.44% | 5.54% |
| Oakland, California | 242 | 1.51% | 28.65% |
| Iowa City, Iowa | 241 | 1.52% | 14.45% |
| Lake County, Illinois | 240 | 1.53% | 14.59% |
| Waterloo, Iowa | 239 | 1.57% | 12.16% |
| Santa Rosa, California | 238 | 1.57% | 26.47% |
| Springfield, Illinois | 237 | 1.87% | 7.90% |
| Davenport, Iowa | 236 | 2.07% | 13.62% |
| Des Moines, Iowa | 235 | 2.19% | 19.86% |
| Elgin, Illinois | 234 | 2.19% | 18.35% |
| Champaign, Illinois | 233 | 2.19% | 10.79% |
| Chicago, Illinois | 232 | 2.23% | 16.48% |
| Bloomington, Illinois | 231 | 2.41% | 4.75% |
| Fargo, North Dakota | 230 | 2.42% | 15.30% |
| Napa, California | 229 | 2.56% | 26.99% |
[wallst_email_signup]