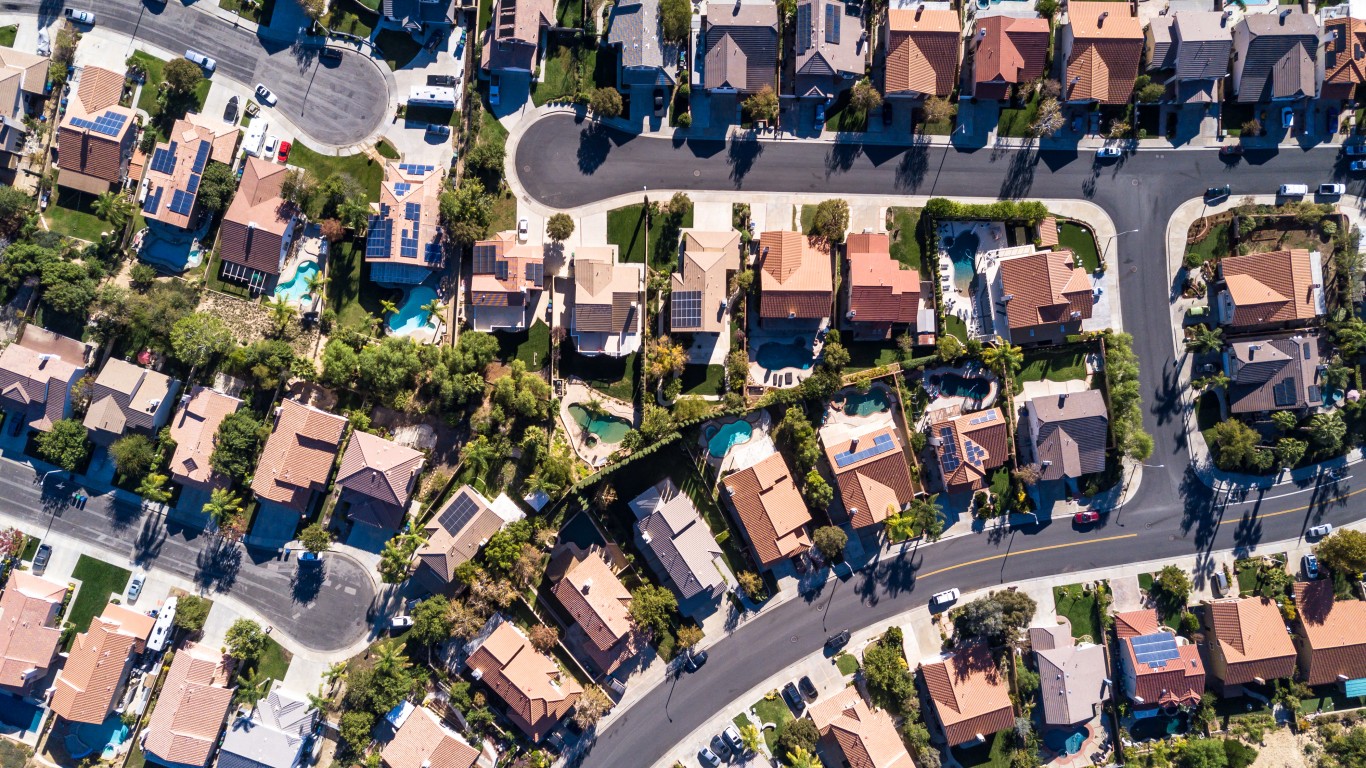
Home sales and prices have skyrocketed in the past year. Among the reasons are low mortgage rates that have shrunken inventory in some places, middle-class incomes that have held steady during the pandemic, and people who want to flee big cities for suburbs. In many markets, prices have risen by low double-digit percentages since early last year. In desirable suburbs near some cities, home prices, particularly of expensive houses, are up 50% or more.
A number of organizations track home prices. These include real estate websites like Realtor.com and Zillow, as well as data companies like ATTOM. The gold standard of home prices remains the S&P CoreLogic Case-Shiller Index, which measures prices back to January 2000.
The new Case-Shiller data cover February and compare prices nationally and in the 20 largest markets to the same month last year and the previous month of January 2021. The national composite index rose 12.0% for the month compared to the same month last year. Craig J. Lazzara, Managing Director and Global Head of Index Investment Strategy at S&P DJI, said:
More than 30 years of S&PCoreLogic Case-Shiller data help us to put February’s results into historical context. The National Composite’s 12.0% gain is the highest recorded since February 2006, exactly 15 years ago, and lies comfortably in the top decile of historical performance.
He added that much of the rise in prices was due to migration from city centers to suburbs because of the COVID-19 pandemic.
The data shows that not all markets are created equal. Phoenix topped the list of 20 cities measured, with 17.5% growth in one year. San Diego followed at 17.0%, then Seattle at 15.4%. Among all regions, prices rose the most in the west, where the gain was 13.0%.
The city that lagged all others in February over the same month of last year was Chicago, which saw a gain of only 8.6%. The only other city with less than a double-digit increase was Las Vegas at 9.1%. In Las Vegas, the pandemic may have killed tourism, but Case-Shiller gave no reason for the low Chicago number.
Here are the one-year home price increases in America’s 20 largest cities:
- Atlanta, 10.0%
- Boston, 13.7%
- Charlotte, 11.7%
- Chicago, 8.6%
- Cleveland, 12.5%
- Dallas, 10.9%
- Denver, 11.2%
- Detroit, 11.7%
- Las Vegas, 9.1%
- Los Angeles, 11.9%
- Miami, 11.0%
- Minneapolis, 10.4%
- New York, 11.6%
- Phoenix, 17.4%
- Portland, 11.4%
- San Diego, 17.0%
- San Francisco, 11.0%
- Seattle, 15.4%
- Tampa, 12.7%
- Washington, 11.1%
Click here to see the housing markets where prices are rising fastest.
“The Next NVIDIA” Could Change Your Life
If you missed out on NVIDIA’s historic run, your chance to see life-changing profits from AI isn’t over.
The 24/7 Wall Street Analyst who first called NVIDIA’s AI-fueled rise in 2009 just published a brand-new research report named “The Next NVIDIA.”
Click here to download your FREE copy.
Thank you for reading! Have some feedback for us?
Contact the 24/7 Wall St. editorial team.


