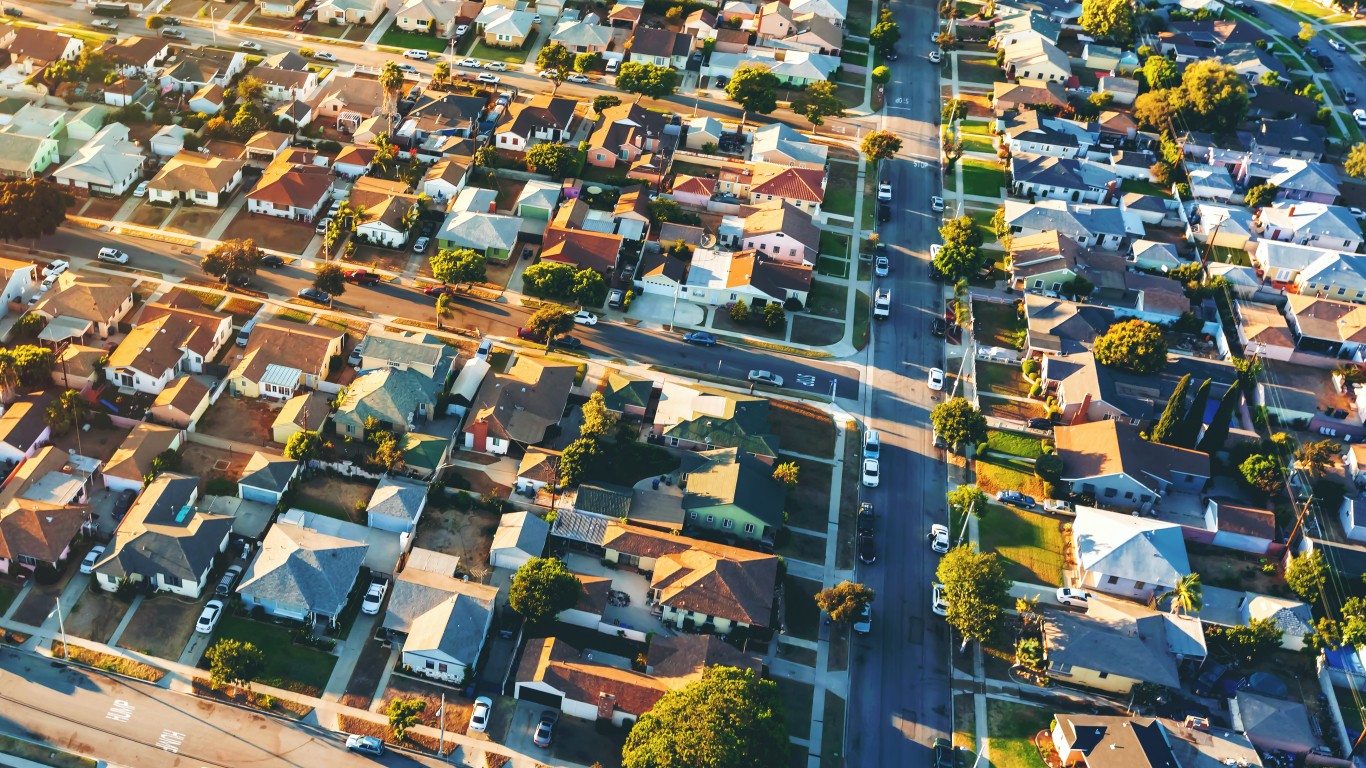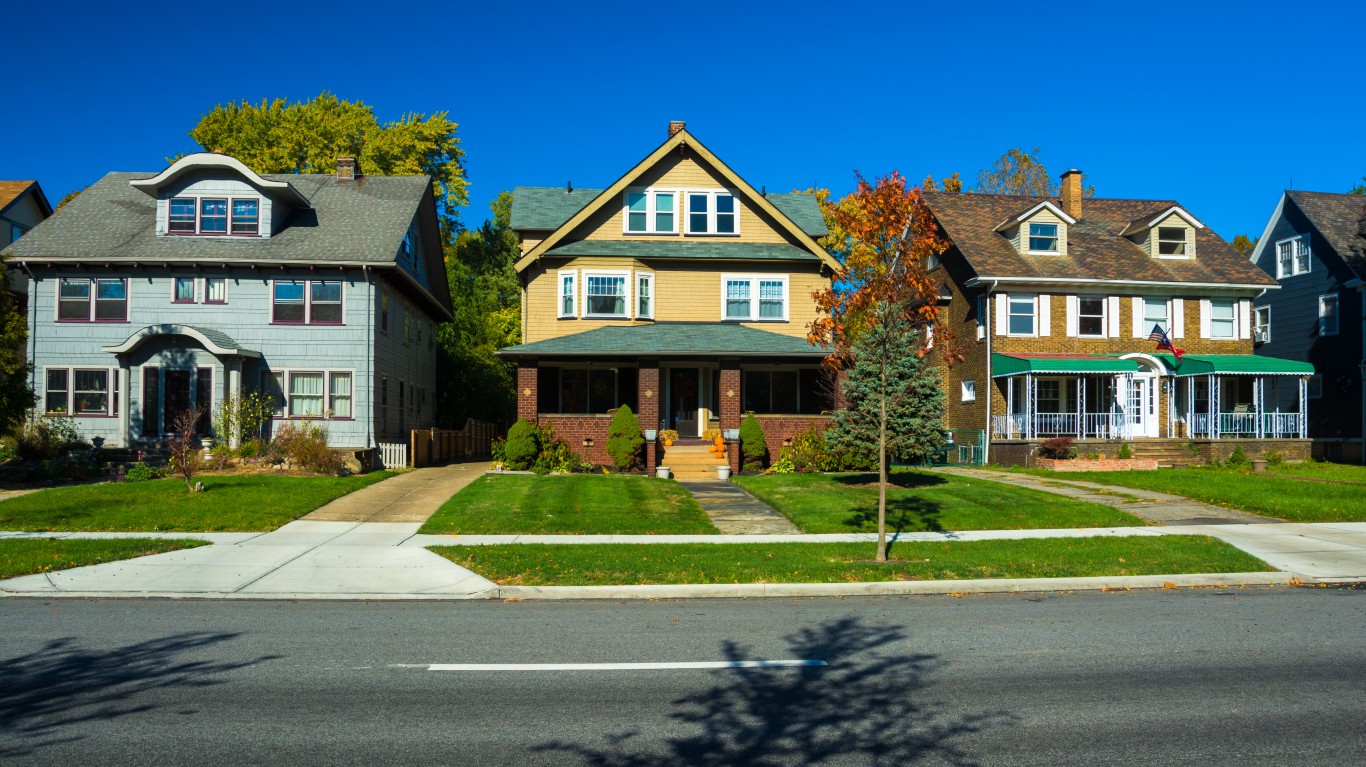
Home prices in the United States have surged, accelerating in the past year, and the huge price drops from the Great Recession have disappeared. In some cases, markets have even gotten back to 2006 peaks. The carefully followed S&P CoreLogic Case-Shiller Home Price Indices showed that home prices rose 19.8% in August. In three of the top 20 markets (Phoenix, Tampa and San Diego) the increase was by more than 25%.
Home prices almost certainly will continue to rise at a pace similar to the recent one. Many Americans have elected to move from expensive coastal cities like New York and San Francisco to smaller cities inland that are less expensive and perceived to offer a better quality of life. This, in turn, has driven home prices higher in these markets.
As America hits another period of inflation, after over a decade during which most prices rose very little, cost of living issues will start to plague many people. In fact, real wages have increased very little over the past several decades, according to the Congressional Research Services.
Taken together, low wage increases and fast-rising home prices have made some cities nearly unaffordable, except for by the wealthy.
Among the primary conclusions of Real Estate Witch’s recent study, “U.S. House Prices Are Rising Exponentially Faster Than Income (2021 Data),” is this:
From 2019 to 2021, the average house-price-to-income ratio increased from 4.7 to 5.4 — a 14.9% increase that’s more than double the recommended ratio of 2.6. In other words, homes cost 5.4x what the average person earns in one year.
Looked at another way, home prices have risen 118% since 1965, while real income is higher by 15%. One could, however, quarrel with whether the “recommended” ratio of 2.6 is reasonable.
What is not debatable is that some home markets are wildly expensive.
At the top of the Real Estate Witch list is Los Angeles, with a ratio of 9.8. Home prices are $782,544 and compare to an average income of $80,000. Second is San Jose, with a ratio of 9.1. The average home price of $1,375,589 compares to an income of $151,300. At the far end of the spectrum, the ratio in Pittsburgh is at 2.2, with an average home price of $190,081 and income of $84,800.
These are the nine cities where people can’t afford their homes:
| Location | House-Price-to-Income Ratio | Avg. Home Value |
|---|---|---|
| Los Angeles | 9.8 | $782,544 |
| San Jose | 9.1 | $1,375,589 |
| San Francisco | 8.3 | $1,241,394 |
| San Diego | 7.8 | $737,627 |
| New York | 6.6 | $538,412 |
| Riverside, Calif. | 6.0 | $462,765 |
| Miami-Fort Lauderdale | 5.6 | $342,684 |
| Sacramento | 5.6 | $511,089 |
| Seattle | 5.5 | $633,613 |
Click here to read about the most expensive cities to buy a home in.
The Average American Has No Idea How Much Money You Can Make Today (Sponsor)
The last few years made people forget how much banks and CD’s can pay. Meanwhile, interest rates have spiked and many can afford to pay you much more, but most are keeping yields low and hoping you won’t notice.
But there is good news. To win qualified customers, some accounts are paying almost 10x the national average! That’s an incredible way to keep your money safe and earn more at the same time. Our top pick for high yield savings accounts includes other benefits as well. You can earn up to 3.80% with a Checking & Savings Account today Sign up and get up to $300 with direct deposit. No account fees. FDIC Insured.
Click here to see how much more you could be earning on your savings today. It takes just a few minutes to open an account to make your money work for you.
Our top pick for high yield savings accounts includes other benefits as well. You can earn up to 4.00% with a Checking & Savings Account from Sofi. Sign up and get up to $300 with direct deposit. No account fees. FDIC Insured.
Thank you for reading! Have some feedback for us?
Contact the 24/7 Wall St. editorial team.


