The housing market continues to defy gravity. It may face resistance this year because price increases may push some people out of the market, and mortgages rates, which were near historic lows, have started to rise as well.
The national home price increase, which is almost two years old, was triggered by several things. One was low mortgage rates. Another is that middle- and upper-income families were typically not hurt financially by the brief, COVID-19-driven recession. Many of these people did leave the most expensive real estate markets on the coasts, particularly New York, San Francisco and Los Angeles, for less expensive inland cities. Another cause was that millions of people began to work from home. In some cases, these people are not expected to return to their offices.
The gold standard for real estate prices is the S&P CoreLogic Case-Shiller Home Price Indices. The latest release shows that home prices nationwide rose 18.9% in November. Craig J. Lazzara, managing director at S&P DJI commented: “For the past several months, home prices have been rising at a very high, but decelerating, rate. That trend continued in November 2021.”
Case-Shiller also measures data from America’s 20 largest cities. Prices in 19 of these markets hit all-time highs in December.
Each city has a price index that shows the change in prices over an extended period. In January 2000, Case-Shiller’s researchers gave each of the 20 cities an index of 100. As of November, the national index had risen to 276.12. The city with the largest runup over the period was San Diego at 367.62. The lowest was Detroit at 159.40.
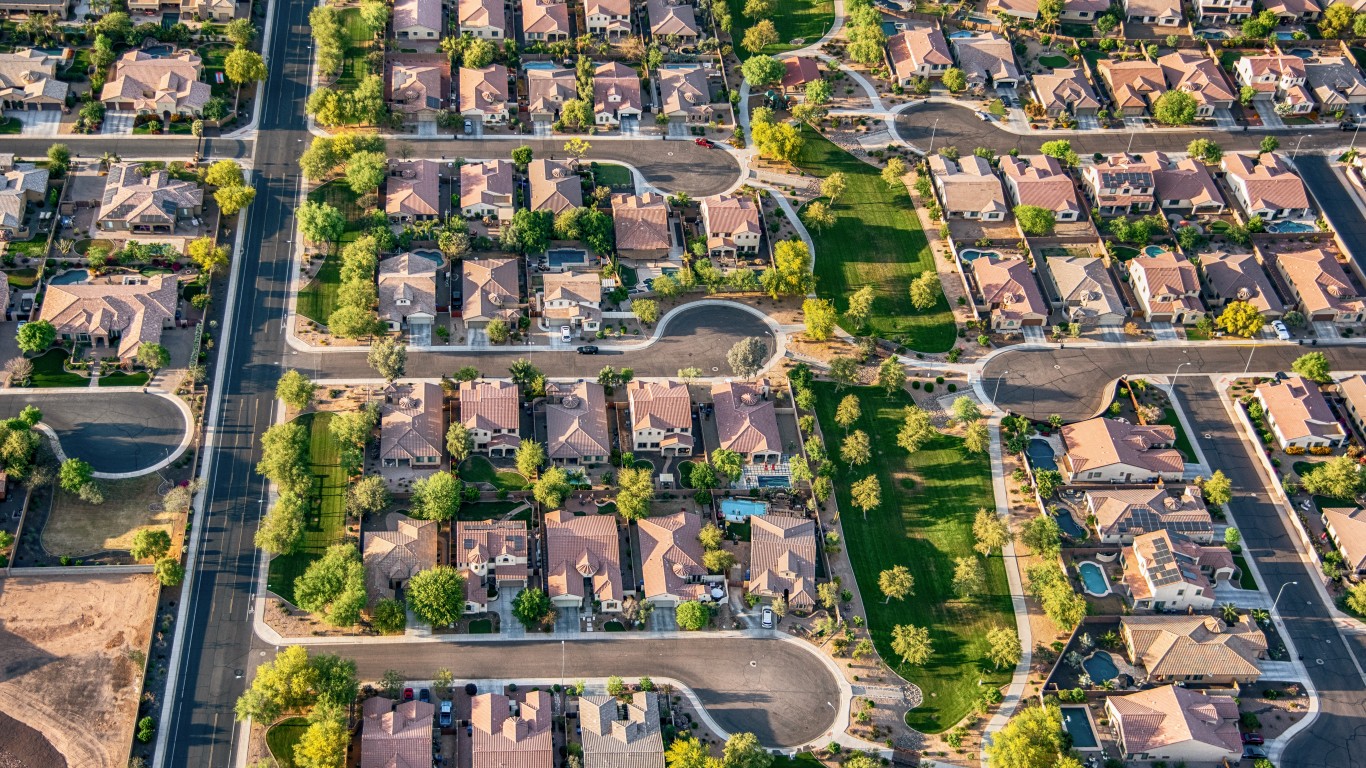
The city with the most rapid price increase in November, compared to the same month in 2020, was Phoenix, with a gain of 32.2%. It was the 30th month in a row that its increase topped that of all 20 cities measured.
Tampa ranked second, up 29.0%, followed by Miami at 26.6%.
These are the home price increases in America’s 20 largest markets:
- Atlanta (21.6%)
- Boston (13.5%)
- Charlotte (22.9%)
- Chicago (11.6%)
- Cleveland (14.0%)
- Dallas (25.0%)
- Denver (20.1%)
- Detroit (14.4%)
- Las Vegas (25.7%)
- Los Angeles (19.0%)
- Miami (26.6%)
- Minneapolis (11.2%)
- New York (13.8%)
- Phoenix (32.2%)
- Portland (17.4%)
- San Diego (24.4%)
- San Francisco (18.2%)
- Seattle (23.3%)
- Tampa (29.0%)
Click here to see the cities where buying a house is most expensive.
Take Charge of Your Retirement: Find the Right Financial Advisor For You in Minutes (Sponsor)
Retirement planning doesn’t have to feel overwhelming. The key is finding professional guidance—and we’ve made it easier than ever for you to connect with the right financial advisor for your unique needs.
Here’s how it works:
1️ Answer a Few Simple Questions
Tell us a bit about your goals and preferences—it only takes a few minutes!
2️ Get Your Top Advisor Matches
This tool matches you with qualified advisors who specialize in helping people like you achieve financial success.
3️ Choose Your Best Fit
Review their profiles, schedule an introductory meeting, and select the advisor who feels right for you.
Why wait? Start building the retirement you’ve always dreamed of. Click here to get started today!
Thank you for reading! Have some feedback for us?
Contact the 24/7 Wall St. editorial team.


