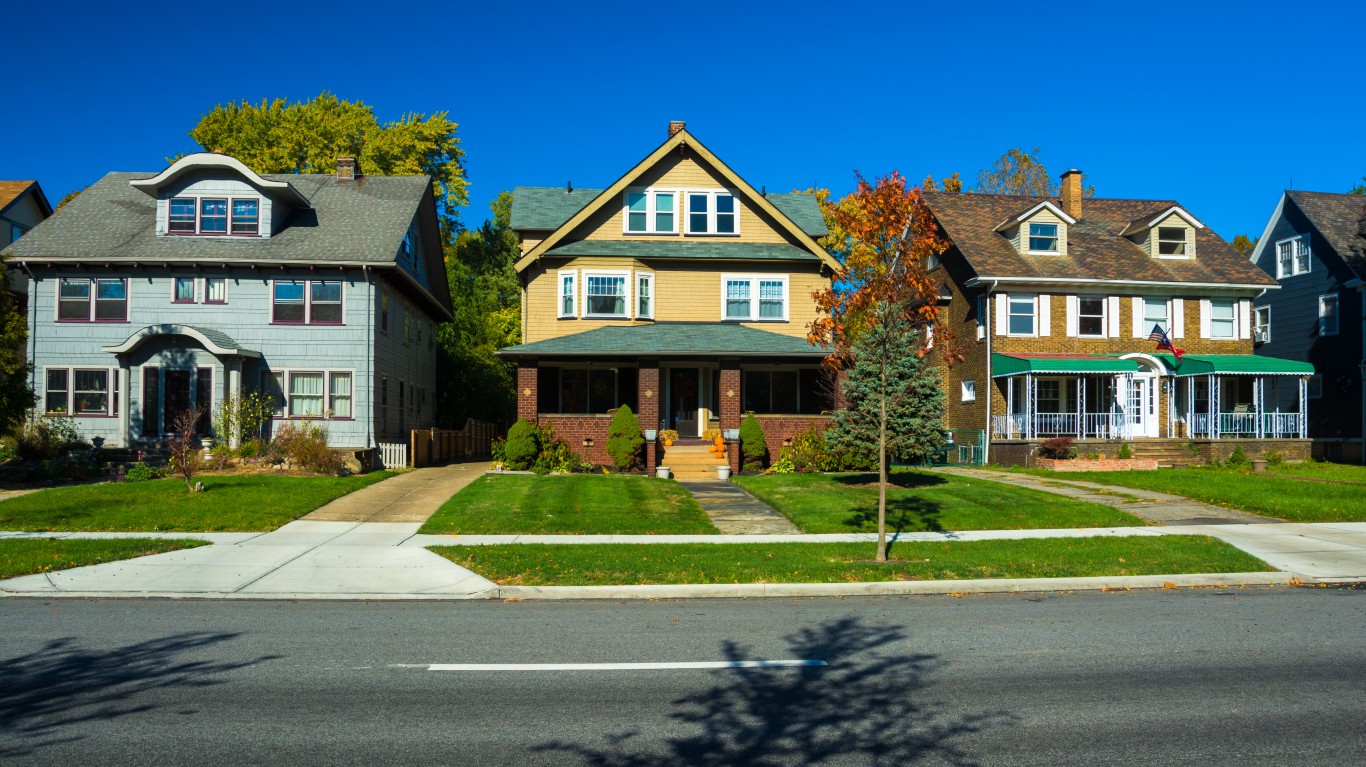
The U.S. housing market has been transformed over the past two years. Across the nation, home prices have risen by about 20% year over year, according to the S&P Case-Shiller Index. In some cities, the figure is above 25%.
Among the triggers of the new housing market was low mortgage rates (which have recently disappeared). At less than 3%, they had been near an all-time low. People have been able to move into more expensive homes because of this.
Americans also have become more mobile, largely because of the “work from home” population that was created by the COVID-19 pandemic. Tens of thousands of people have relocated from expensive coastal cities like New York and San Francisco to more affordable metros inland.
However, not everyone can afford to buy a home. Nationwide, 35.6% of housing units are rental properties.
Young people are far more likely to rent homes than buy. Well over half of all renters in the United States are under the age of 35, whereas that age group accounts for less than 10% of homeowners.
Population density is a factor in the share of housing units that are occupied by renters. In highly urban areas, a large share of residents live in multistory rental buildings rather than single-family homes. The U.S. population density is 93 people per square mile. The majority of the places we considered have more than 10,000 people per square mile.
In a number of cities where a higher share of housing units are rentals, property is very expensive and many residents are priced out of the housing market. While rent also tends to be high in these places, renting is a considerably more affordable option.
The city where the most homes are rented is University (Hillsborough County), Florida. Here are the details:
- Rental occupied housing units: 87.5%
- Median rental cost: $940 (tied for 437th lowest)
- Median home value: $91,900 (tied for 63rd lowest)
- Median household income: $29,380 (sixth lowest)
Methodology: To determine the city with the highest share of renters, 24/7 Wall St. reviewed five-year estimates of the share of housing units that are occupied by renters from the U.S. Census Bureau’s 2020 American Community Survey (ACS).
We used census “place” geographies, which is a category that includes incorporated legal entities and census-designated statistical entities. We defined cities based on a population threshold; that is, census places needed to have a population of at least 25,000 to be considered.
Cities were excluded if rental rates were not available in the 2020 ACS, if there were fewer than 1,000 housing units or if the sampling error associated with a city’s data was deemed too high.
The sampling error was defined as too high if the coefficient of variation (a statistical assessment of how reliable an estimate is) for a city’s rental rate was above 15% and greater than two standard deviations above the mean coefficient of variation for all cities’ rental rates. We similarly excluded cities that had a sampling error too high for their population, using the same definition.
Cities were ranked based on the percentage of housing units that are occupied by renters. To break ties, we used the number of housing units that are occupied by renters.
Additional information on median rental cost, median home value and median household income are also five-year estimates from the 2020 ACS.
Click here to see all the cities where the most homes are rented.
It’s Your Money, Your Future—Own It (sponsor)
Are you ahead, or behind on retirement? For families with more than $500,000 saved for retirement, finding a financial advisor who puts your interest first can be the difference, and today it’s easier than ever. SmartAsset’s free tool matches you with up to three fiduciary financial advisors who serve your area in minutes. Each advisor has been carefully vetted and must act in your best interests. Start your search now.
If you’ve saved and built a substantial nest egg for you and your family, don’t delay; get started right here and help your retirement dreams become a retirement reality.
Thank you for reading! Have some feedback for us?
Contact the 24/7 Wall St. editorial team.


