
Home prices have surged in the U.S. in recent years. Driven by rising demand and supply constraints during the pandemic, the median home sale price spiked by nearly 50% from the second quarter of 2020 to Q3 in 2022. While the sale price of a typical American home has fallen in recent months since, housing prices remain at historic highs.
Not only have home values soared, but borrowing costs for home buyers have also climbed. The average interest rate on a 30-year fixed mortgage has been above 6% since September 2022, a high not seen in nearly a decade and a half. In a market defined by high prices and high mortgage rates, homeownership has become prohibitively expensive for a large number of Americans.
Still, housing prices are also subject to a number of factors that can be isolated from broader, nationwide market trends — and location is one of them. Two homes that are virtually identical can vary in price by hundreds of thousands of dollars, depending on where they are. And for prospective homeowners on a budget, some Kentucky cities are far more affordable than others.
According to five-year estimates from the U.S. Census Bureau’s 2022 American Community Survey, the typical home in Kentucky is worth $177,000. But across the 16 cities, towns and unincorporated communities in the state with populations of at least 25,000, median home values range from $130,500 to nearly $250,000.
In any local market, home prices are often a reflection of what residents can afford. In Kentucky, many of the least expensive cities for homebuyers are not high-income areas. Of the 16 Kentucky cities with available data from the ACS, six have a median home value that is less than the statewide median. In each of these places, the typical household earns less than the statewide median household income of $60,183. Similarly, most of Kentucky’s more expensive housing markets have higher earning populations.
Why It Matters

Homeownership is one of the most practical ways to build wealth in the United States, and rising borrowing costs and home values are pricing out a growing share of the population. The state of the U.S. housing market also has broader economic implications. According to the Congressional Research Service, spending associated with homeownership totaled $1.1 trillion in 2021, or nearly 5% of U.S. gross domestic product.
These are the cheapest and most expensive housing markets in Kentucky.
16. Hopkinsville
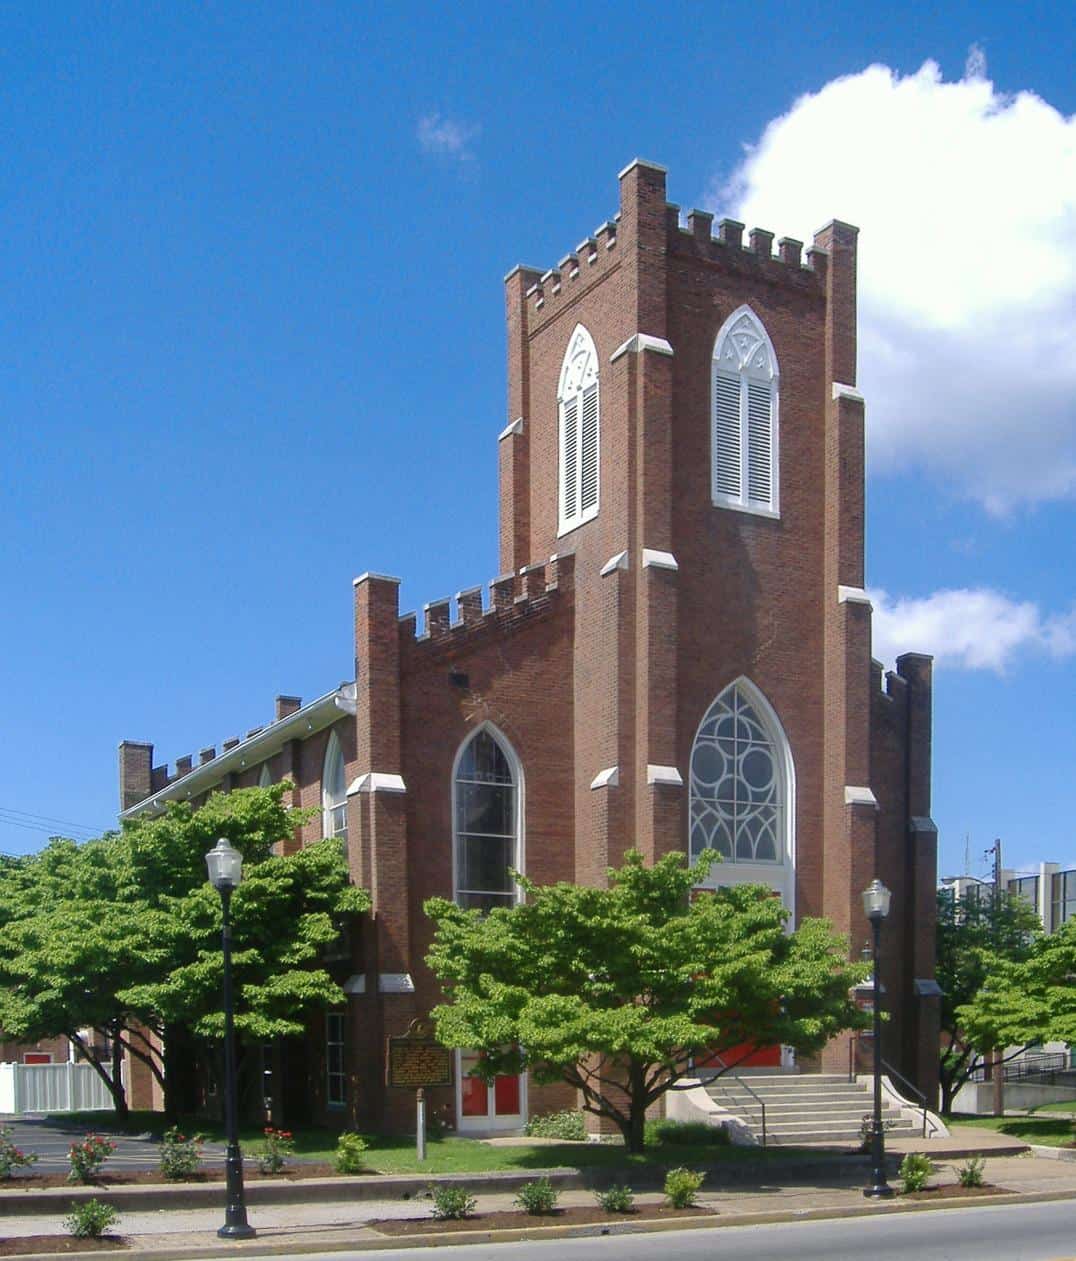
- Median home value: $130,500
- Homes worth over $1 million: 0.0%
- Homeownership rate: 46.4%
- Median household income: $43,577
- Total population: 31,042
15. Henderson

- Median home value: $144,200
- Homes worth over $1 million: 0.0%
- Homeownership rate: 53.4%
- Median household income: $46,276
- Total population: 28,166
14. Owensboro
- Median home value: $151,800
- Homes worth over $1 million: 0.2%
- Homeownership rate: 57.1%
- Median household income: $51,982
- Total population: 60,019
13. Paducah
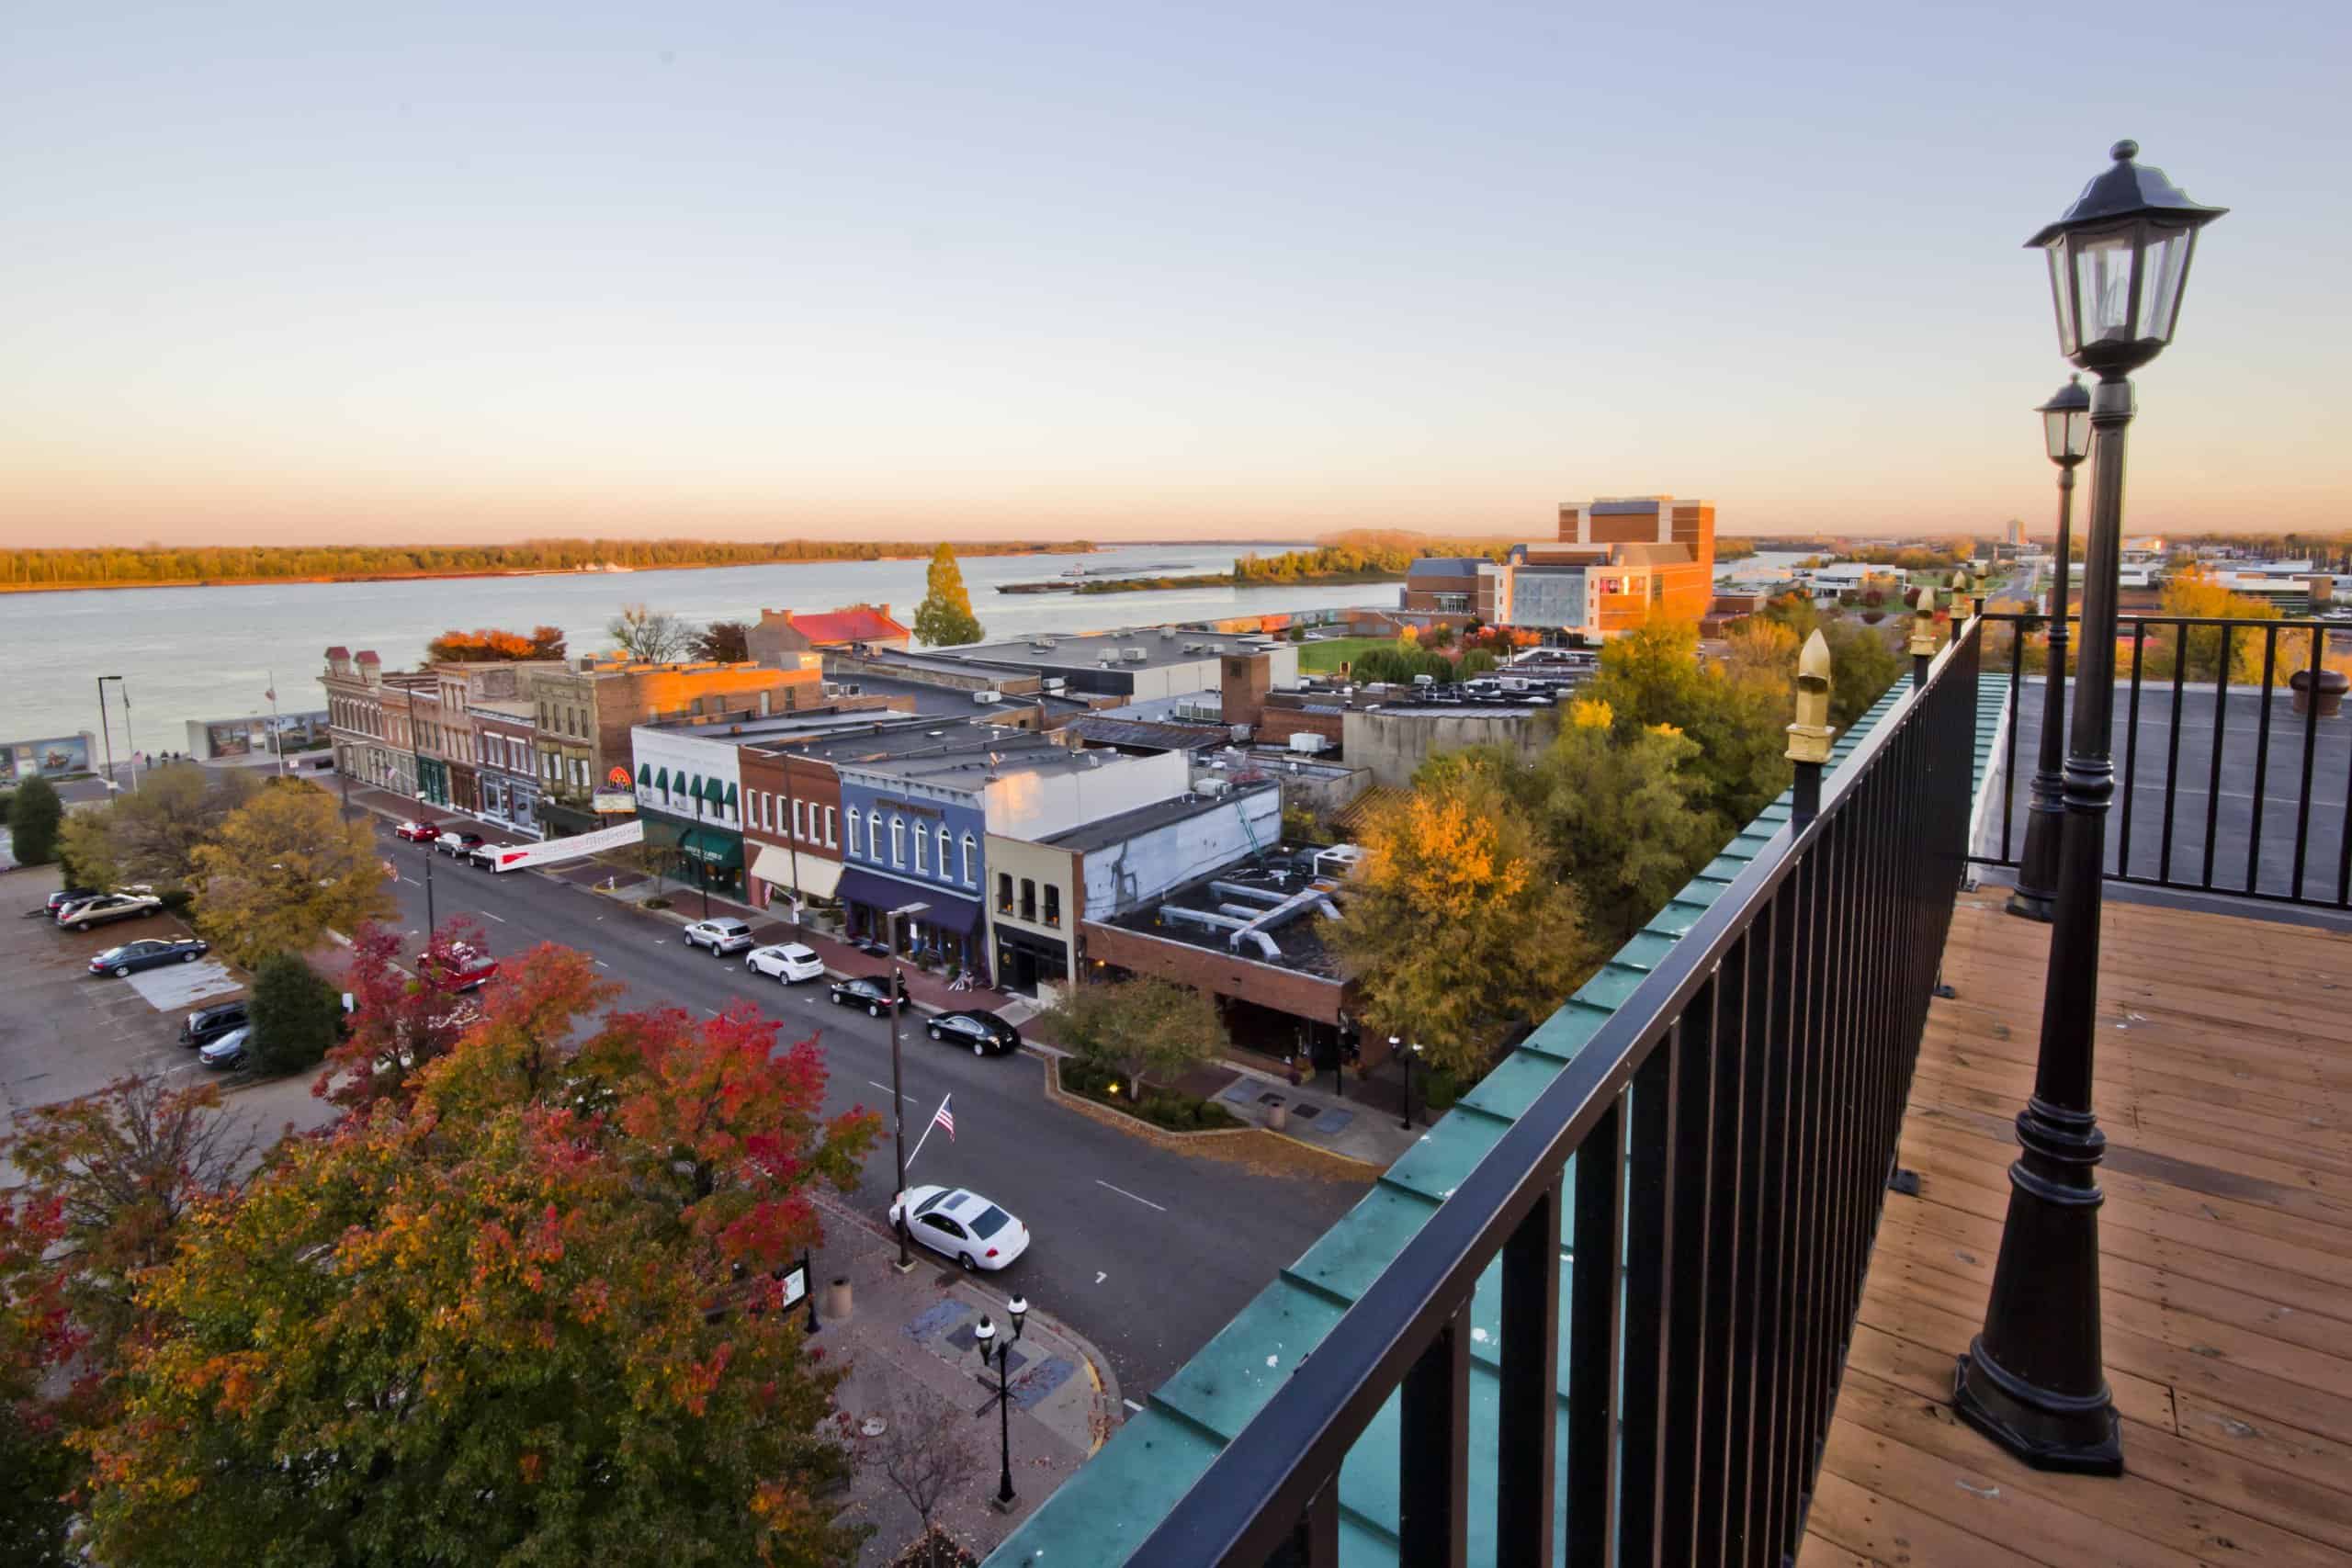
- Median home value: $152,600
- Homes worth over $1 million: 1.0%
- Homeownership rate: 53.7%
- Median household income: $46,984
- Total population: 26,869
12. Covington

- Median home value: $153,600
- Homes worth over $1 million: 0.9%
- Homeownership rate: 51.4%
- Median household income: $53,770
- Total population: 40,923
11. Frankfort

- Median home value: $157,300
- Homes worth over $1 million: 0.2%
- Homeownership rate: 48.0%
- Median household income: $53,905
- Total population: 28,460
10. Richmond

- Median home value: $178,100
- Homes worth over $1 million: 0.4%
- Homeownership rate: 38.4%
- Median household income: $45,457
- Total population: 34,883
9. Florence
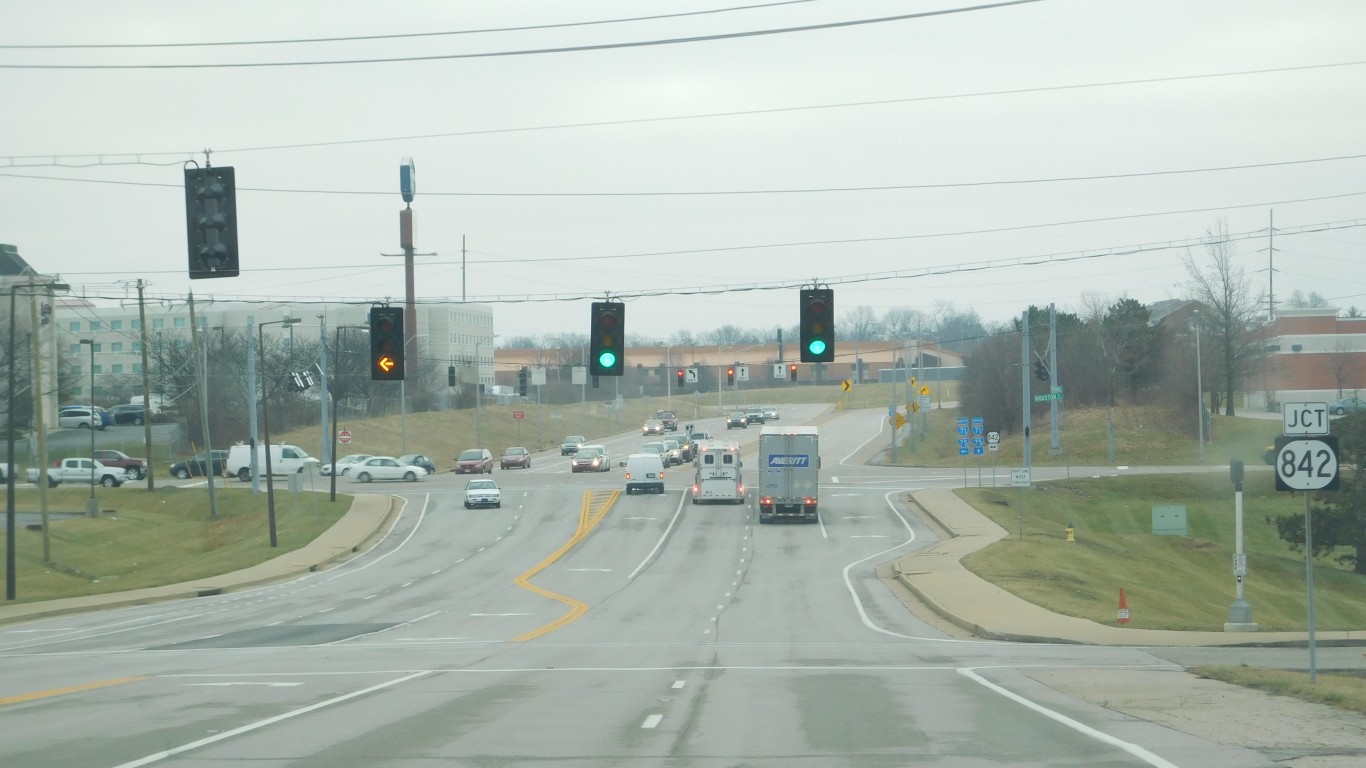
- Median home value: $181,500
- Homes worth over $1 million: 0.2%
- Homeownership rate: 56.6%
- Median household income: $67,352
- Total population: 32,056
8. Nicholasville
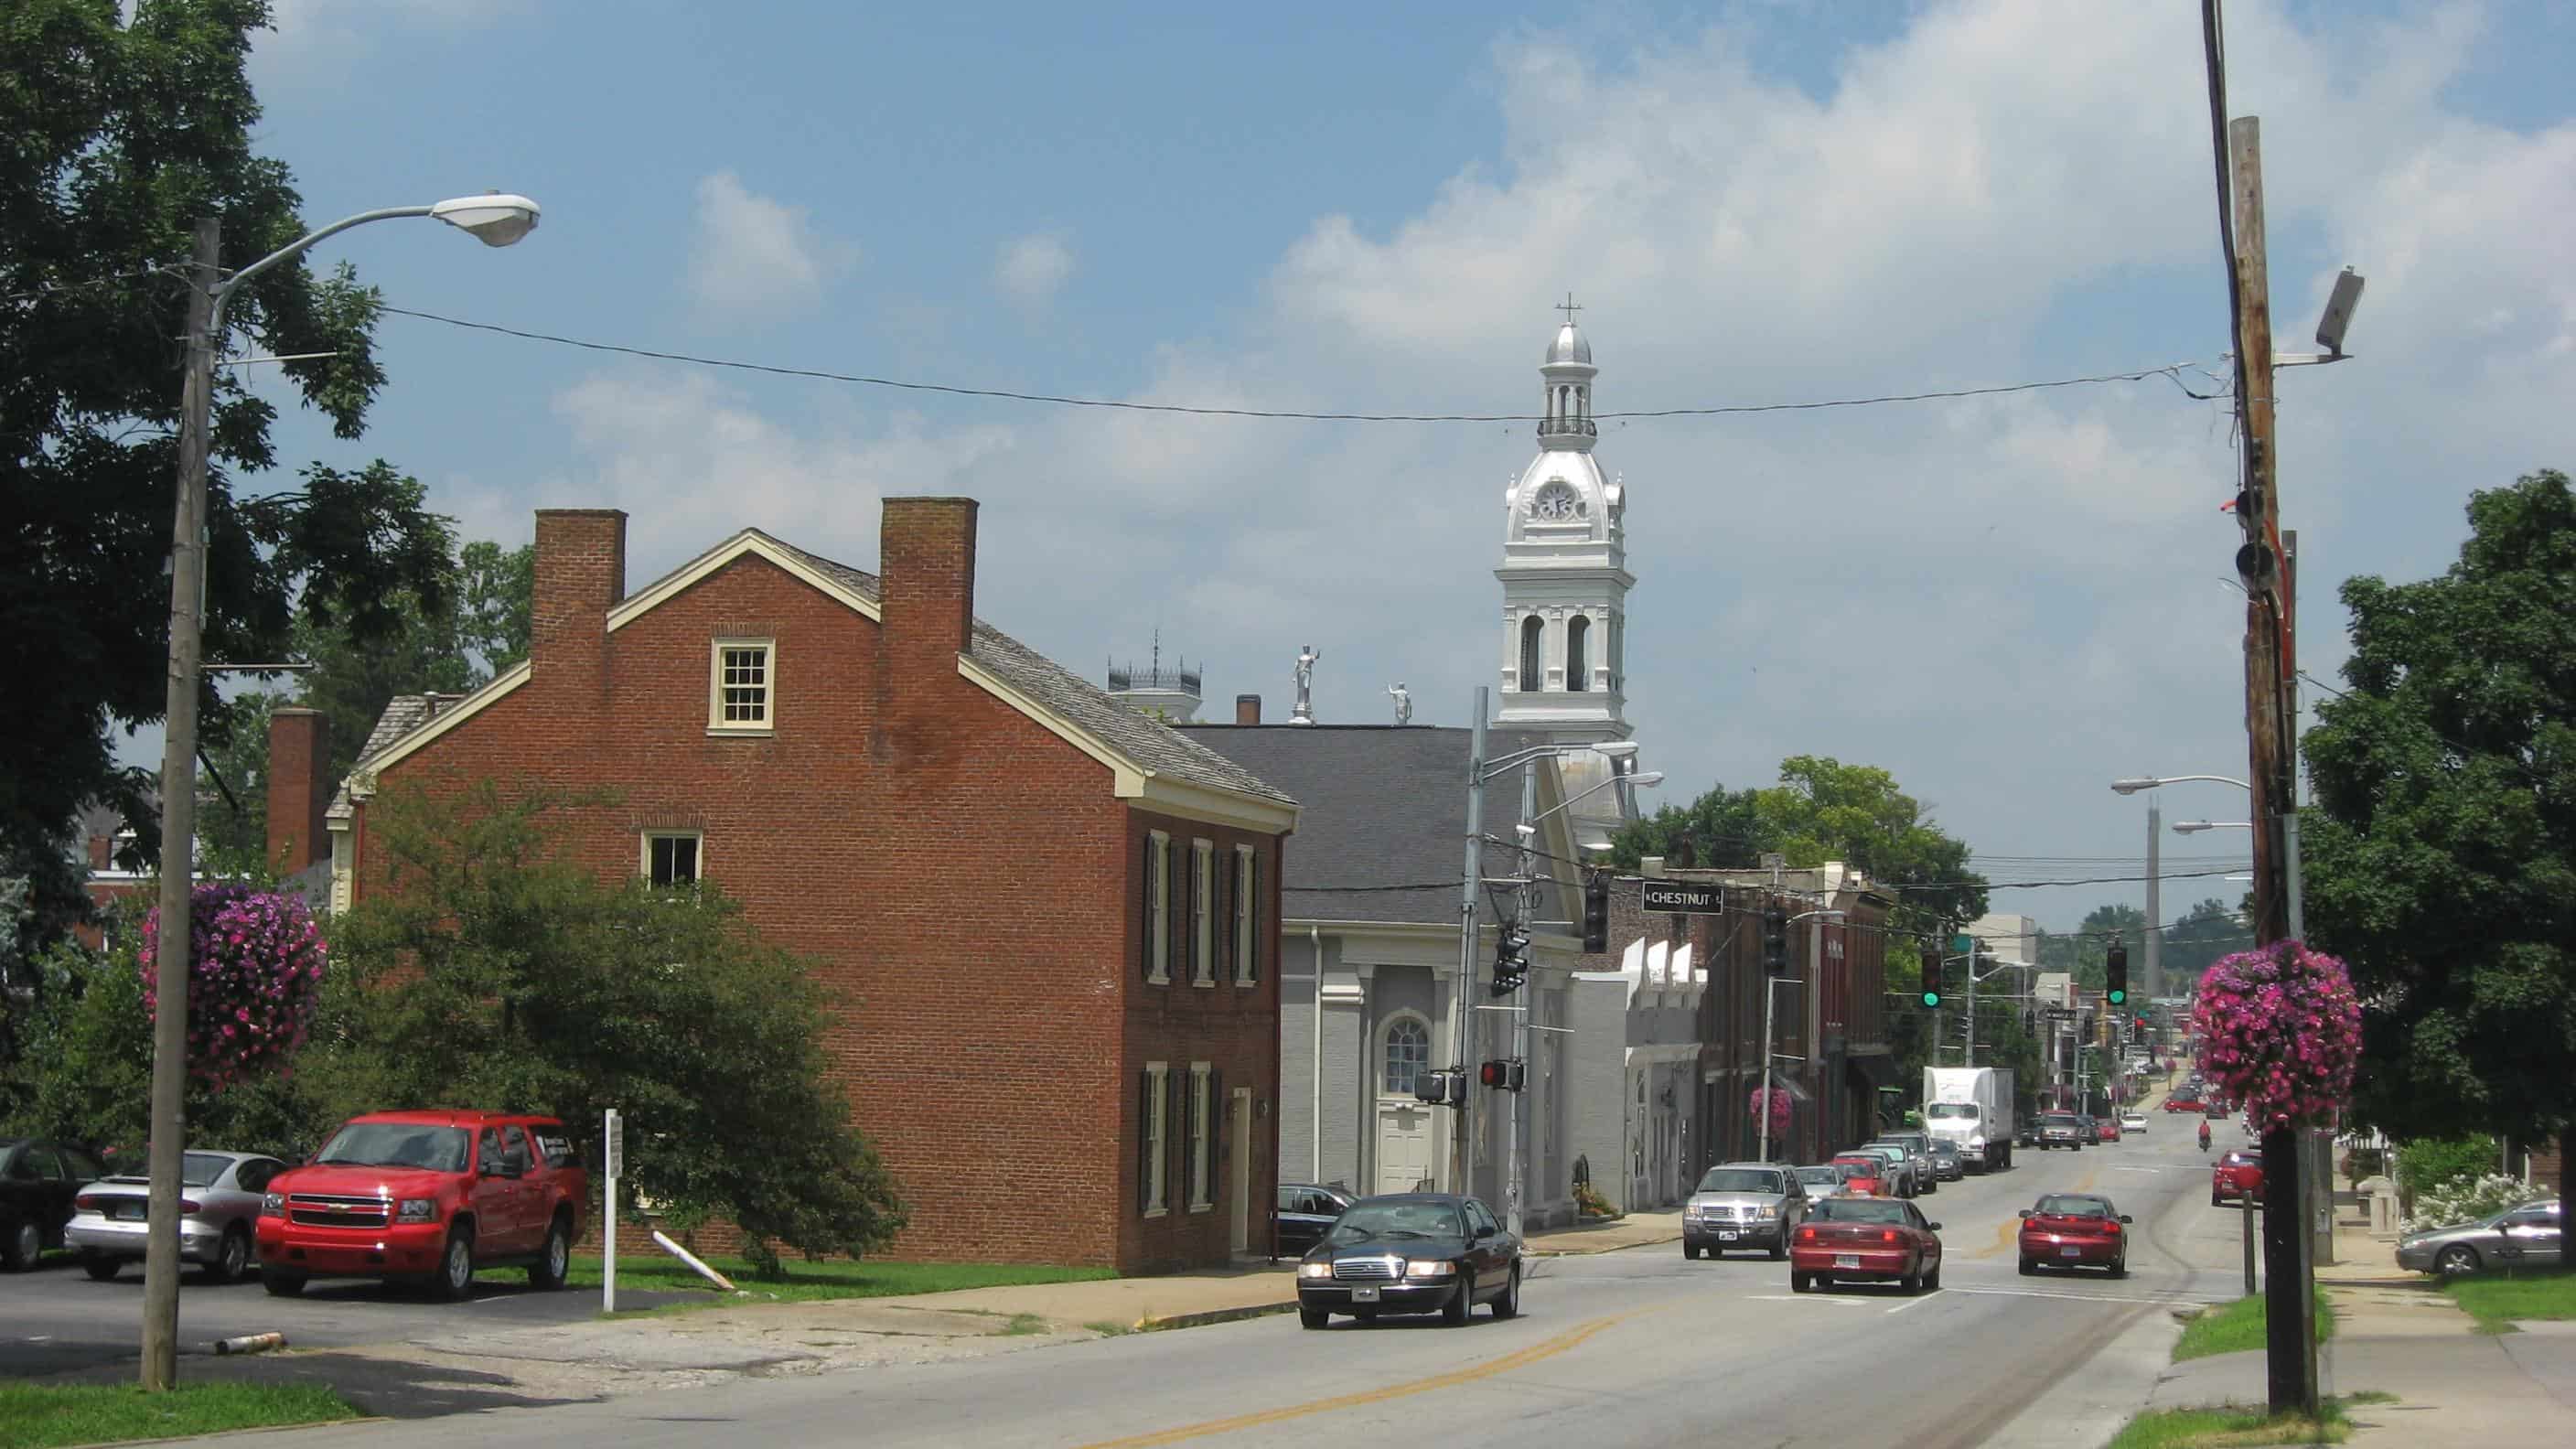
- Median home value: $189,500
- Homes worth over $1 million: 0.0%
- Homeownership rate: 61.9%
- Median household income: $61,832
- Total population: 31,352
7. Louisville/Jefferson County

- Median home value: $204,800
- Homes worth over $1 million: 1.3%
- Homeownership rate: 60.4%
- Median household income: $63,114
- Total population: 629,176
6. Elizabethtown
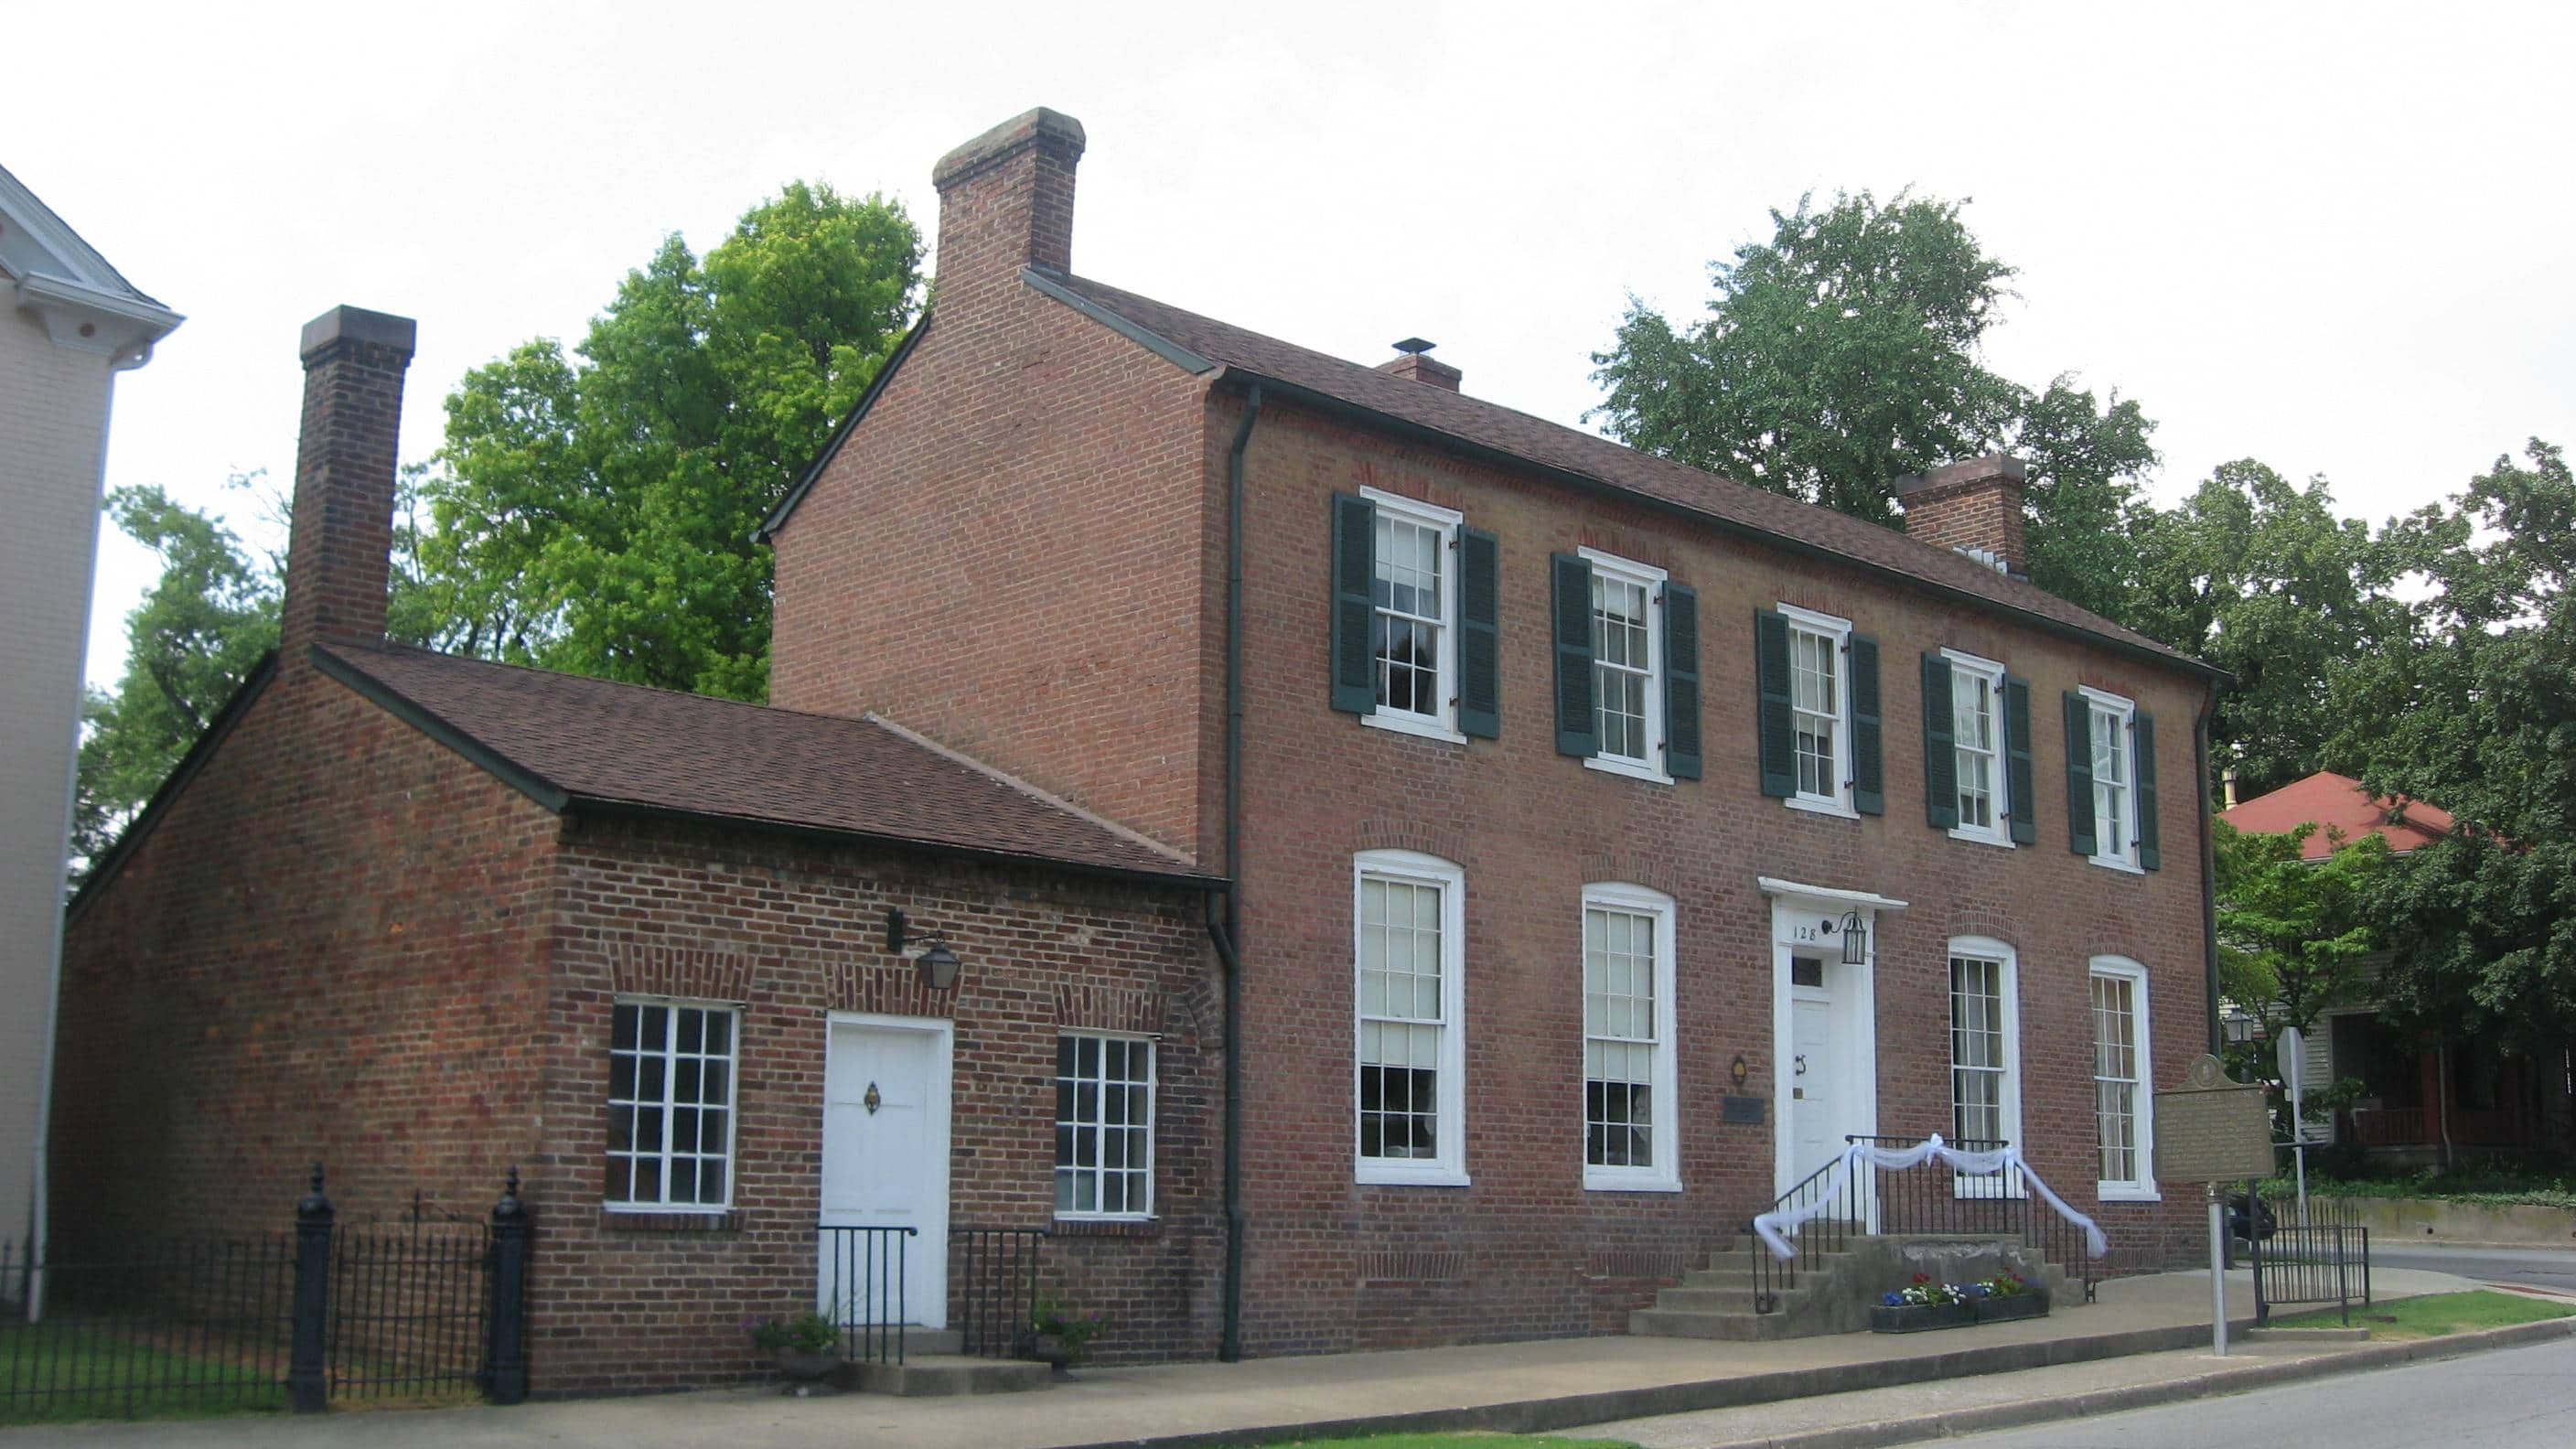
- Median home value: $207,800
- Homes worth over $1 million: 0.2%
- Homeownership rate: 48.3%
- Median household income: $54,493
- Total population: 31,425
5. Bowling Green
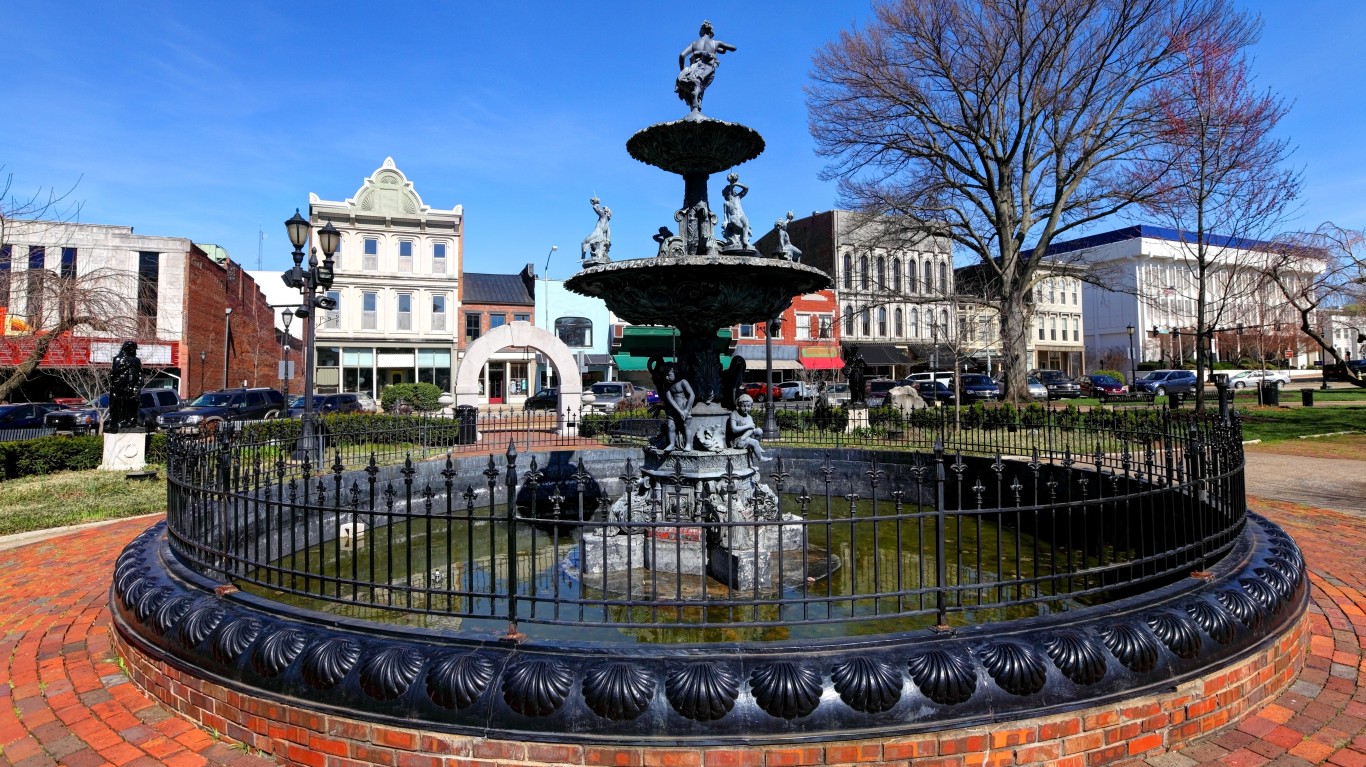
- Median home value: $215,300
- Homes worth over $1 million: 1.2%
- Homeownership rate: 37.9%
- Median household income: $47,118
- Total population: 72,385
4. Georgetown

- Median home value: $223,700
- Homes worth over $1 million: 0.4%
- Homeownership rate: 65.4%
- Median household income: $74,530
- Total population: 37,510
3. Independence
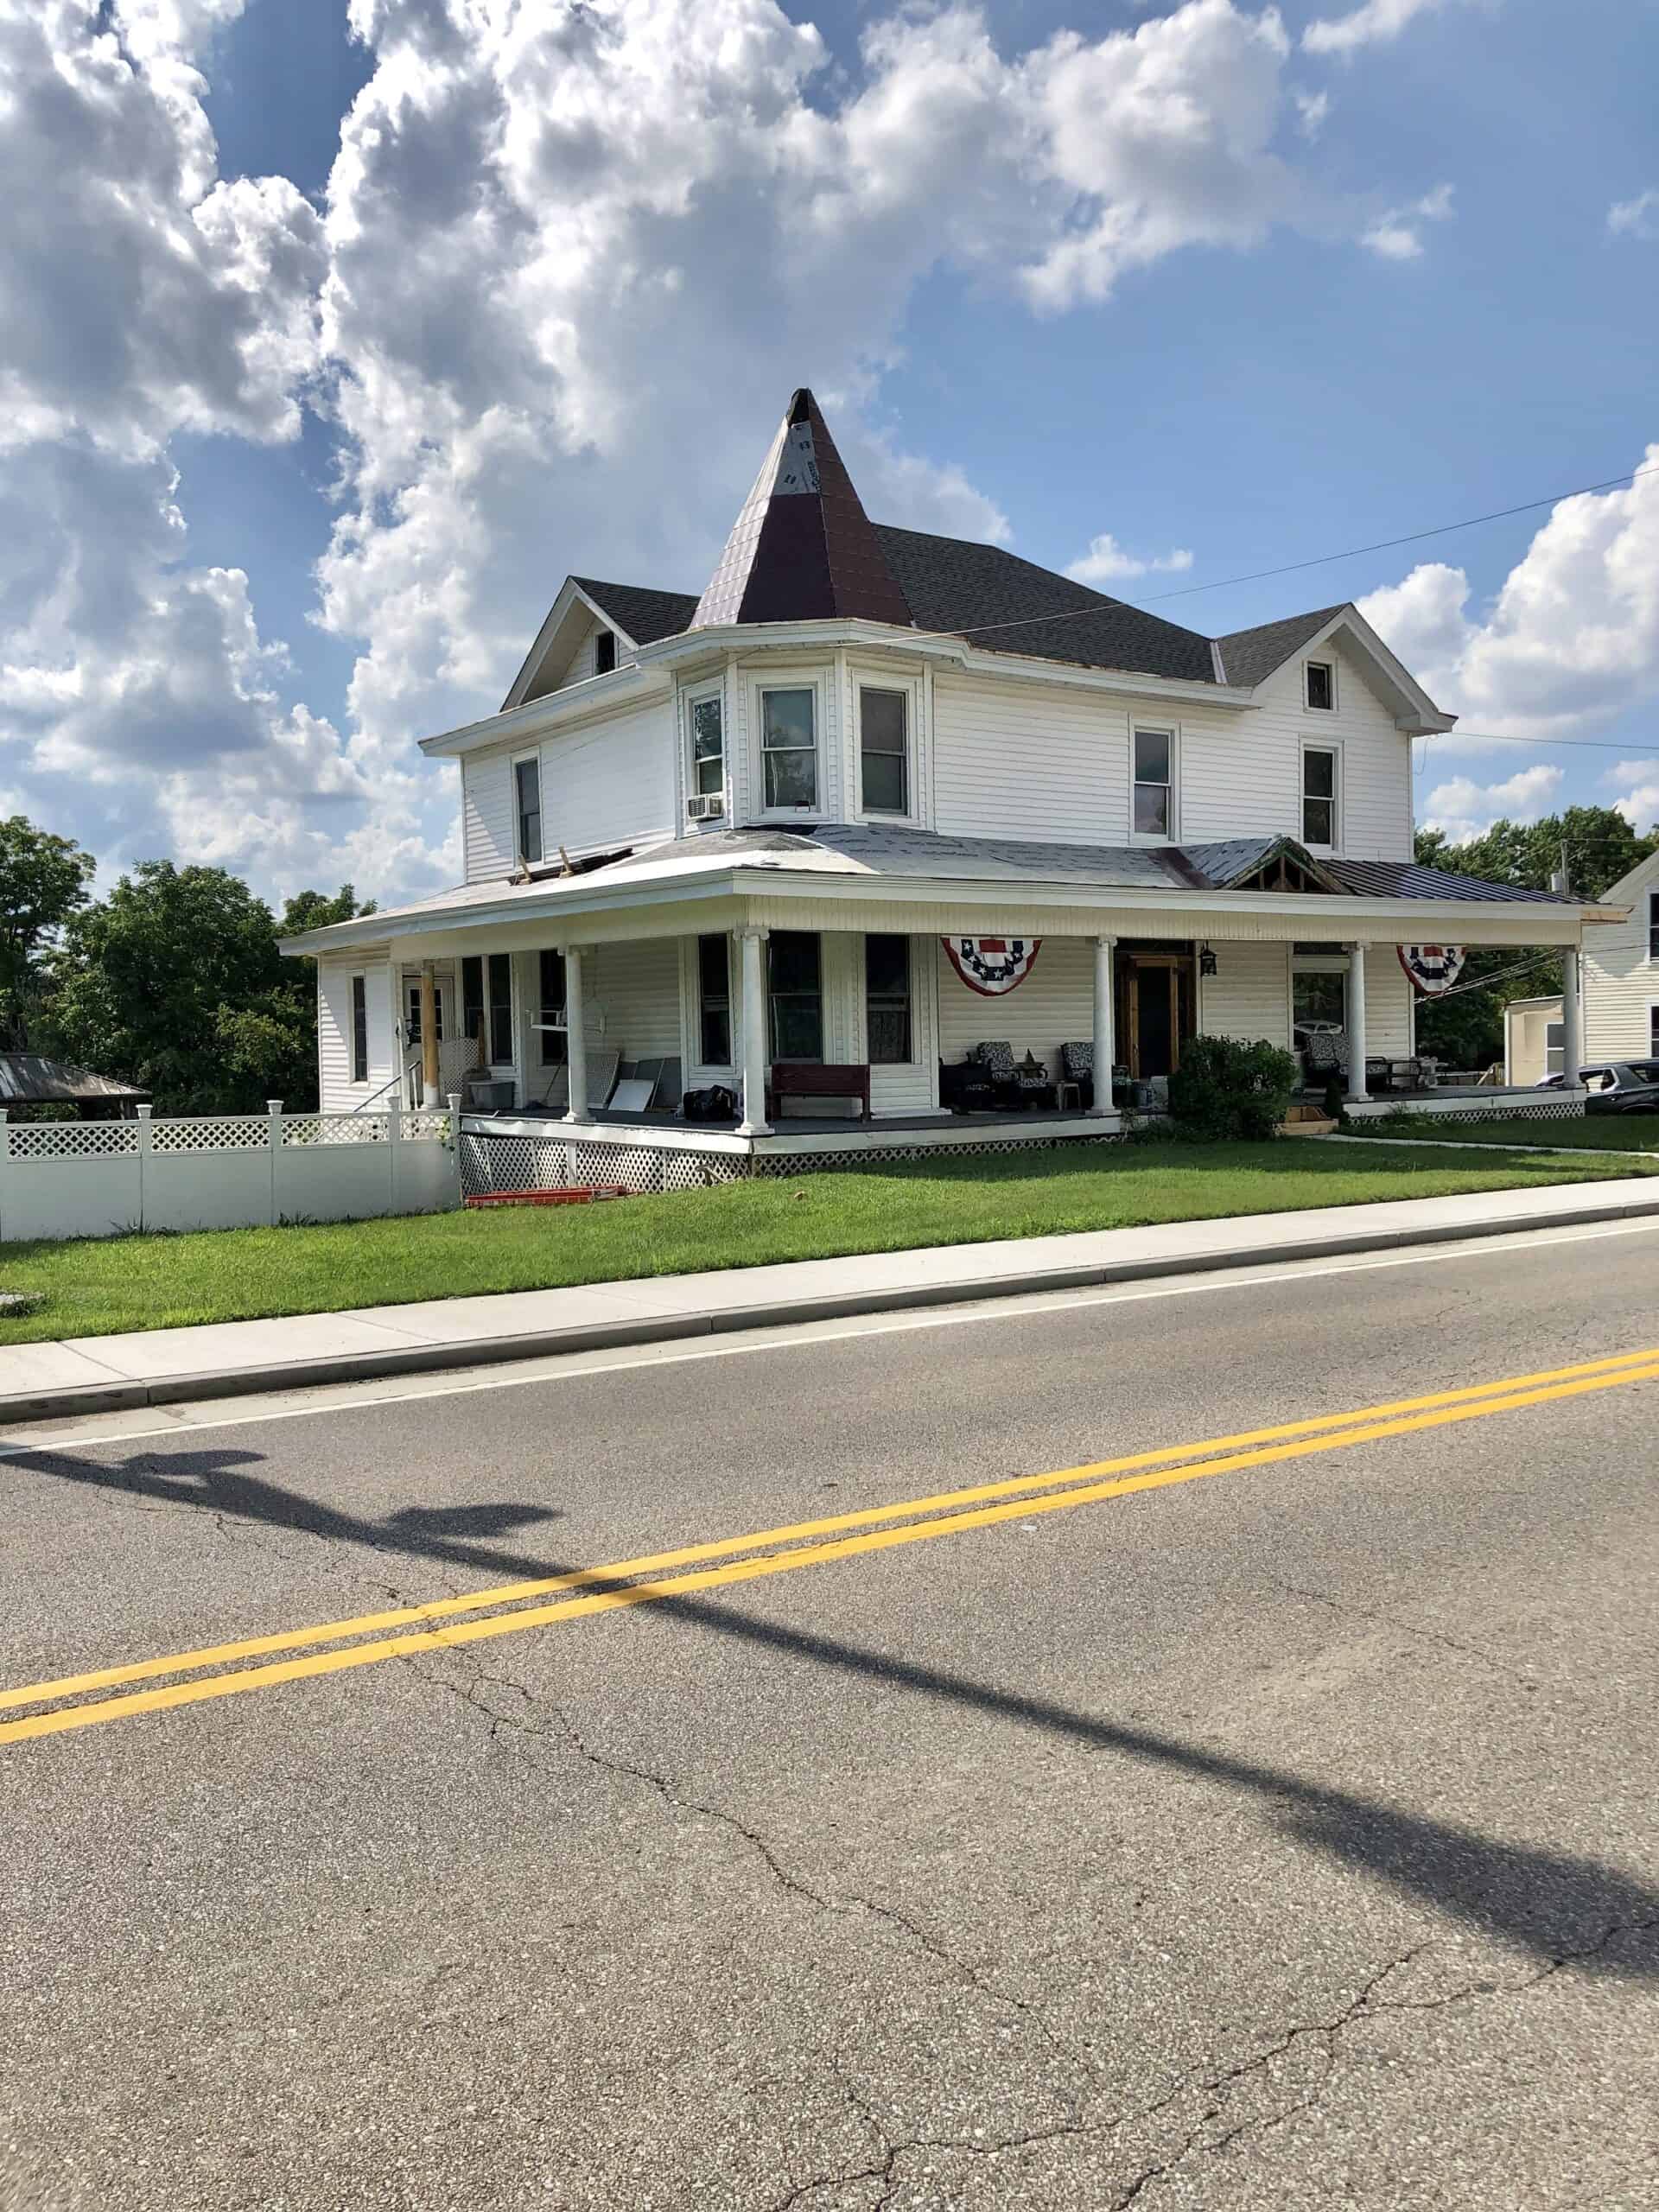
- Median home value: $225,500 (tied)
- Homes worth over $1 million: 0.9%
- Homeownership rate: 81.0%
- Median household income: $92,355
- Total population: 28,722
2. Jeffersontown
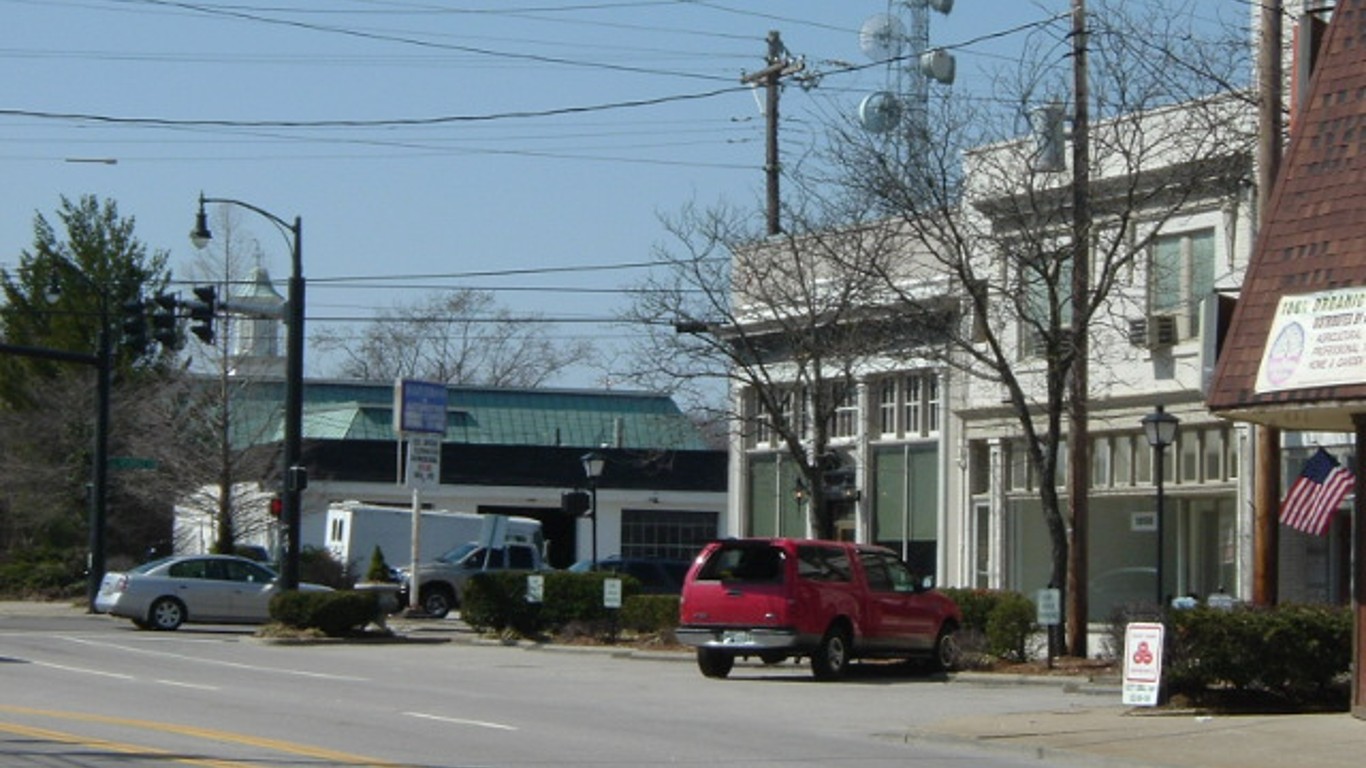
- Median home value: $225,500 (tied)
- Homes worth over $1 million: 0.3%
- Homeownership rate: 67.5%
- Median household income: $78,929
- Total population: 28,796
1. Lexington-Fayette

- Median home value: $247,900
- Homes worth over $1 million: 1.9%
- Homeownership rate: 54.3%
- Median household income: $66,087
- Total population: 321,276
| Rank | Places in Kentucky with at least 25,000 residents | Median home value ($) | Homeownership rate (%) | Median household income ($) | Total Population |
|---|---|---|---|---|---|
| 1 | Lexington-Fayette | 247,900 | 54.3 | 66,087 | 321,276 |
| 2 | Independence | 225,500 | 81.0 | 92,355 | 28,722 |
| 3 | Jeffersontown | 225,500 | 67.5 | 78,929 | 28,796 |
| 4 | Georgetown | 223,700 | 65.4 | 74,530 | 37,510 |
| 5 | Bowling Green | 215,300 | 37.9 | 47,118 | 72,385 |
| 6 | Elizabethtown | 207,800 | 48.3 | 54,493 | 31,425 |
| 7 | Louisville/Jefferson County | 204,800 | 60.4 | 63,114 | 629,176 |
| 8 | Nicholasville | 189,500 | 61.9 | 61,832 | 31,352 |
| 9 | Florence | 181,500 | 56.6 | 67,352 | 32,056 |
| 10 | Richmond | 178,100 | 38.4 | 45,457 | 34,883 |
| 11 | Frankfort | 157,300 | 48.0 | 53,905 | 28,460 |
| 12 | Covington | 153,600 | 51.4 | 53,770 | 40,923 |
| 13 | Paducah | 152,600 | 53.7 | 46,984 | 26,869 |
| 14 | Owensboro | 151,800 | 57.1 | 51,982 | 60,019 |
| 15 | Henderson | 144,200 | 53.4 | 46,276 | 28,166 |
| 16 | Hopkinsville | 130,500 | 46.4 | 43,577 | 31,042 |
Are You Ahead, or Behind on Retirement? (sponsor)
If you’re one of the over 4 Million Americans set to retire this year, you may want to pay attention.
Finding a financial advisor who puts your interest first can be the difference between a rich retirement and barely getting by, and today it’s easier than ever. SmartAsset’s free tool matches you with up to three fiduciary financial advisors that serve your area in minutes. Each advisor has been carefully vetted, and must act in your best interests. Start your search now.
Don’t waste another minute; get started right here and help your retirement dreams become a retirement reality.
Thank you for reading! Have some feedback for us?
Contact the 24/7 Wall St. editorial team.
