Home prices have surged in the U.S. in recent years. Driven by rising demand and supply constraints during the pandemic, the median home sale price spiked by nearly 50% from the second quarter of 2020 to Q3 in 2022. While the sale price of a typical American home has fallen in recent months since, housing prices remain at historic highs.
Not only have home values soared, but borrowing costs for home buyers have also climbed. The average interest rate on a 30-year fixed mortgage has been above 6% since September 2022, a high not seen in nearly a decade and a half. In a market defined by high prices and high mortgage rates, homeownership has become prohibitively expensive for a large number of Americans.
Still, housing prices are also subject to a number of factors that can be isolated from broader, nationwide market trends — and location is one of them. Two homes that are virtually identical can vary in price by hundreds of thousands of dollars, depending on where they are. And for prospective homeowners on a budget, some Minnesota cities are far more affordable than others.
According to five-year estimates from the U.S. Census Bureau’s 2022 American Community Survey, the typical home in Minnesota is worth $286,800. But across the 43 cities, towns and unincorporated communities in the state with populations of at least 25,000, median home values range from less than $140,000 to over $600,000.
In any local market, home prices are often a reflection of what residents can afford. In Minnesota, many of the least expensive cities for homebuyers are not high-income areas. Of the 43 places in Minnesota with available data from the ACS, 13 have a median home value that is less than the statewide median. In all but two of these places, the typical household earns less than the statewide median household income of $84,313. Similarly, most of Minnesota’s more expensive housing markets have higher earning populations.
Why It Matters
Homeownership is one of the most practical ways to build wealth in the United States, and rising borrowing costs and home values are pricing out a growing share of the population. The state of the U.S. housing market also has broader economic implications. According to the Congressional Research Service, spending associated with homeownership totaled $1.1 trillion in 2021, or nearly 5% of U.S. gross domestic product.
These are the cheapest and most expensive housing markets in Minnesota.
43. Austin
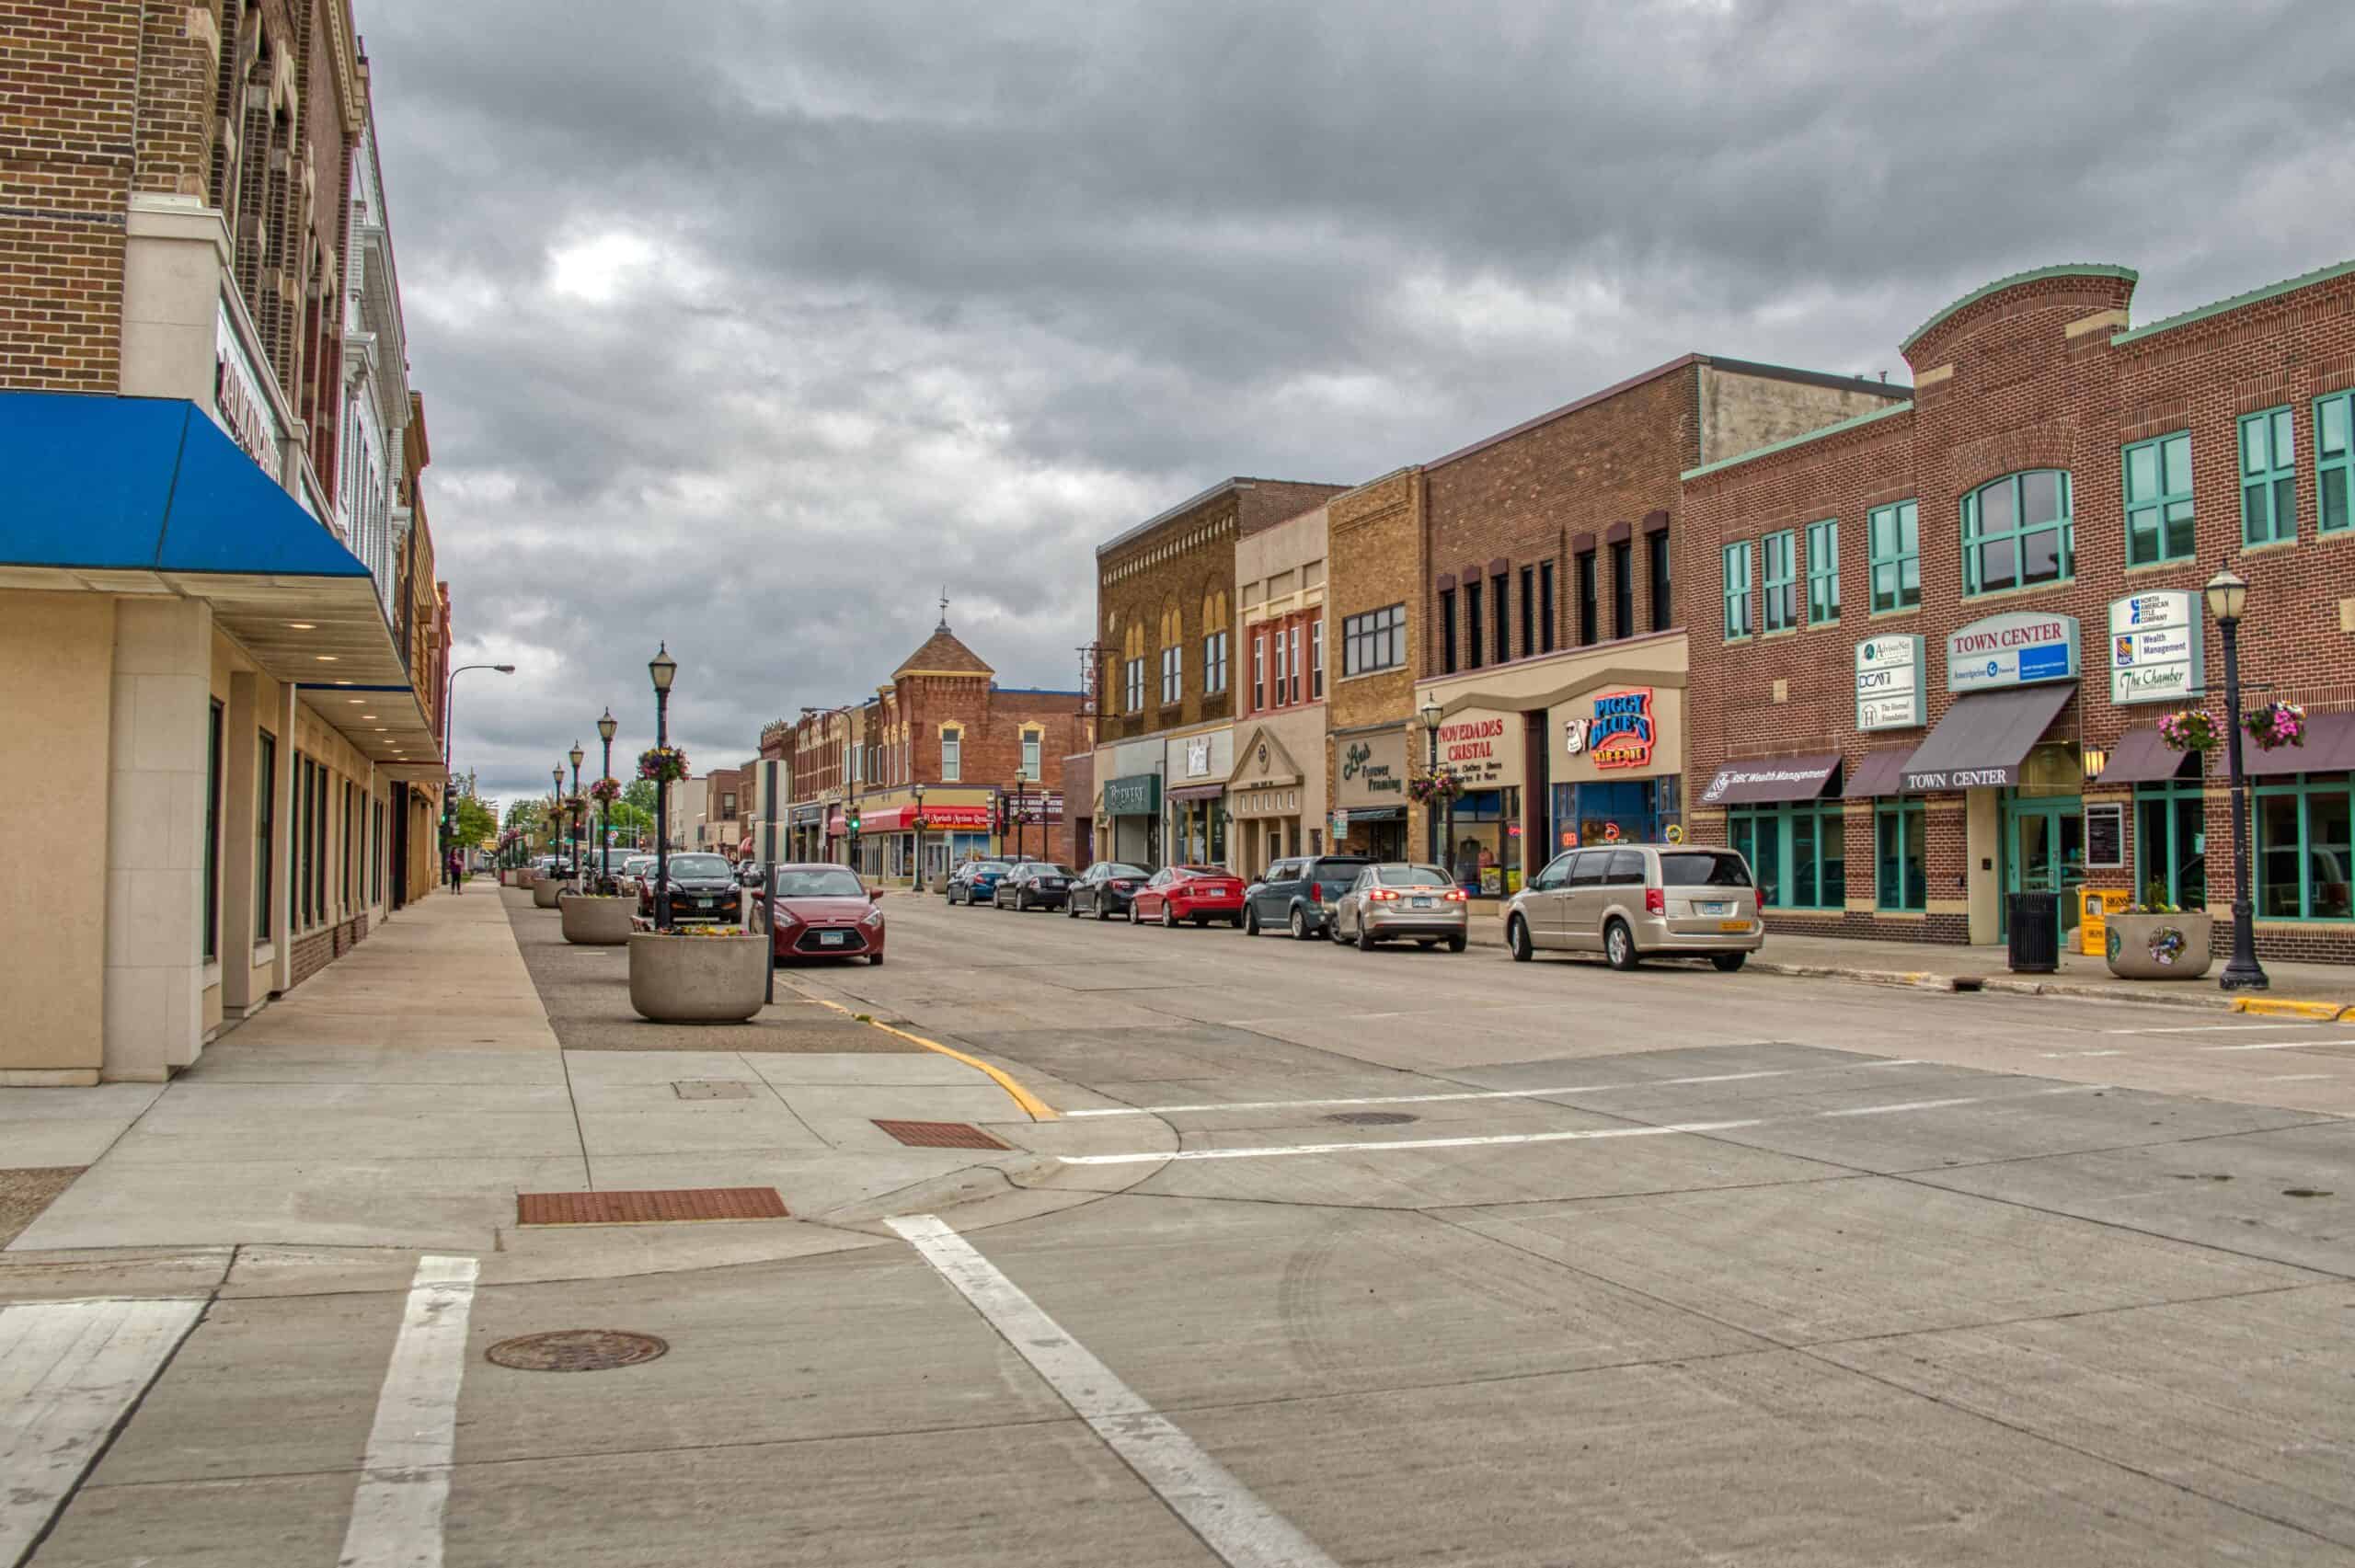
- Median home value: $139,100
- Homes worth over $1 million: 0.4%
- Homeownership rate: 68.3%
- Median household income: $61,667
- Total population: 26,156
42. Winona

- Median home value: $176,600
- Homes worth over $1 million: 0.7%
- Homeownership rate: 57.8%
- Median household income: $52,500
- Total population: 26,083
41. St. Cloud
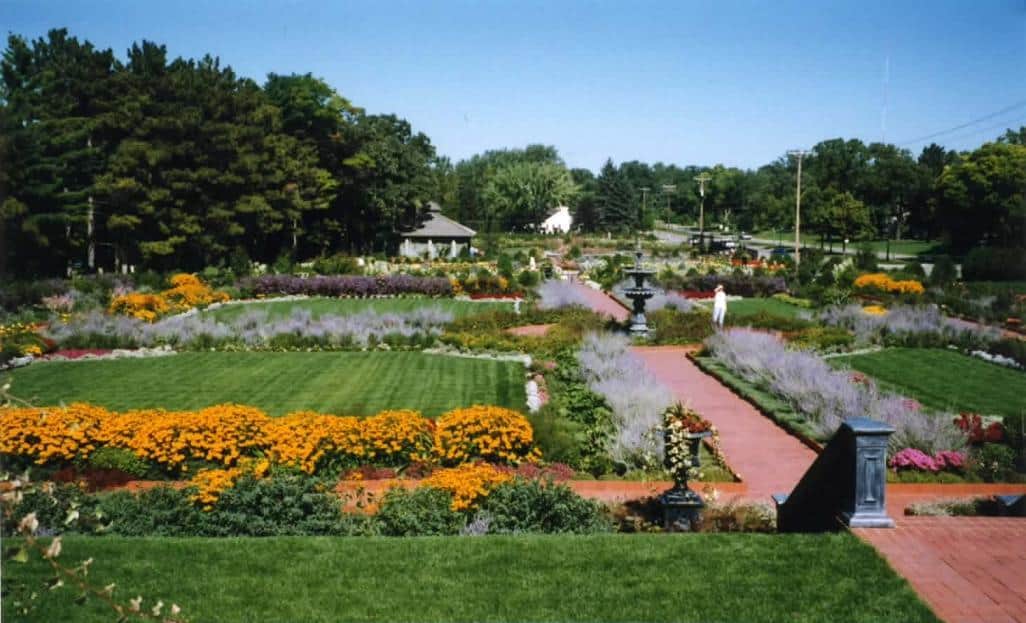
- Median home value: $189,600
- Homes worth over $1 million: 0.6%
- Homeownership rate: 48.2%
- Median household income: $58,910
- Total population: 68,910
40. Duluth
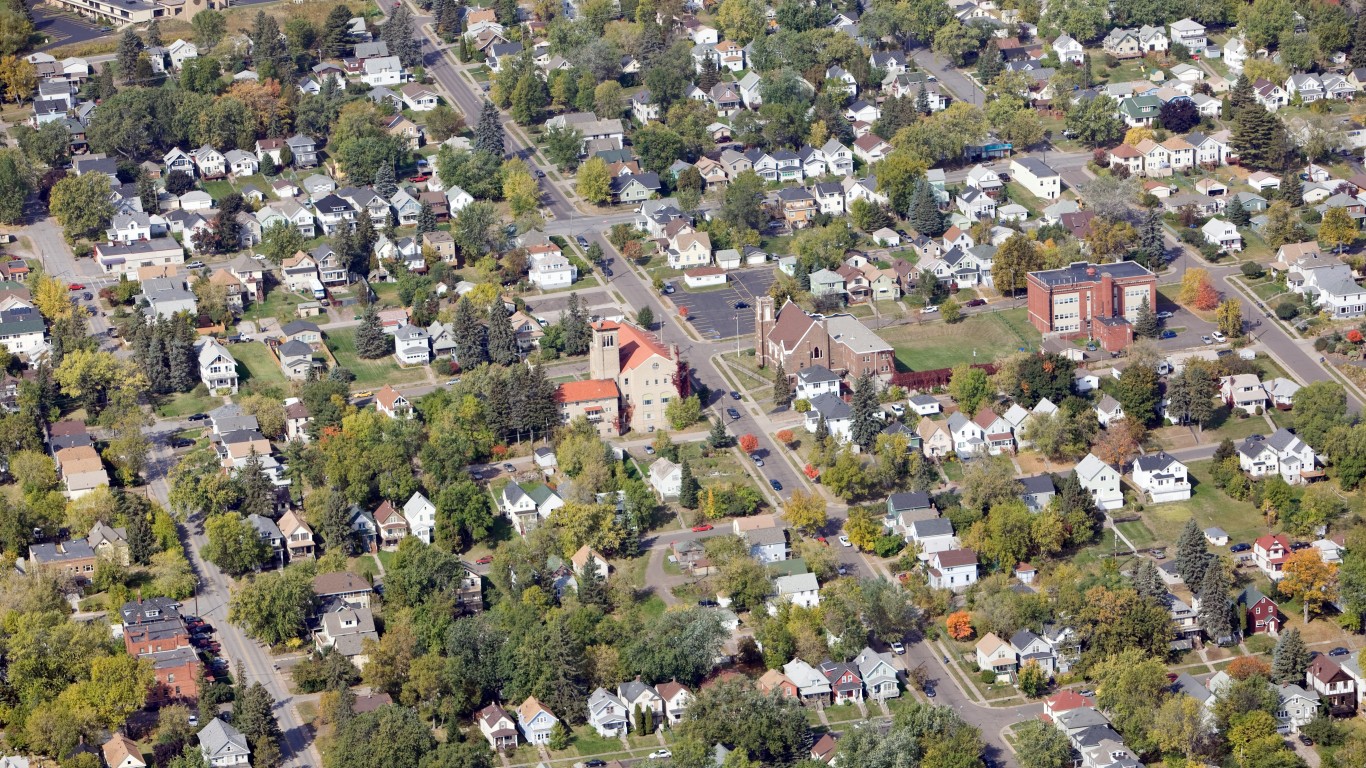
- Median home value: $209,800
- Homes worth over $1 million: 0.9%
- Homeownership rate: 60.6%
- Median household income: $63,545
- Total population: 86,772
39. Owatonna
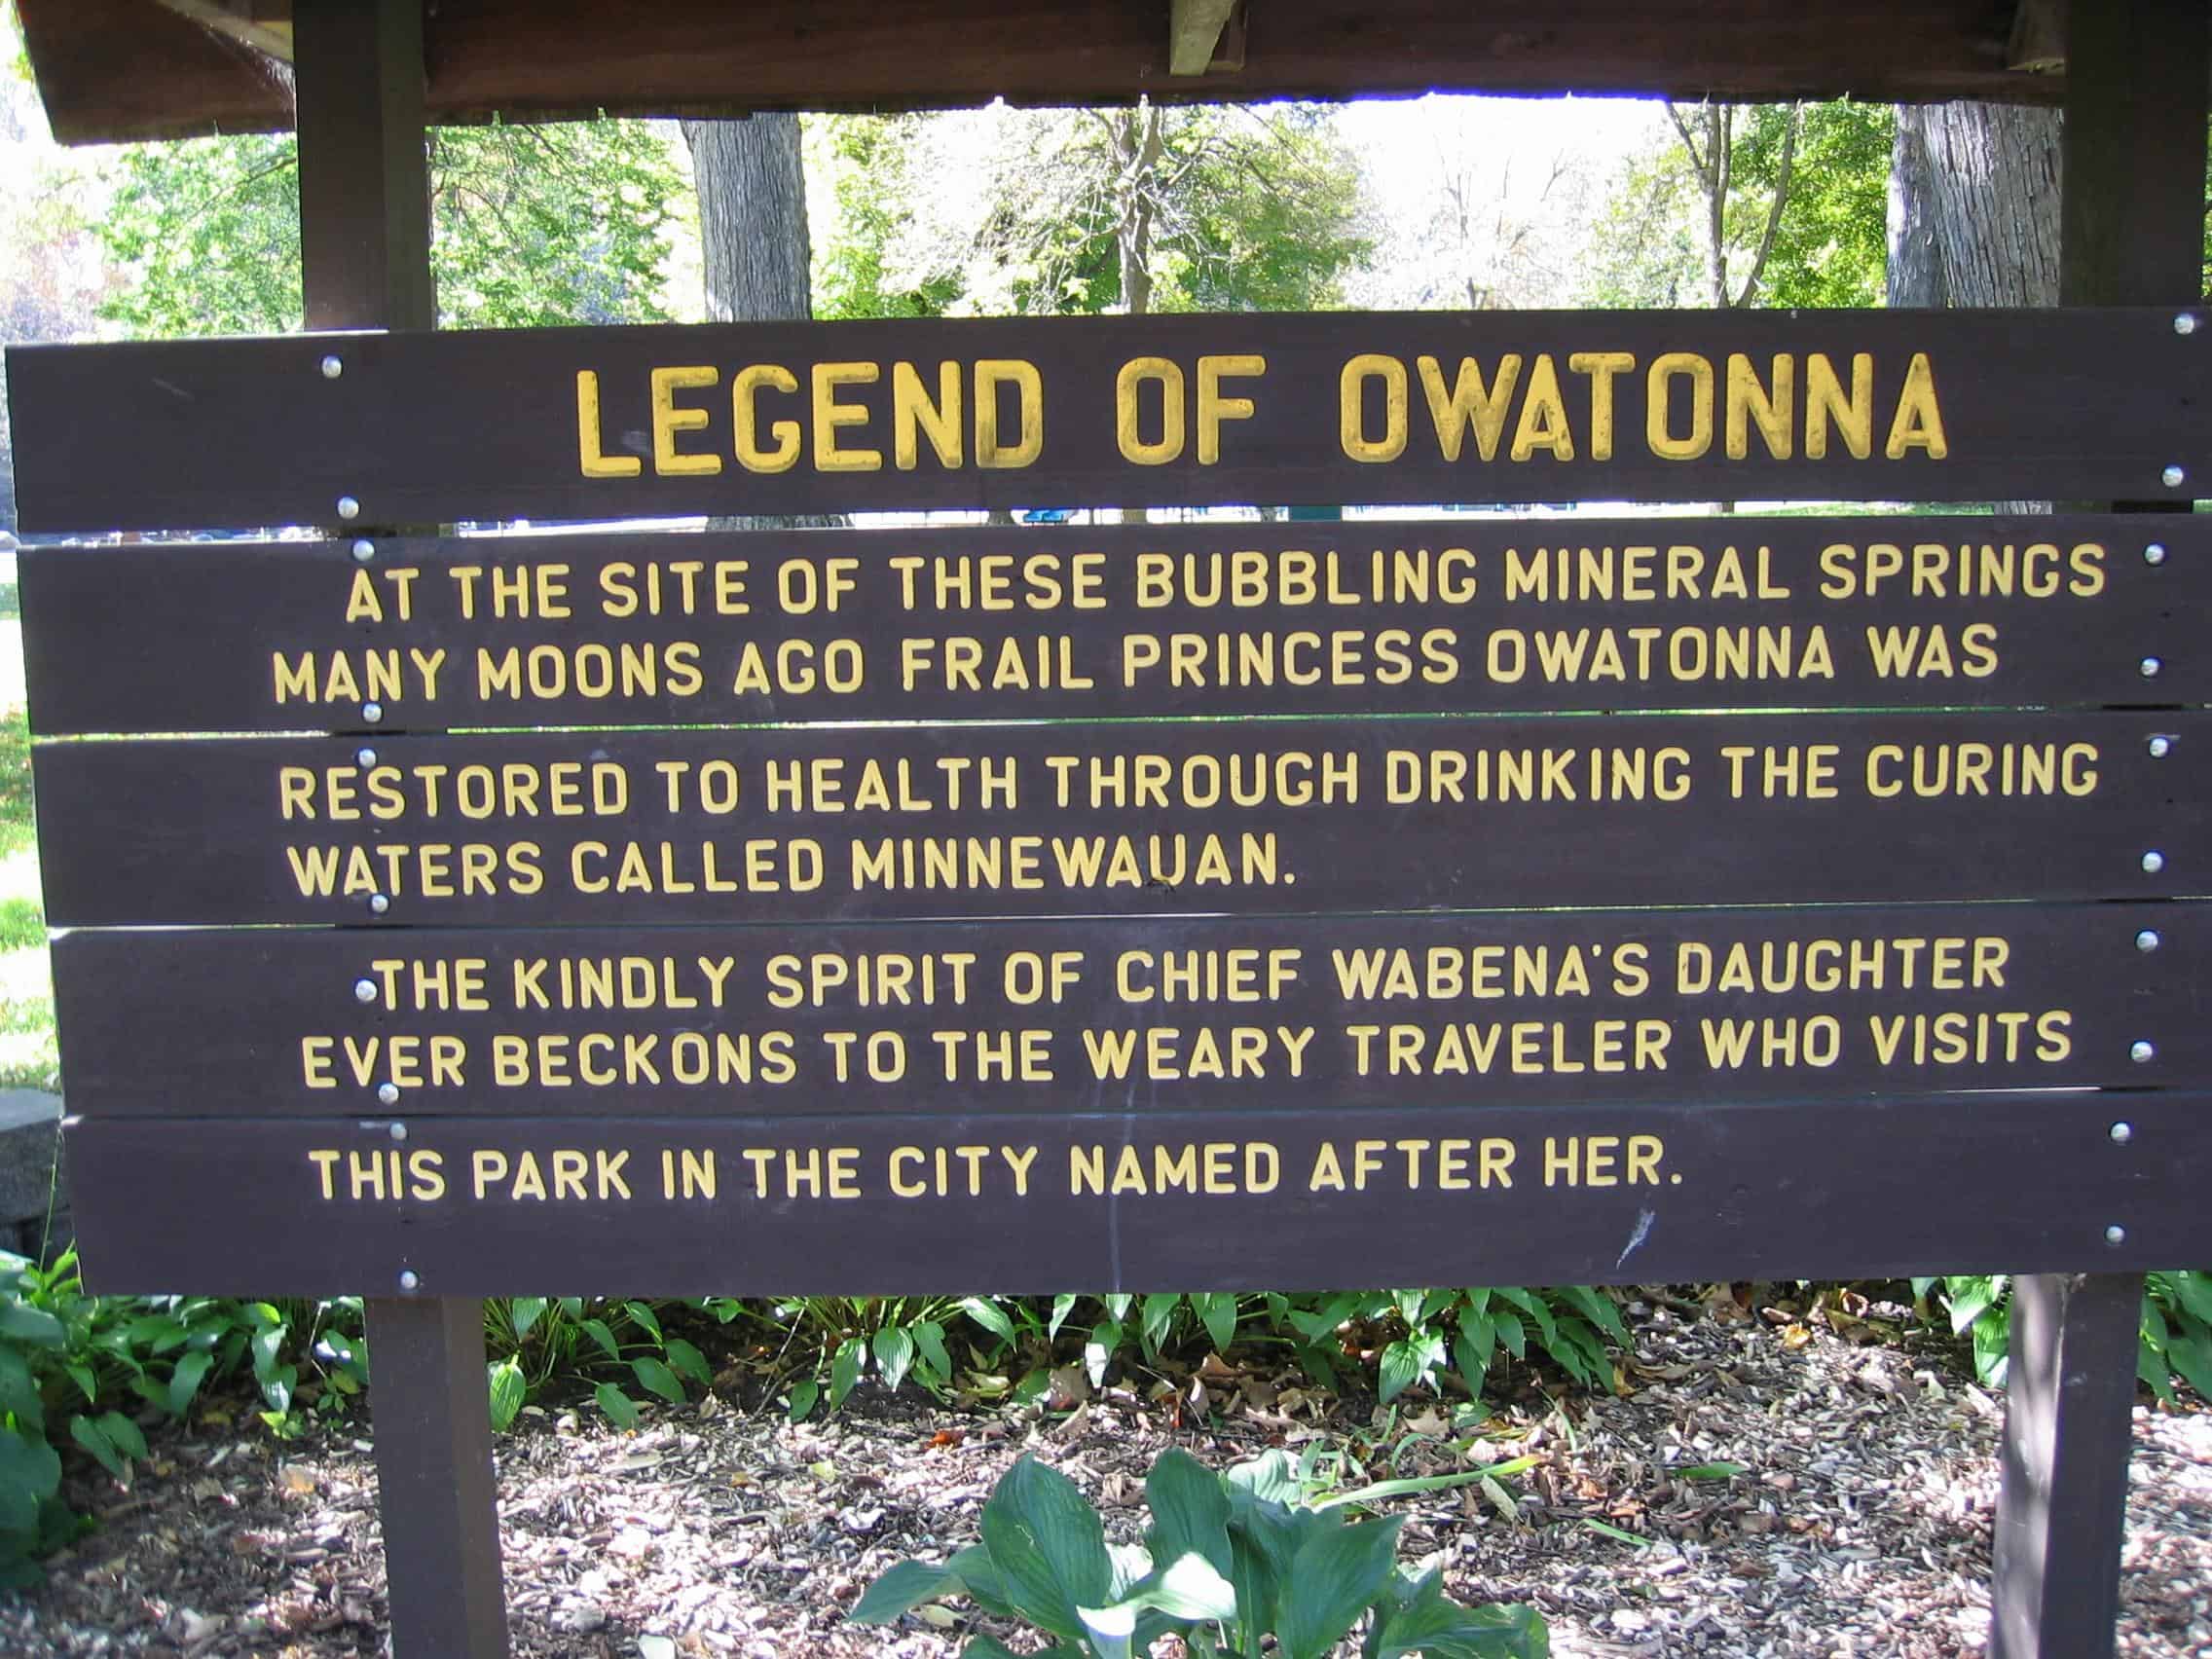
- Median home value: $216,700
- Homes worth over $1 million: 0.1%
- Homeownership rate: 73.7%
- Median household income: $78,295
- Total population: 26,400
38. Moorhead
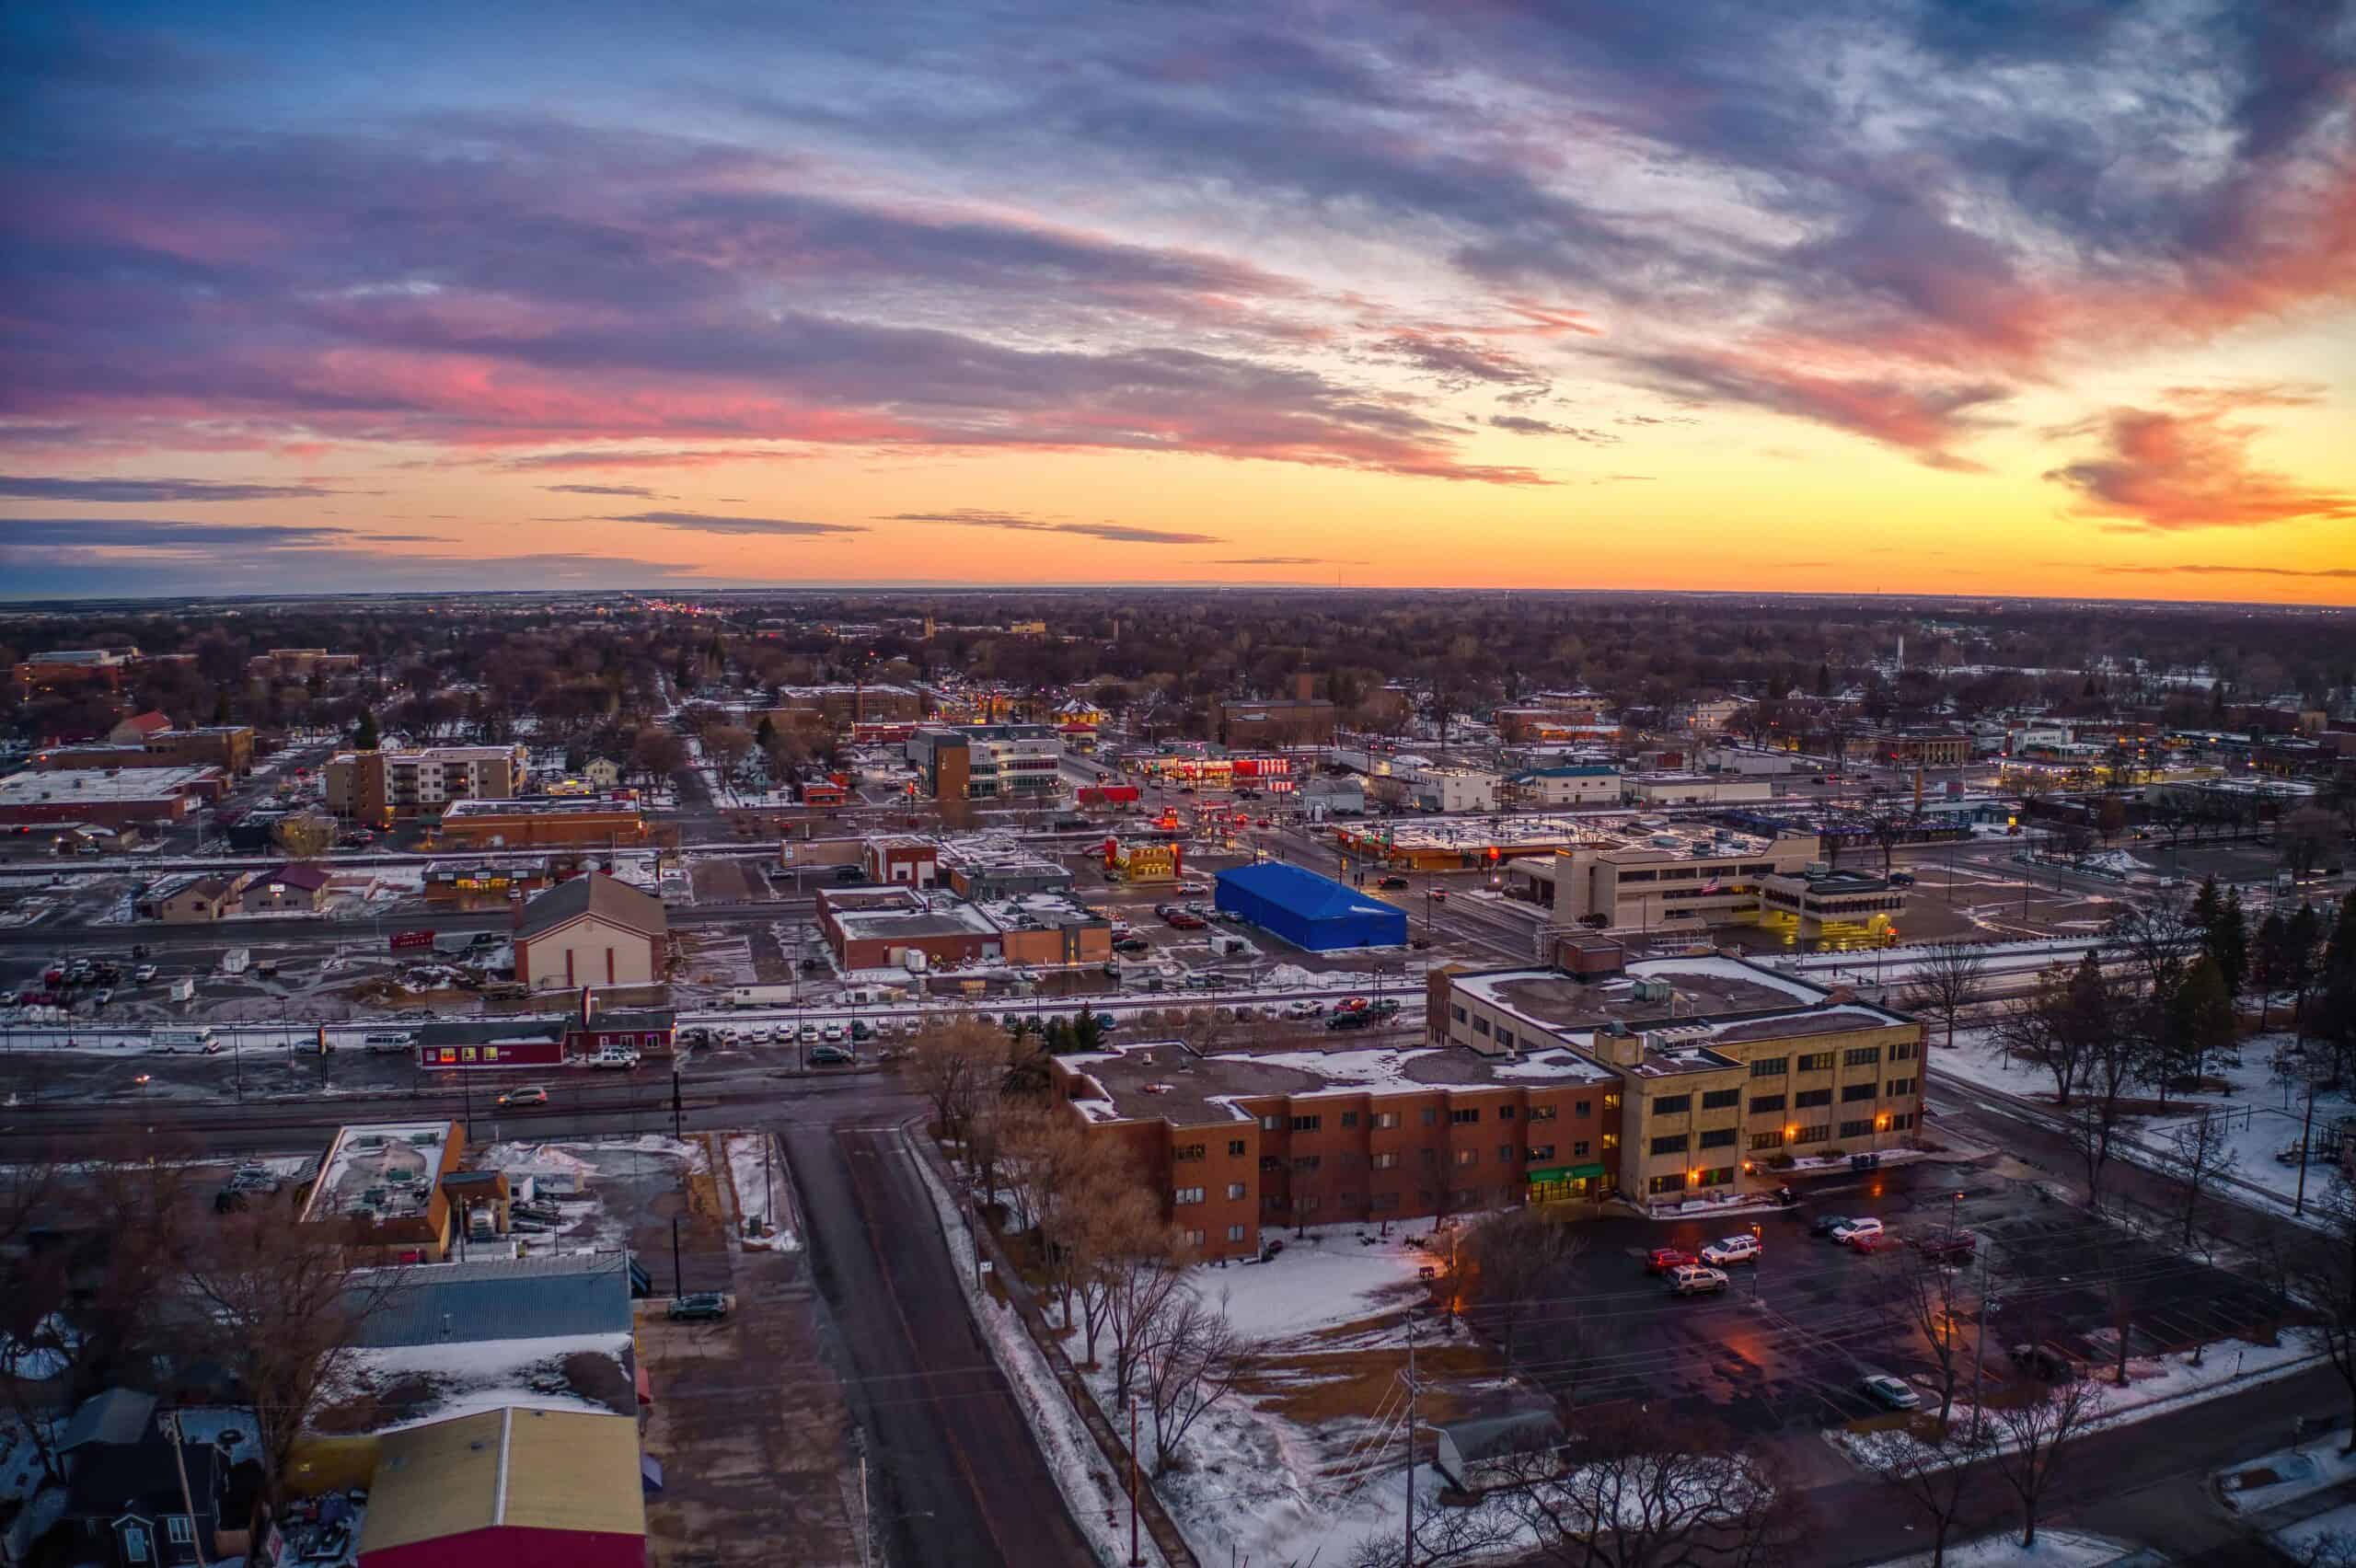
- Median home value: $234,300
- Homes worth over $1 million: 0.9%
- Homeownership rate: 57.8%
- Median household income: $68,680
- Total population: 44,443
37. Mankato
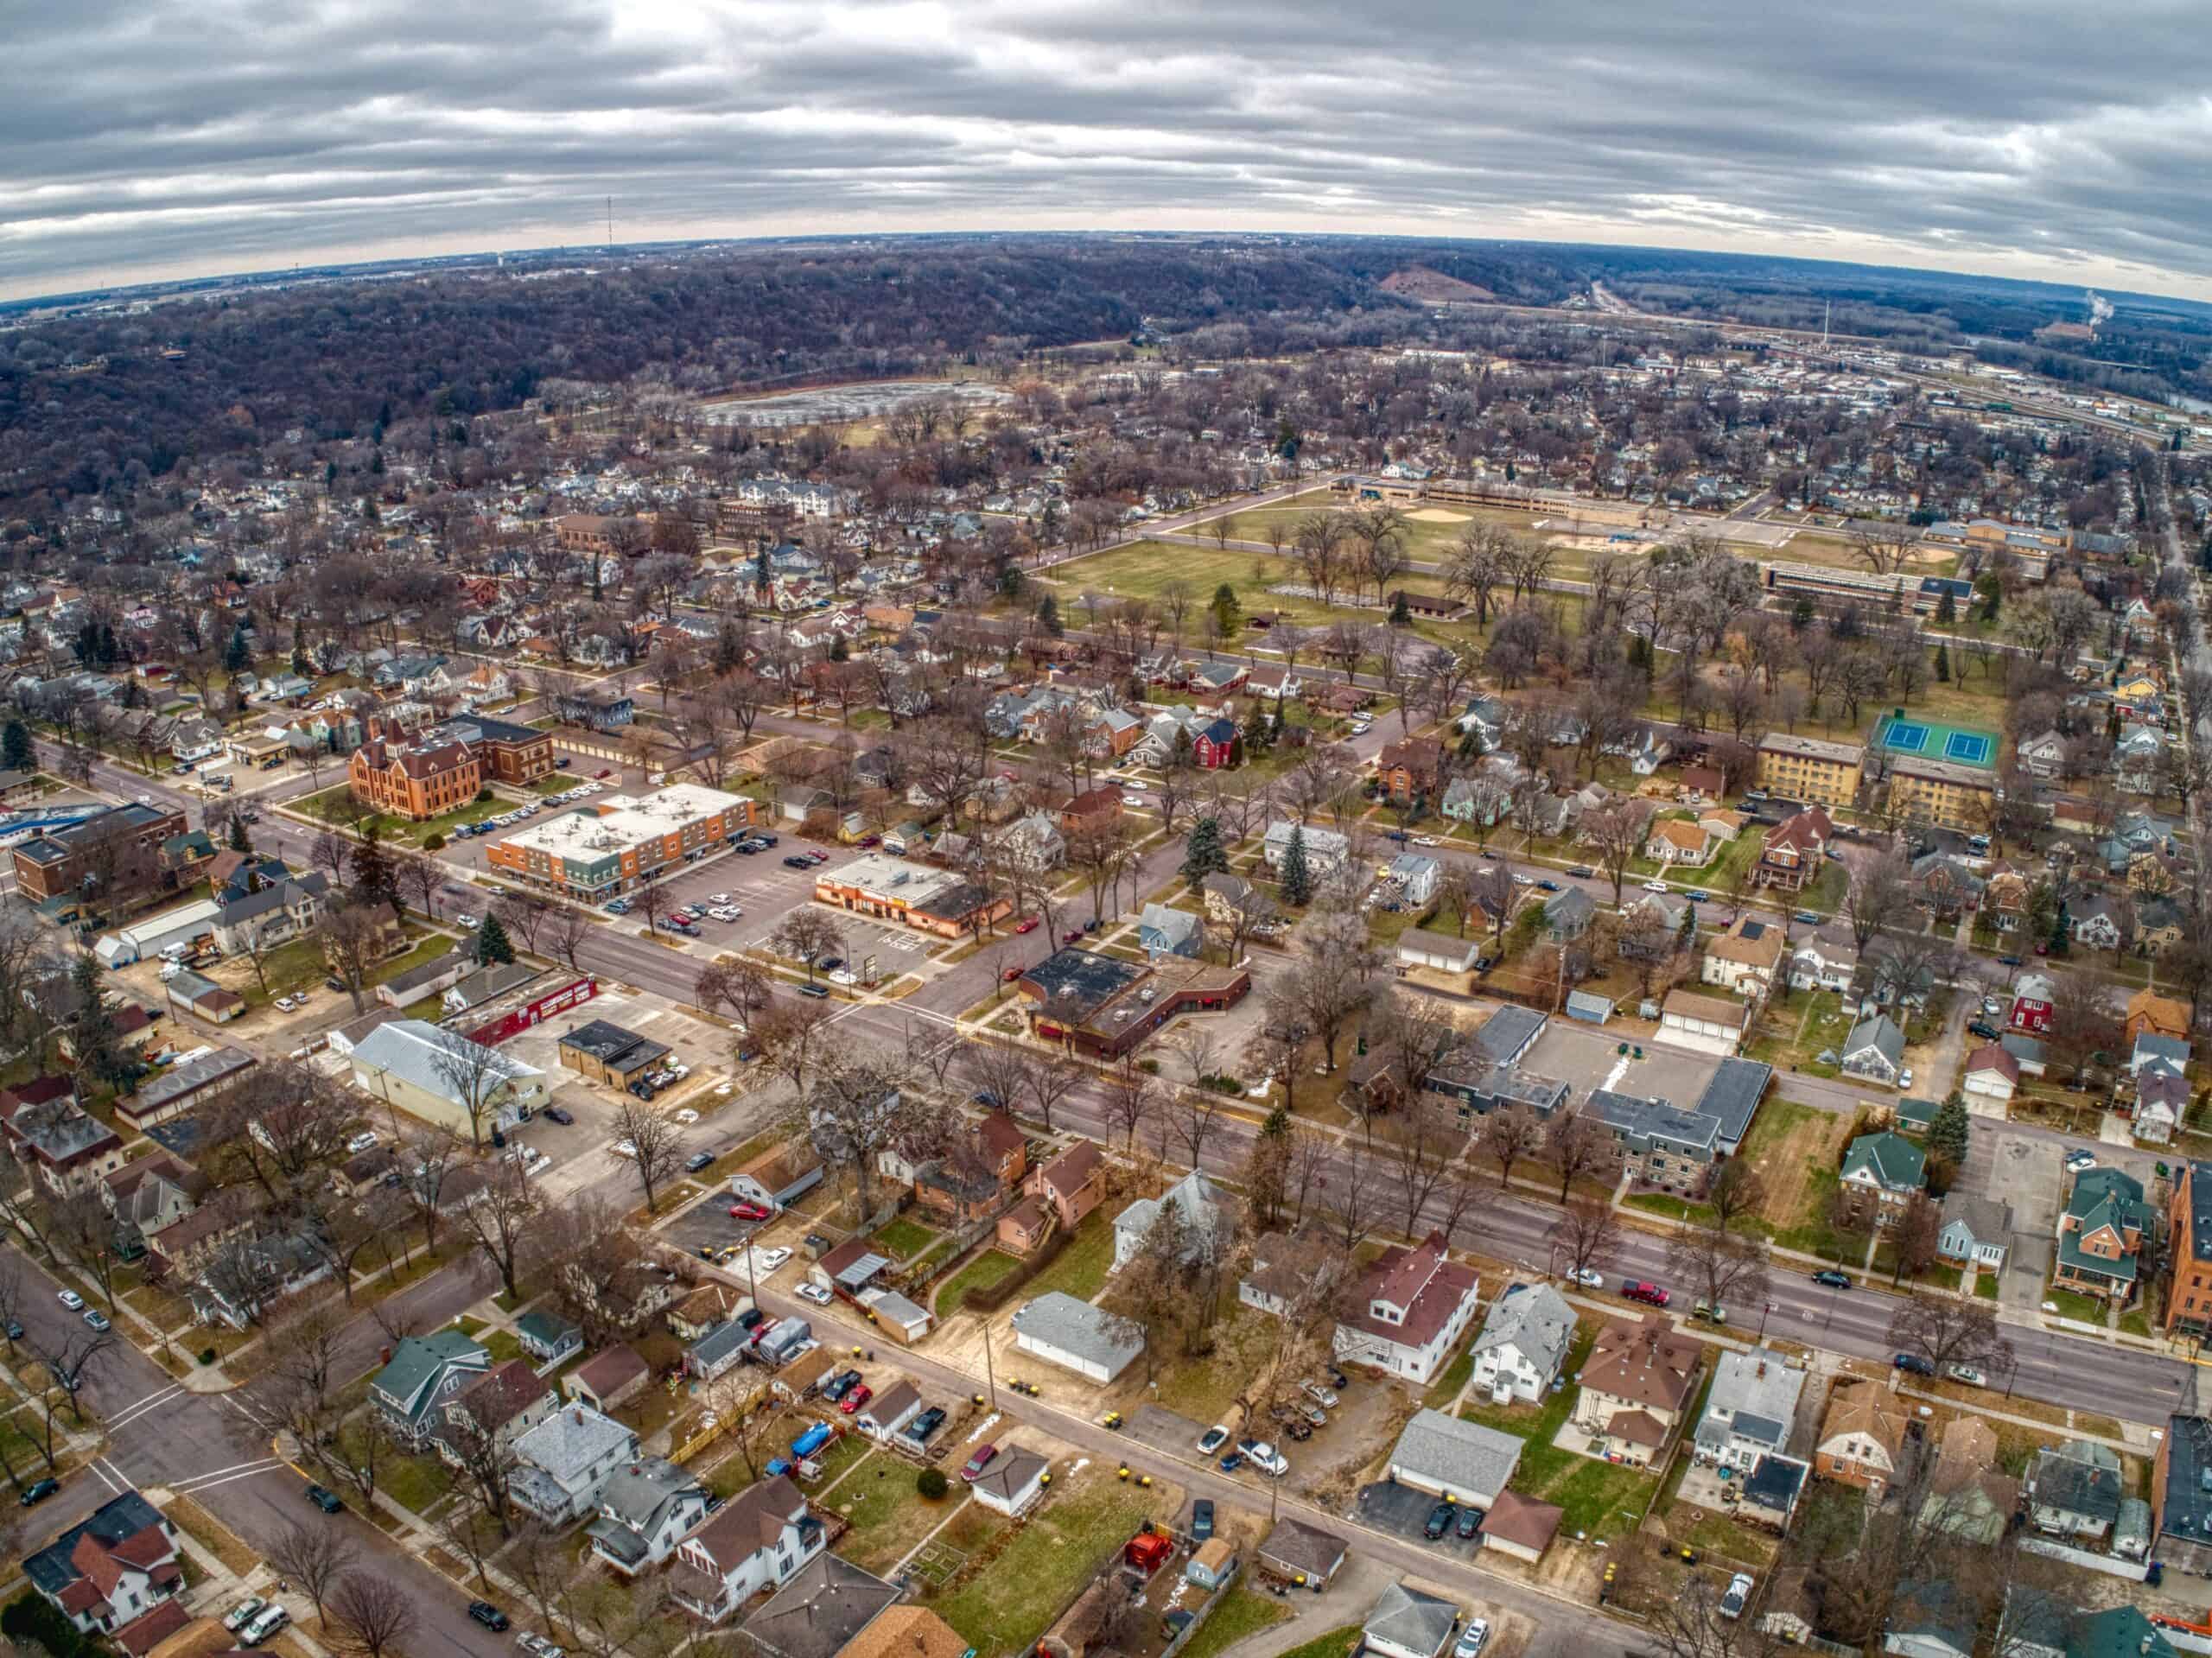
- Median home value: $236,200
- Homes worth over $1 million: 1.0%
- Homeownership rate: 49.6%
- Median household income: $61,726
- Total population: 44,444
36. Brooklyn Center
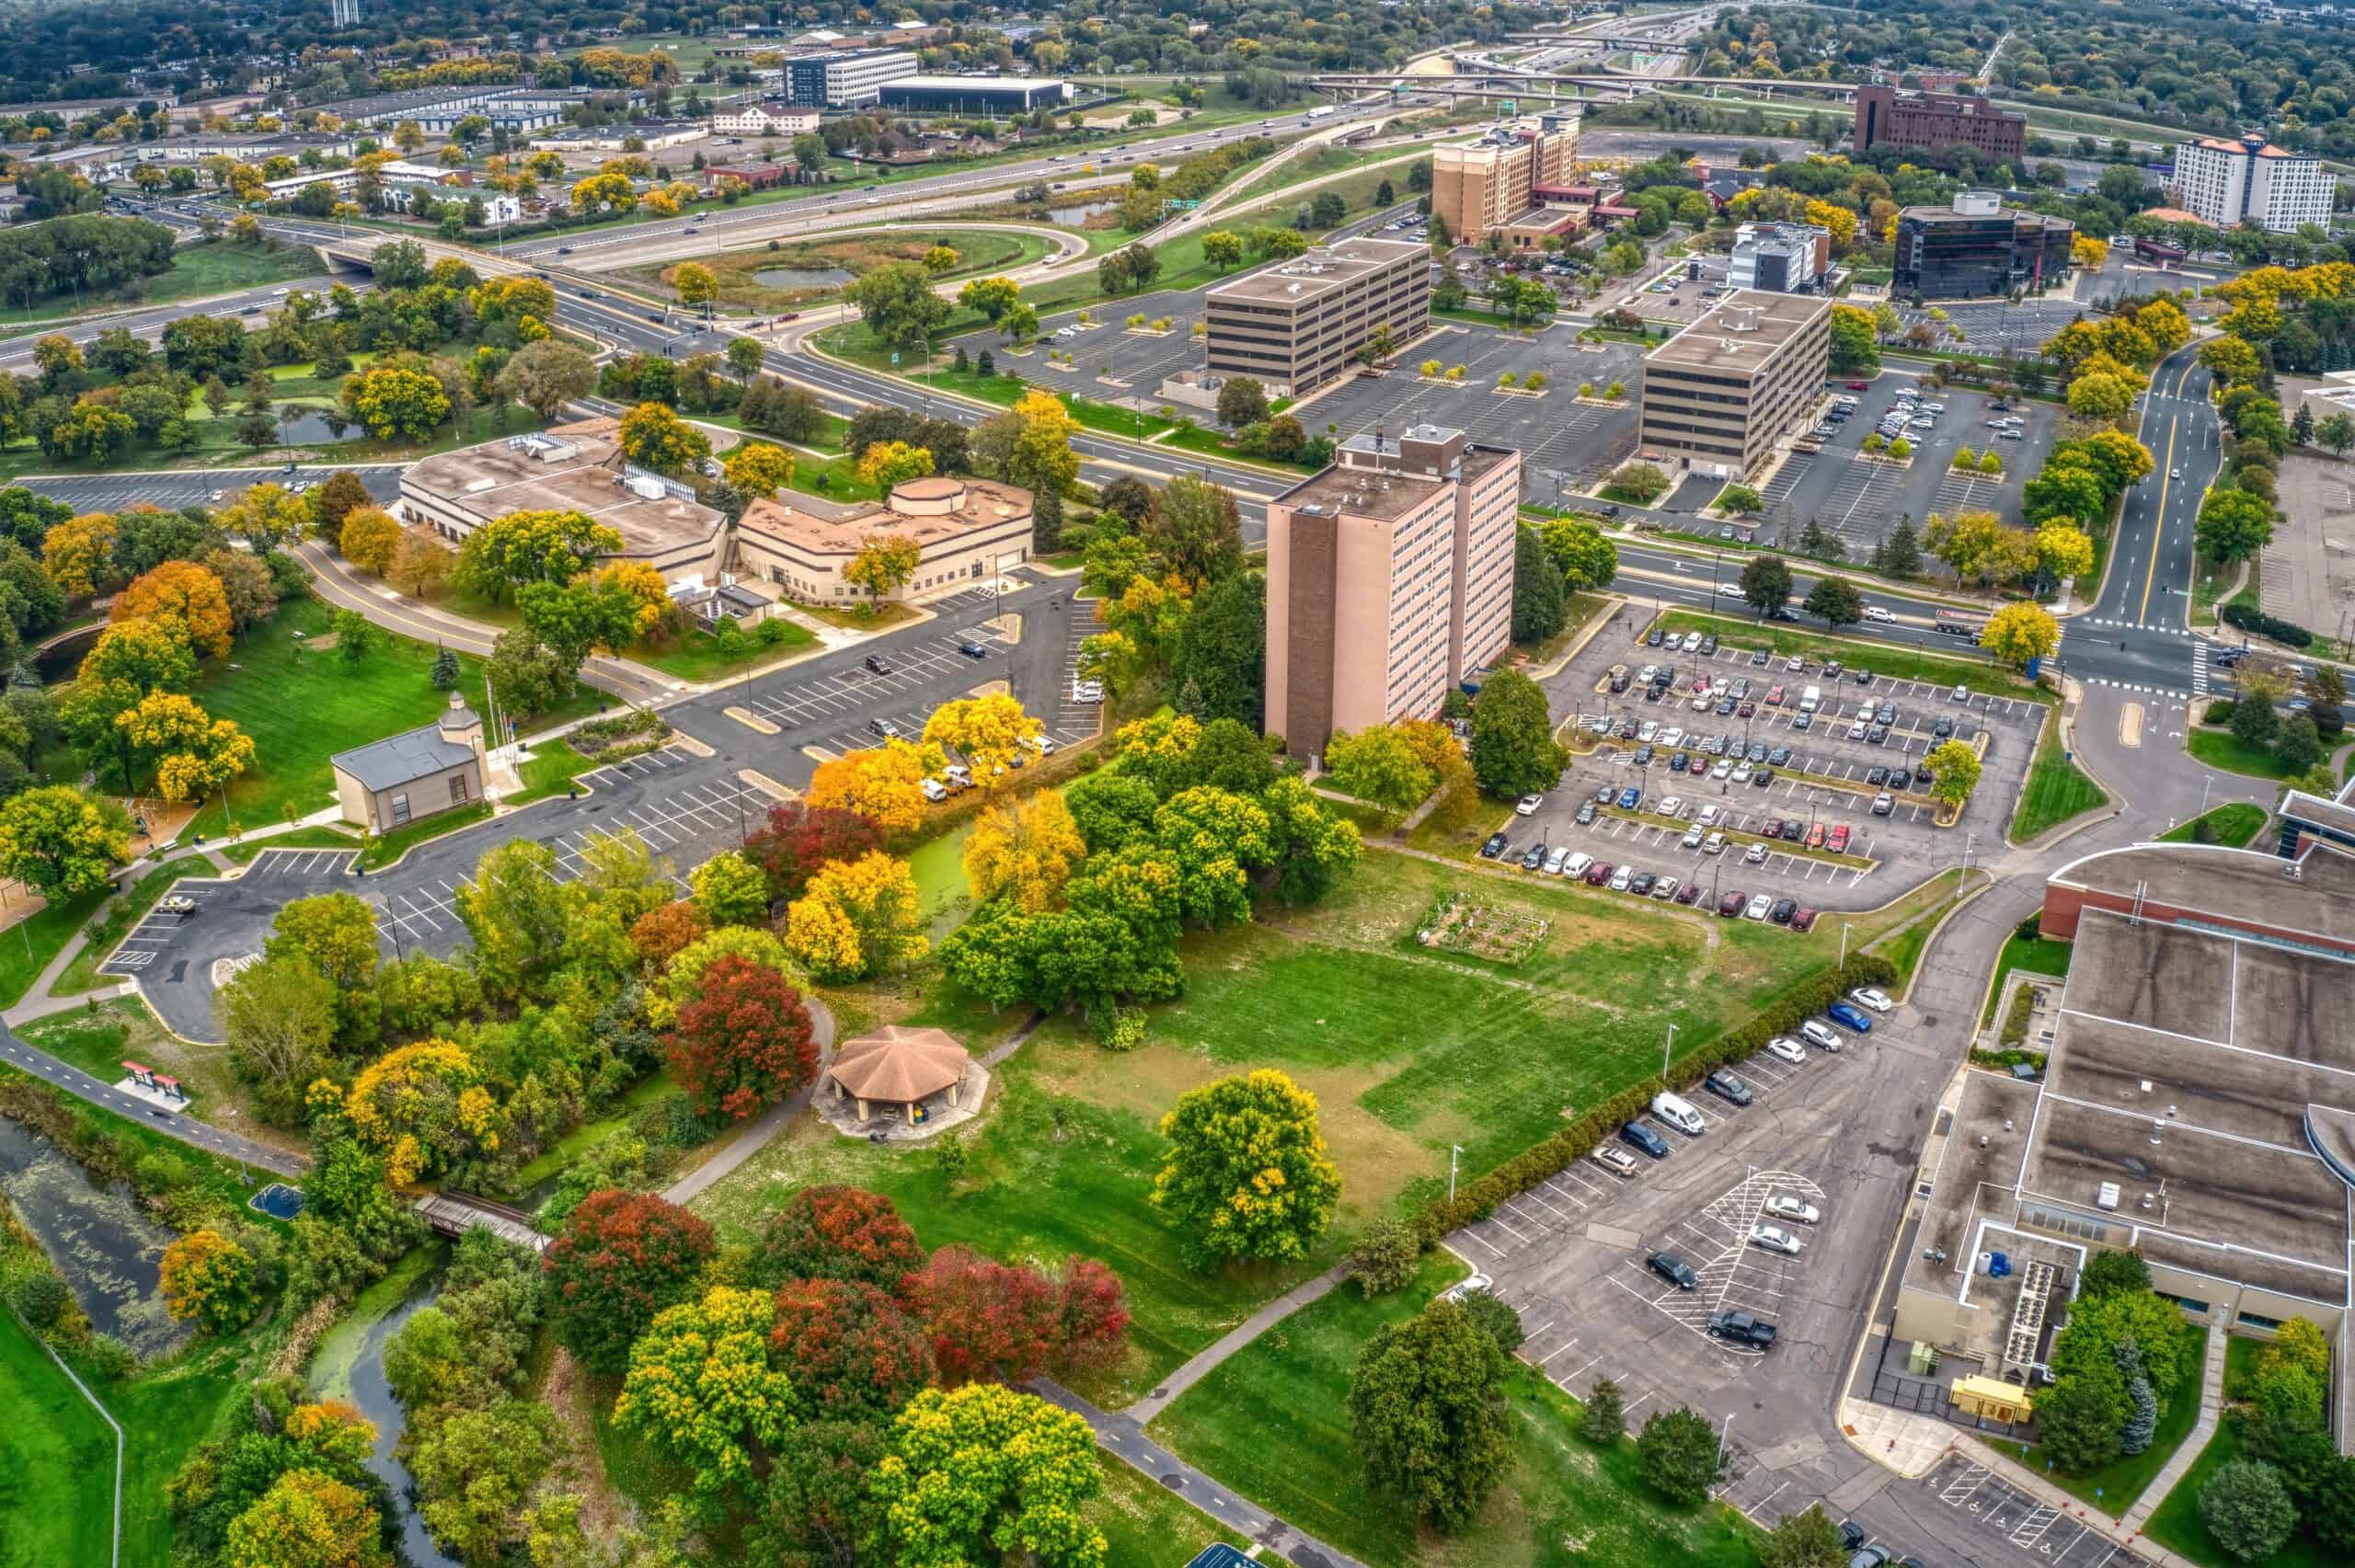
- Median home value: $240,800
- Homes worth over $1 million: 1.0%
- Homeownership rate: 61.0%
- Median household income: $70,692
- Total population: 33,109
35. Fridley

- Median home value: $257,100
- Homes worth over $1 million: 0.4%
- Homeownership rate: 60.9%
- Median household income: $76,592
- Total population: 29,731
34. St. Paul
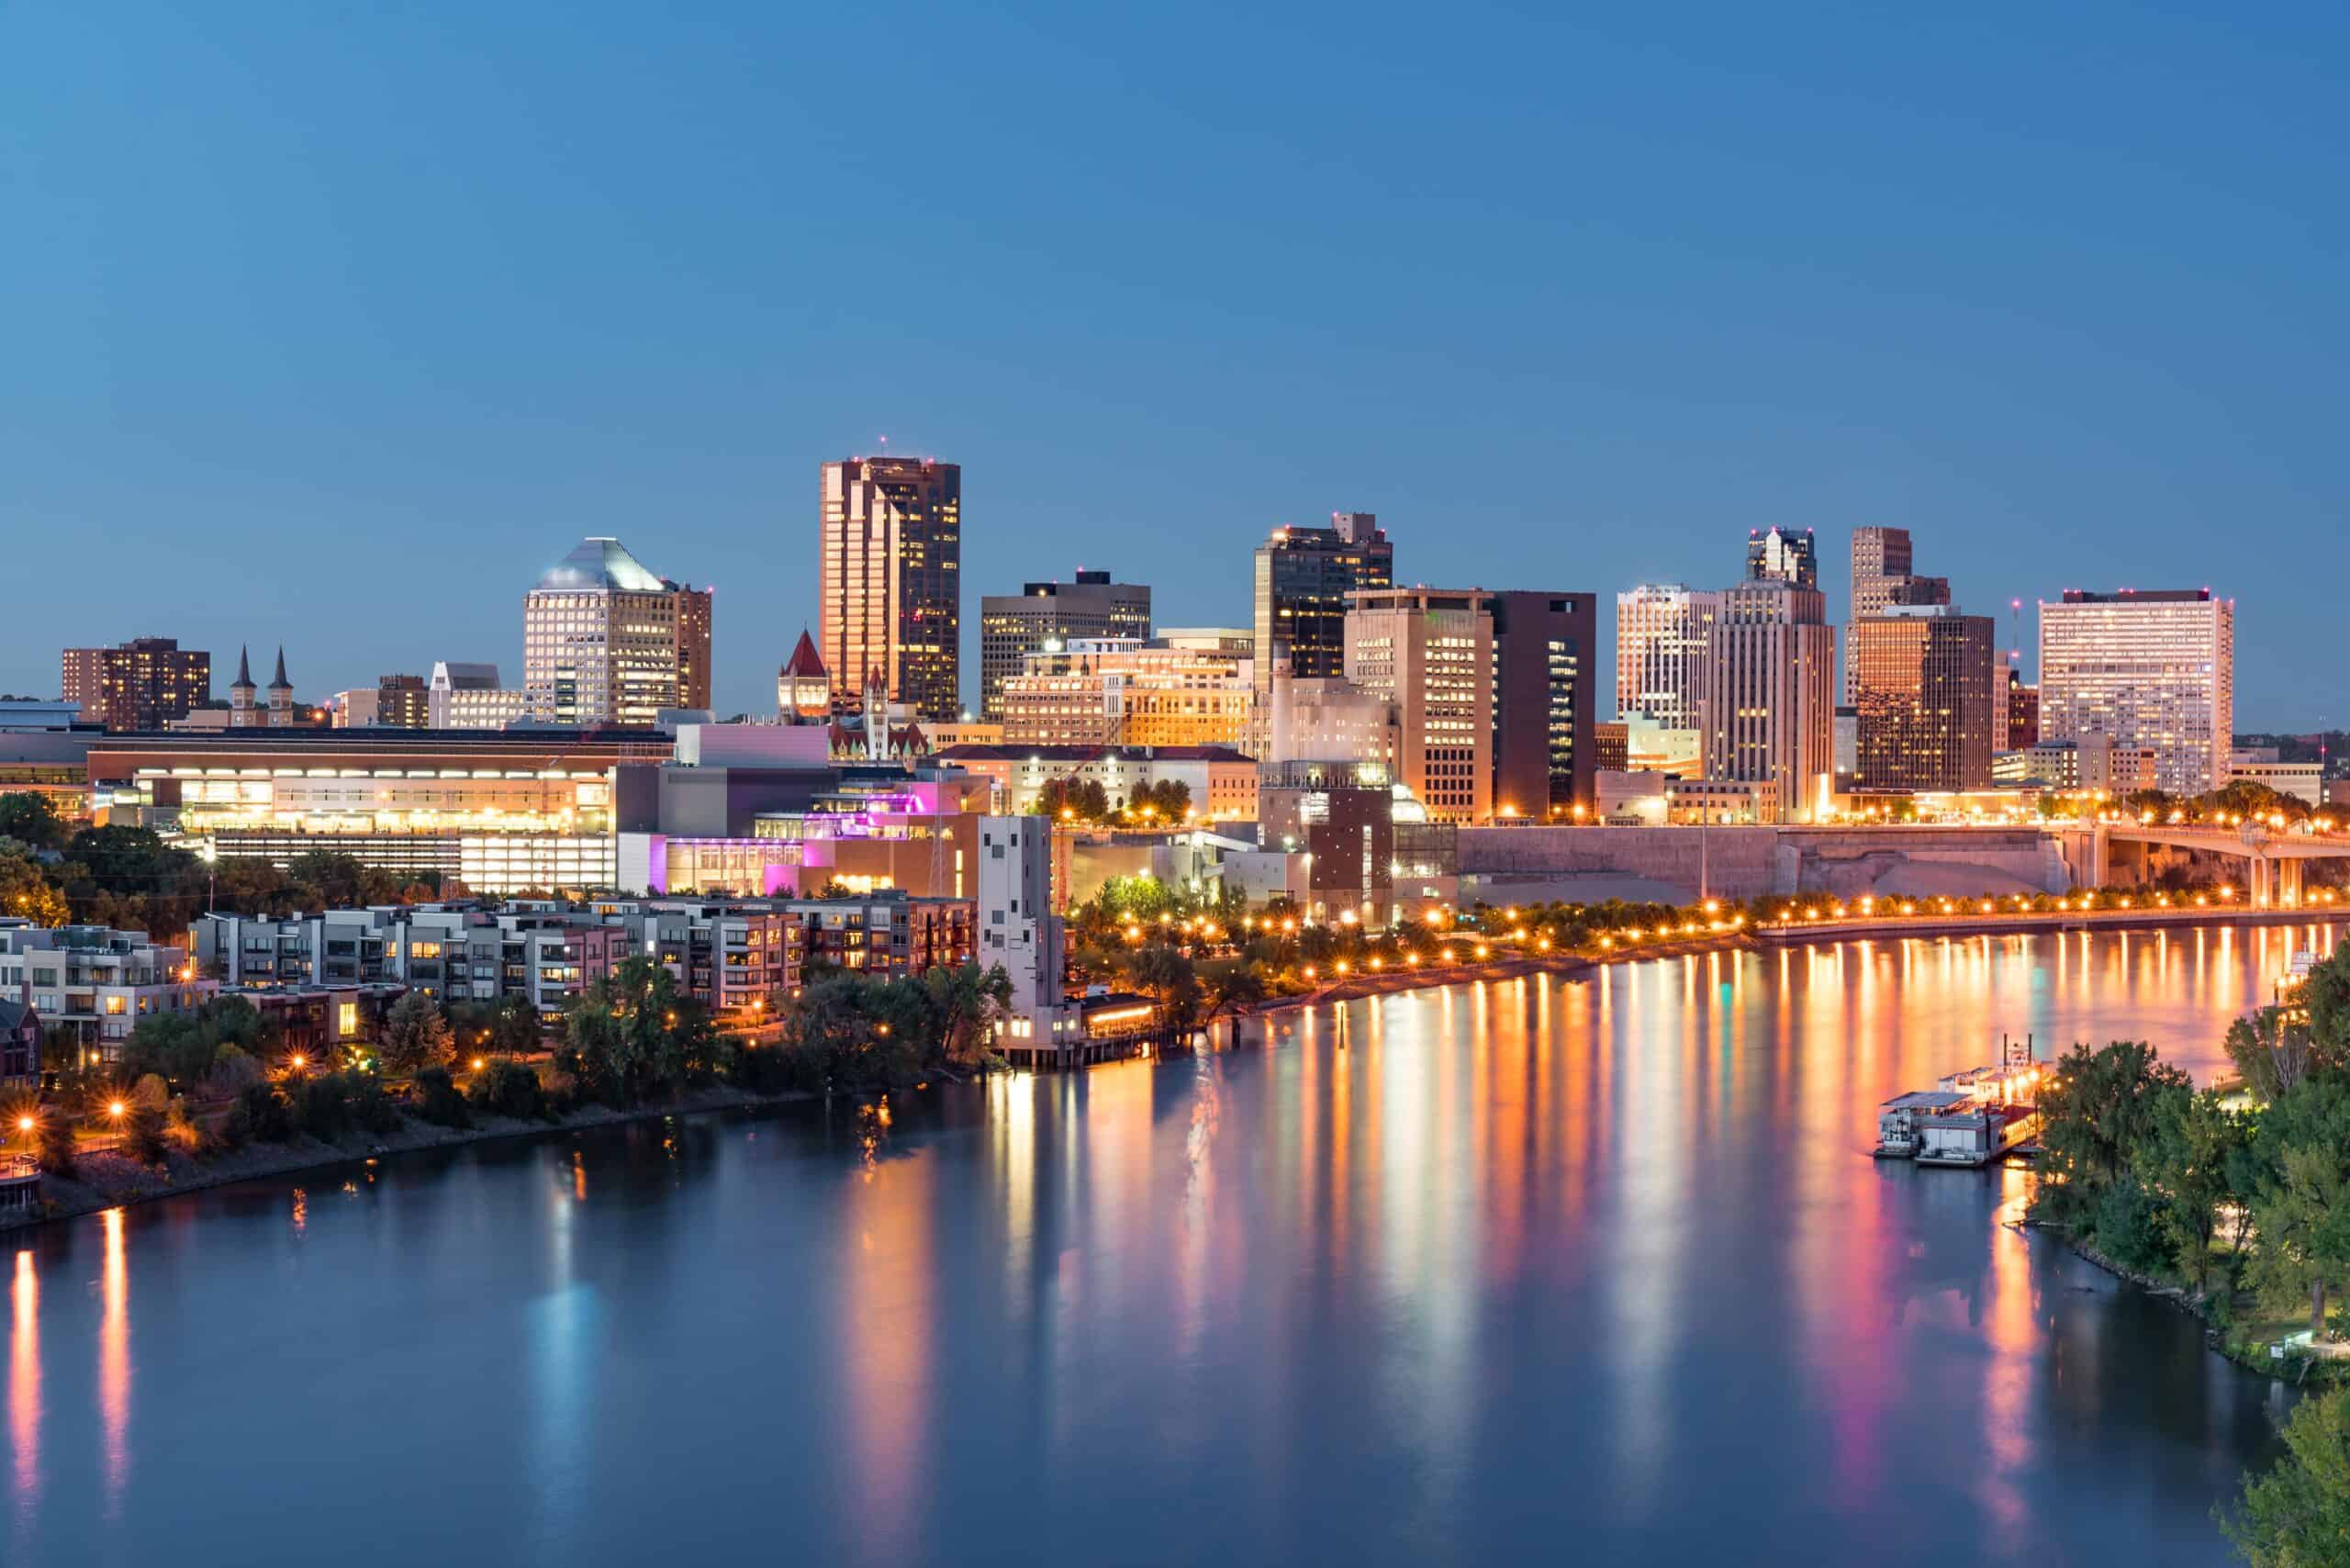
- Median home value: $264,900
- Homes worth over $1 million: 1.7%
- Homeownership rate: 53.0%
- Median household income: $69,919
- Total population: 308,806
33. Coon Rapids
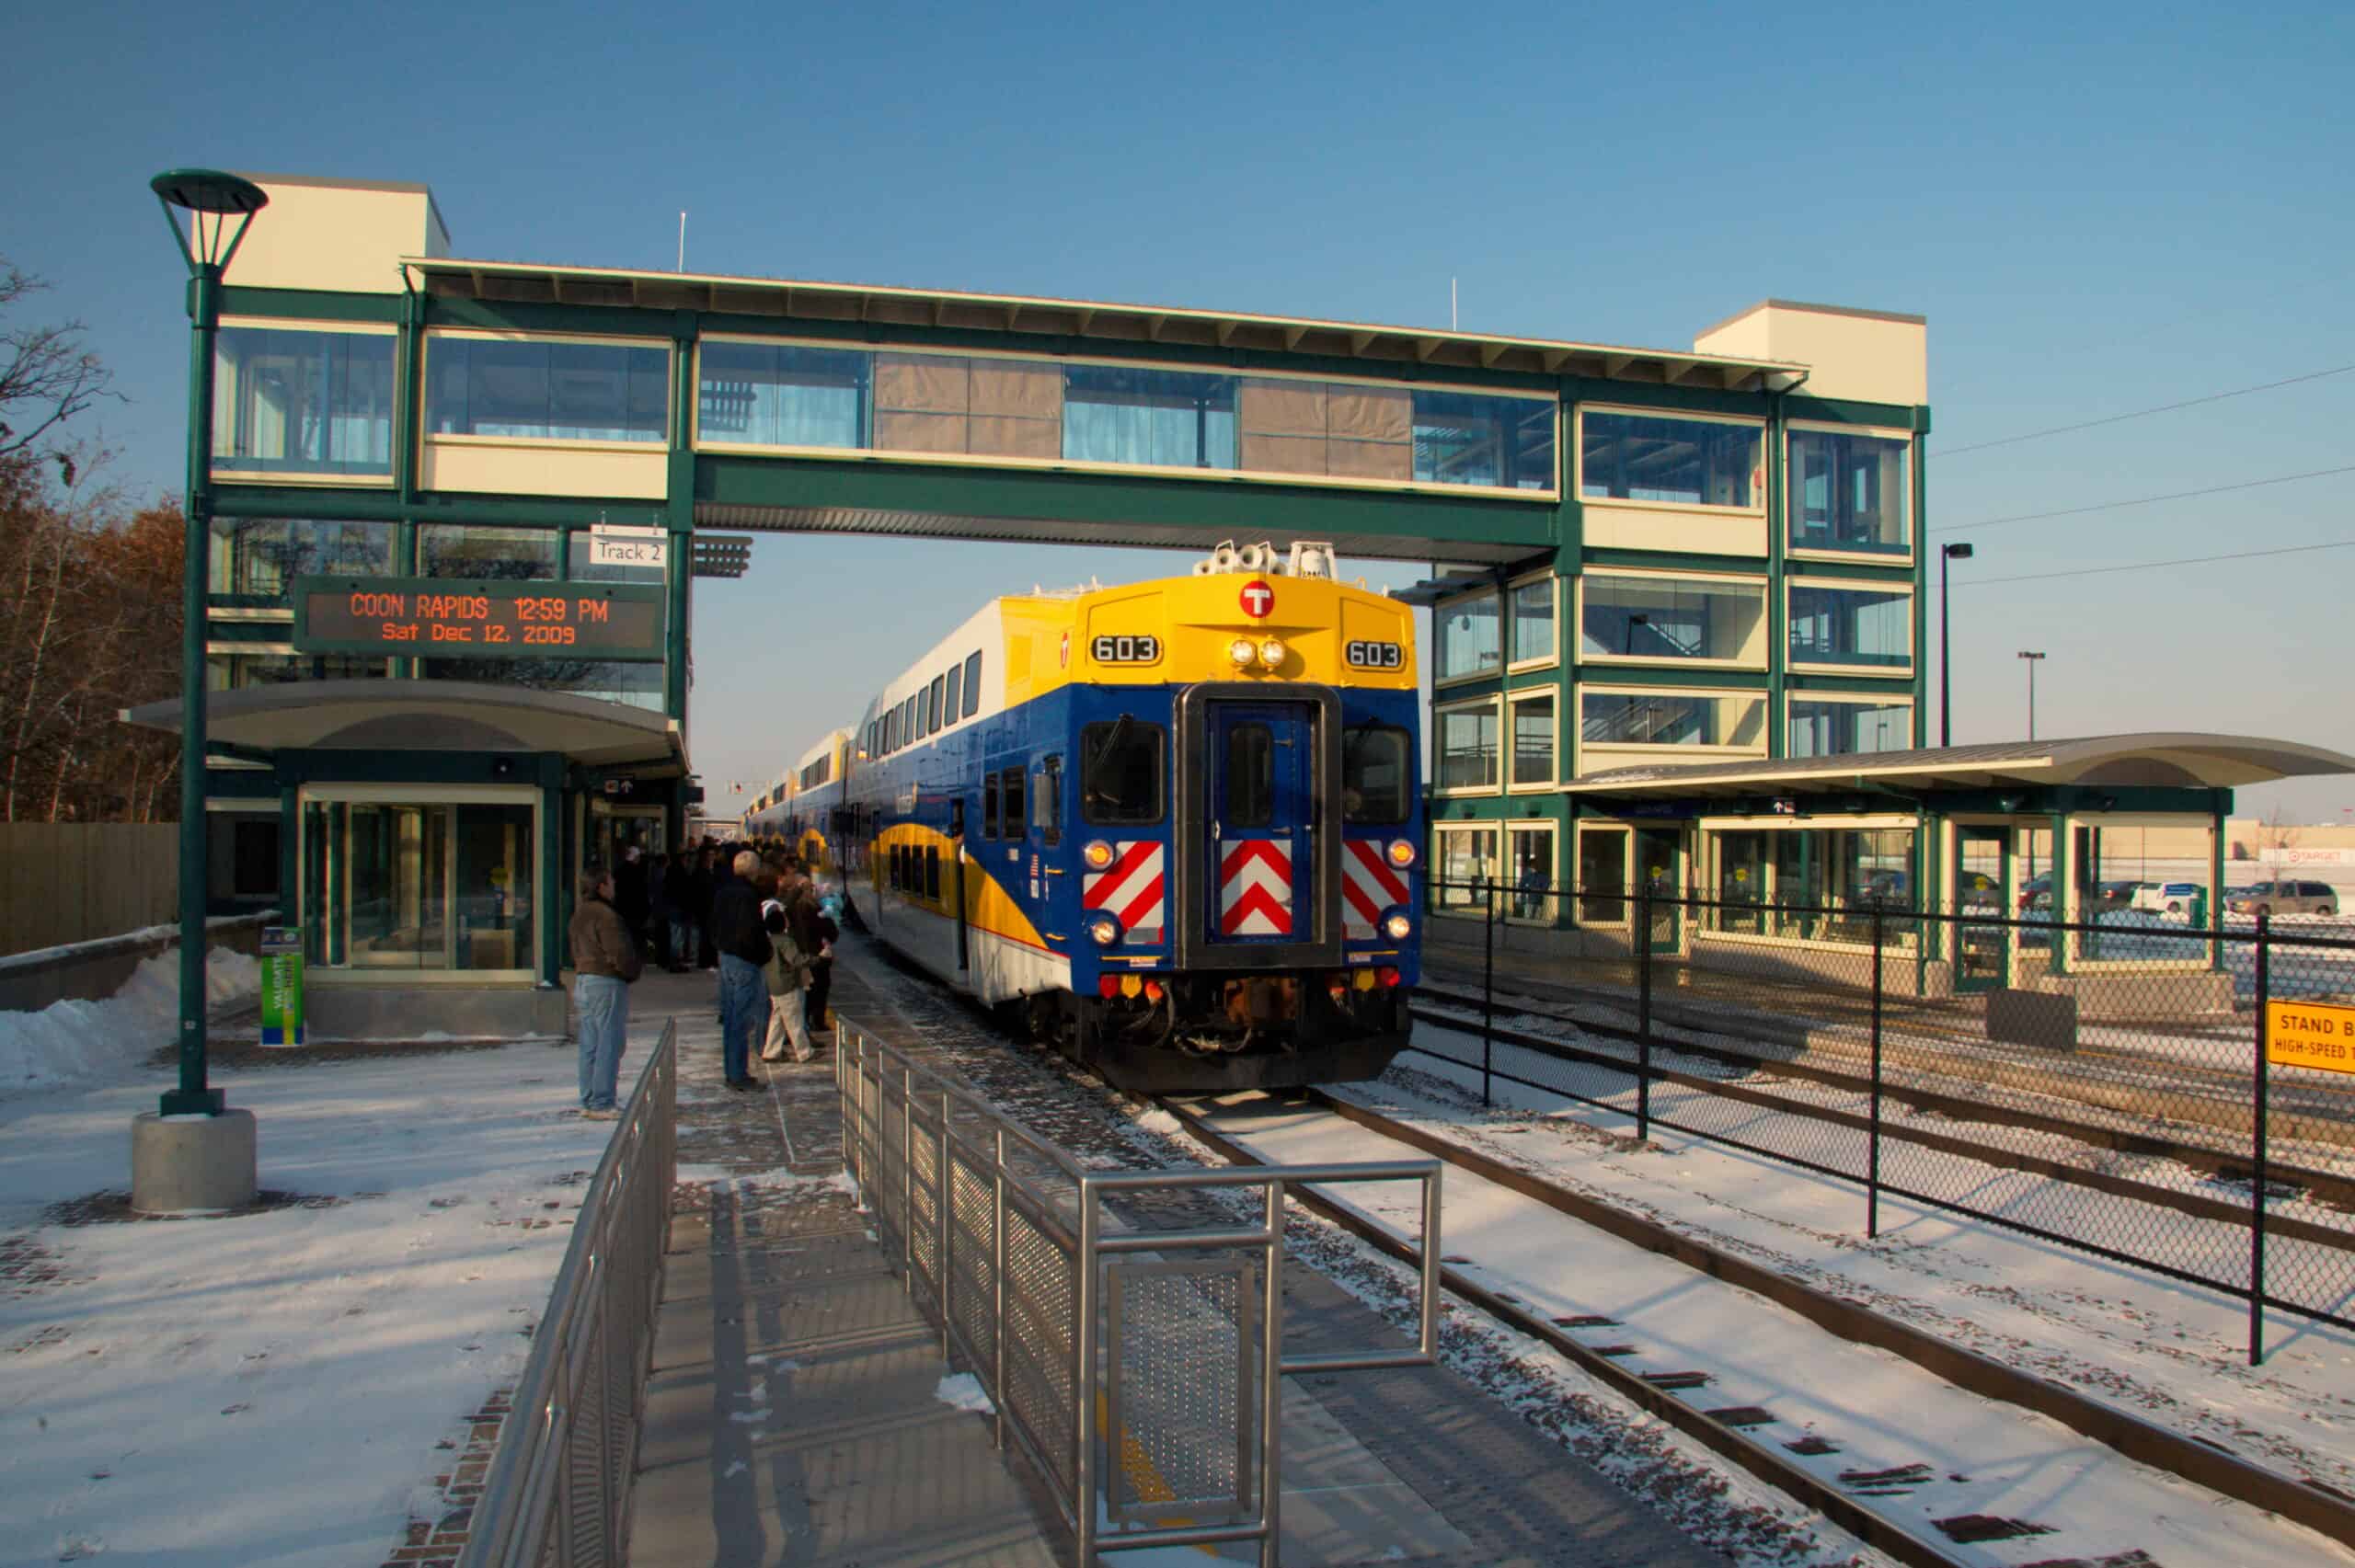
- Median home value: $268,500
- Homes worth over $1 million: 0.1%
- Homeownership rate: 74.8%
- Median household income: $85,445
- Total population: 63,296
32. Rochester
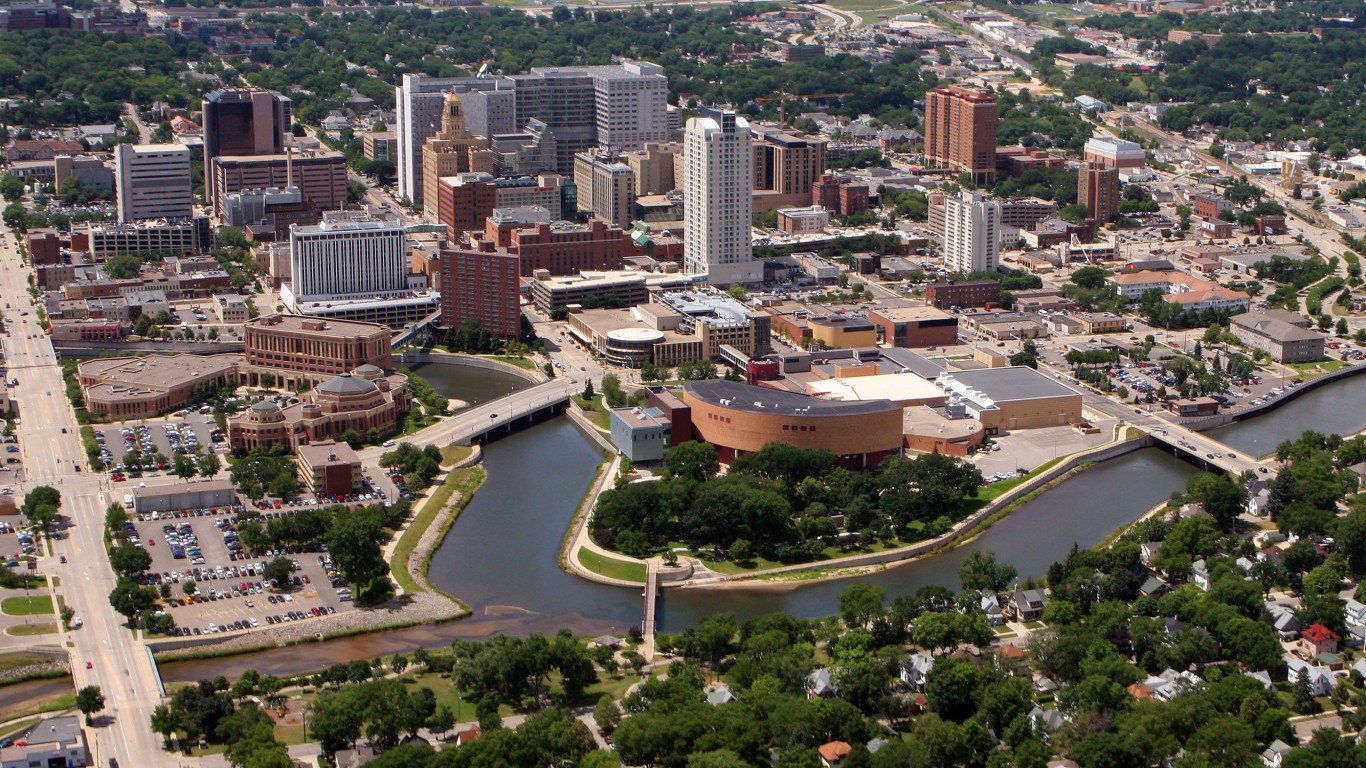
- Median home value: $268,800
- Homes worth over $1 million: 0.9%
- Homeownership rate: 65.5%
- Median household income: $83,973
- Total population: 120,848
31. Maplewood
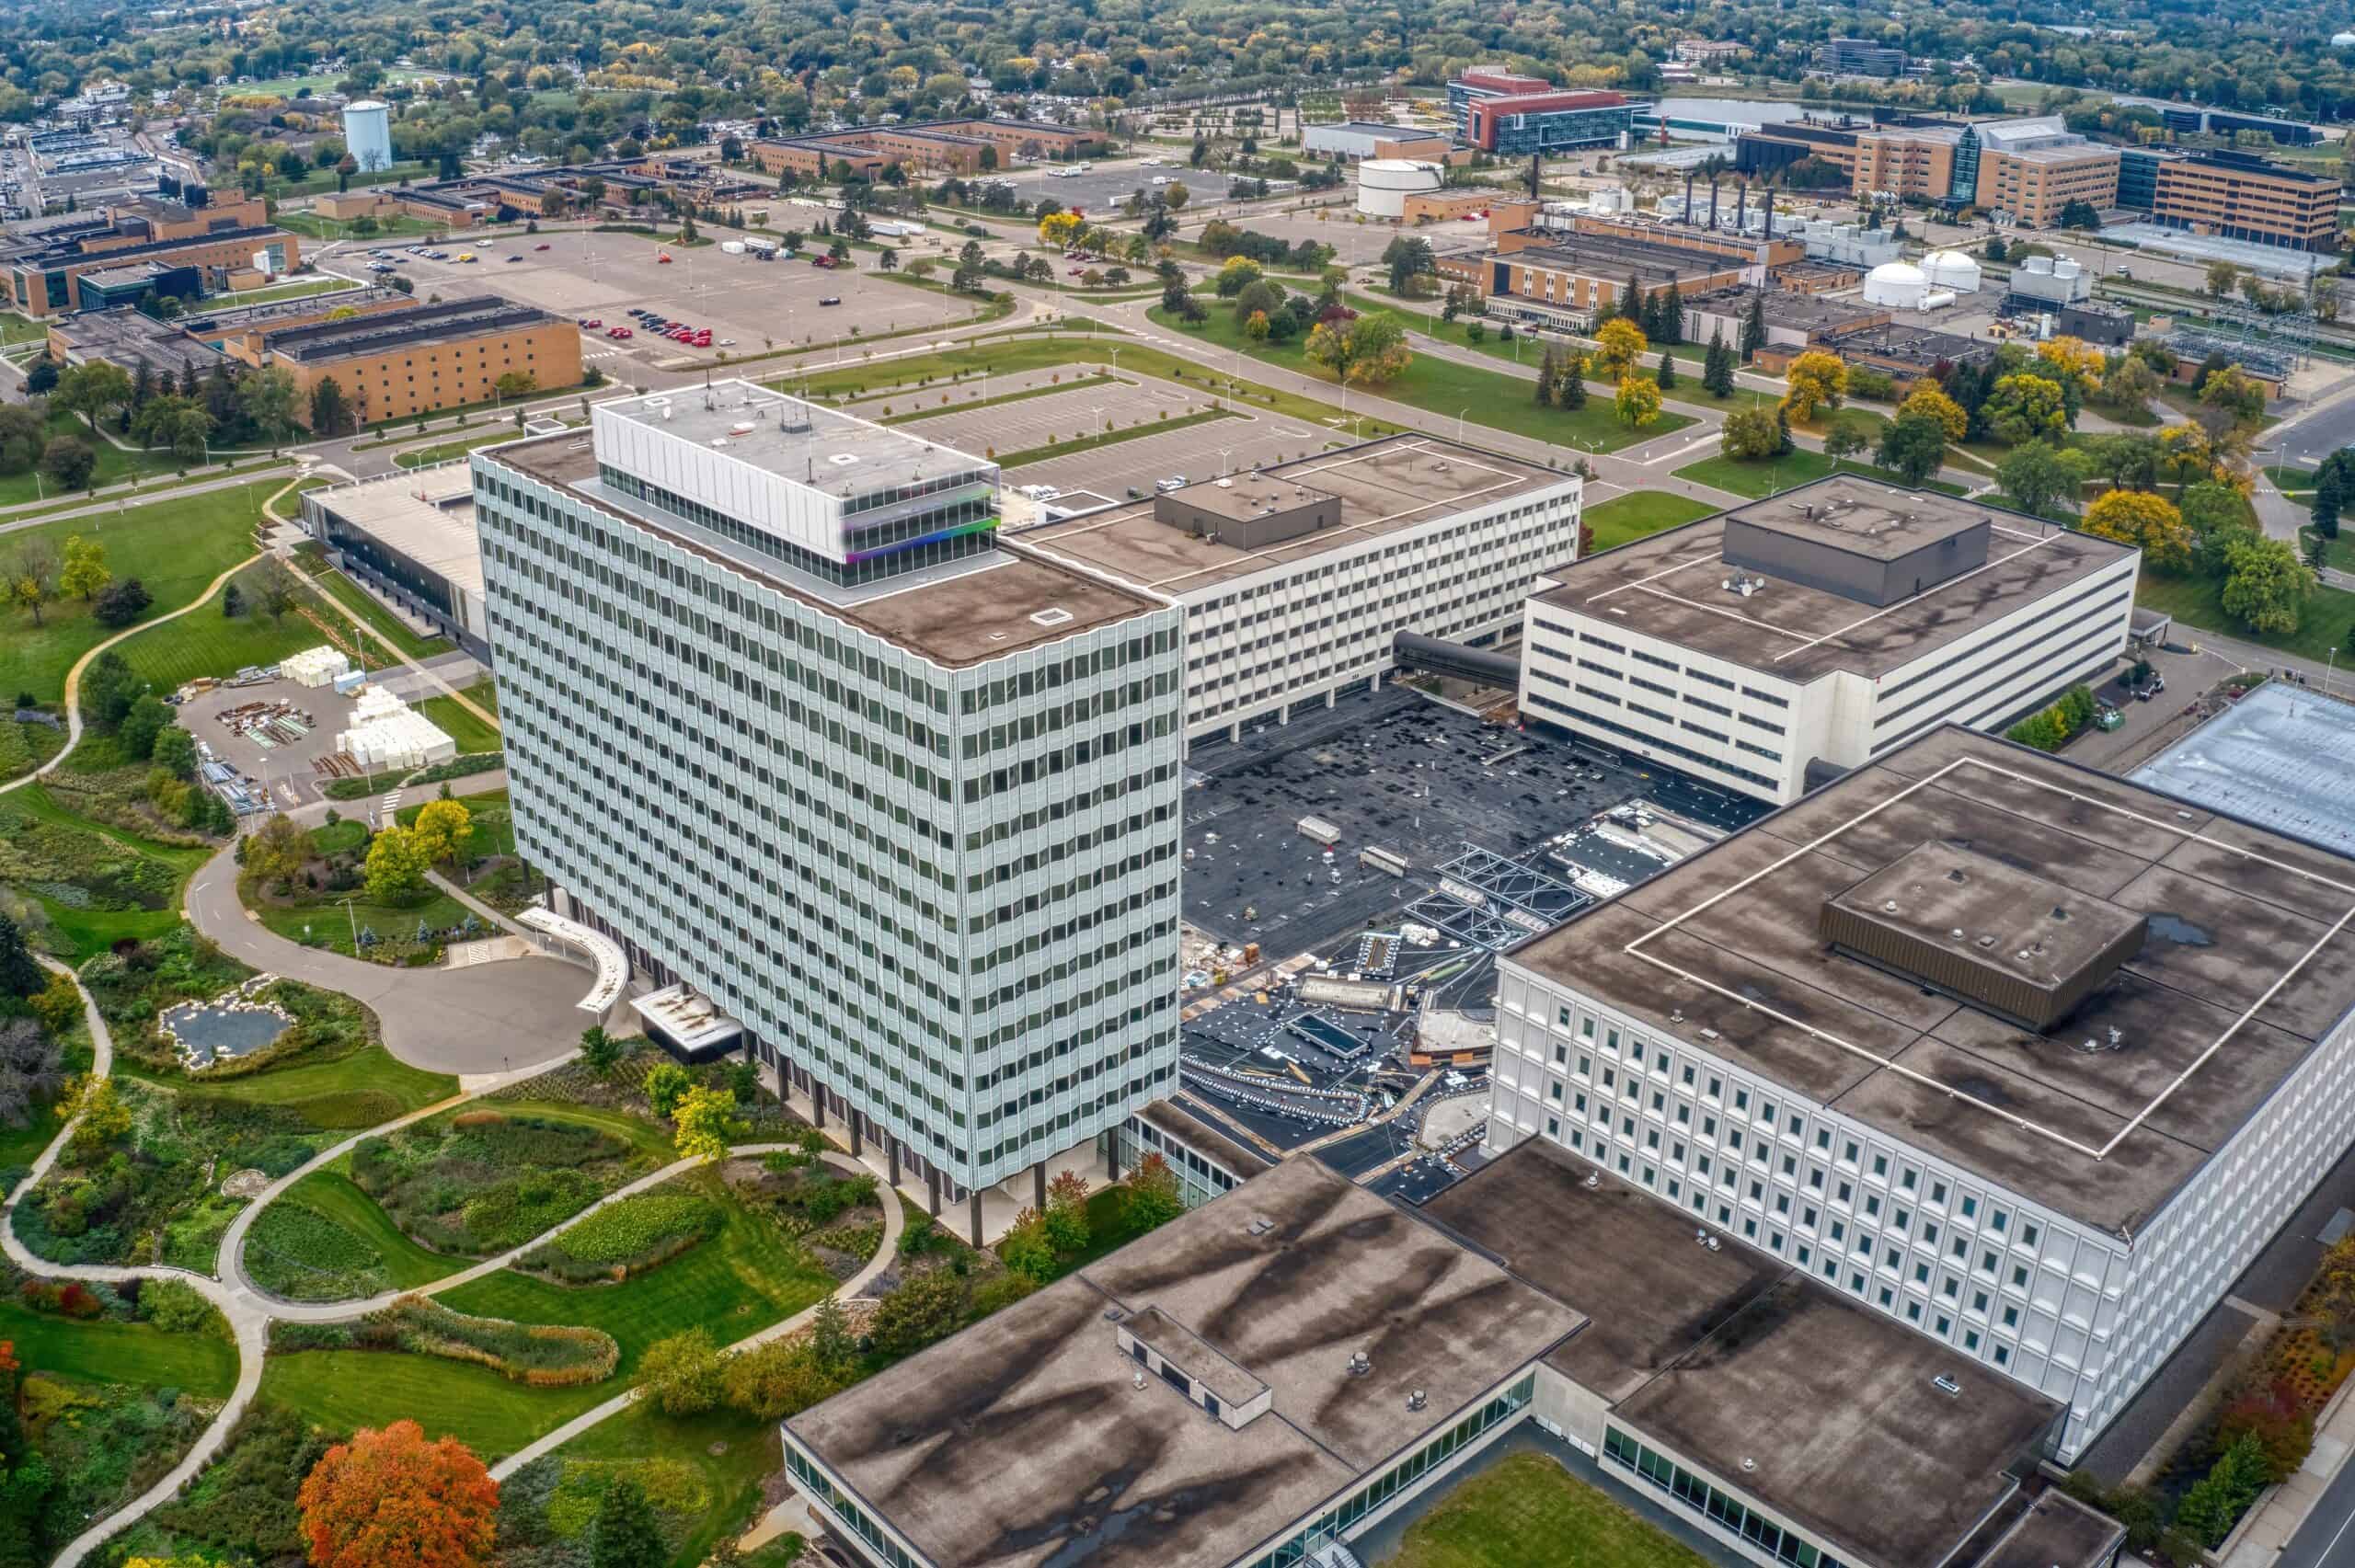
- Median home value: $282,000
- Homes worth over $1 million: 0.4%
- Homeownership rate: 72.1%
- Median household income: $86,769
- Total population: 41,405
30. Oakdale

- Median home value: $288,700
- Homes worth over $1 million: 1.1%
- Homeownership rate: 77.2%
- Median household income: $86,003
- Total population: 28,029
29. Brooklyn Park
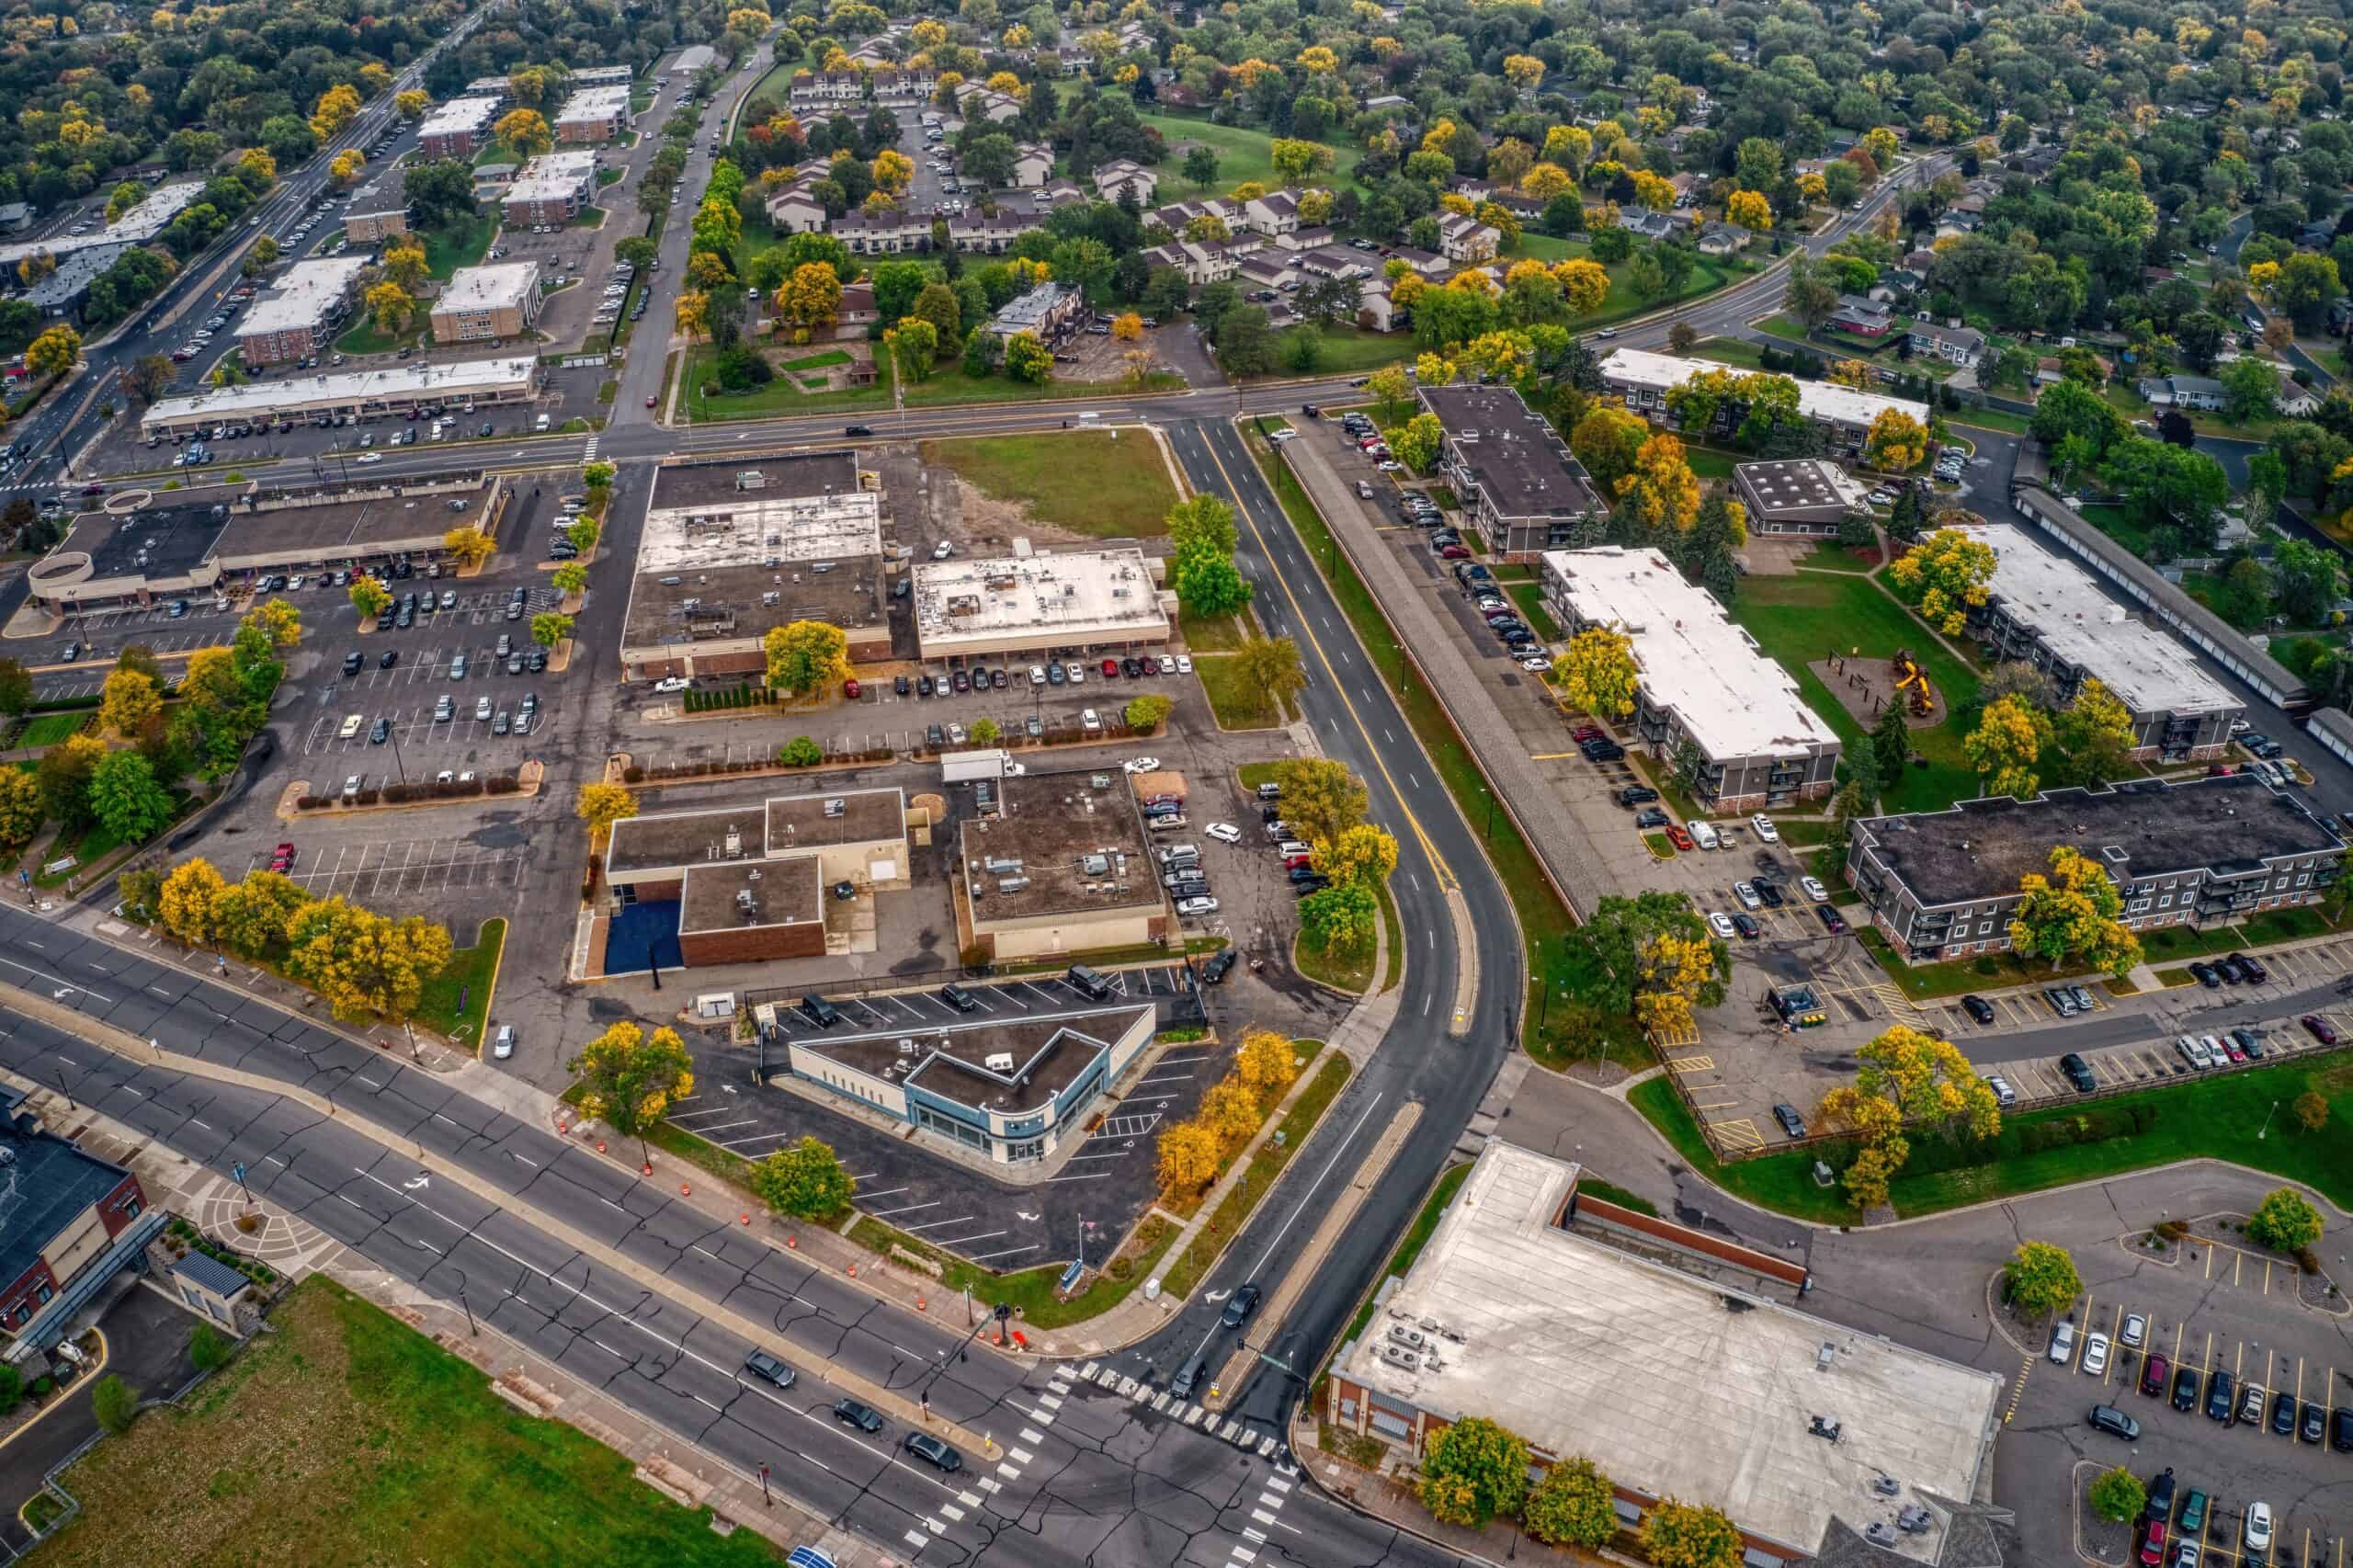
- Median home value: $289,400
- Homes worth over $1 million: 0.4%
- Homeownership rate: 69.2%
- Median household income: $82,271
- Total population: 84,951
28. Richfield
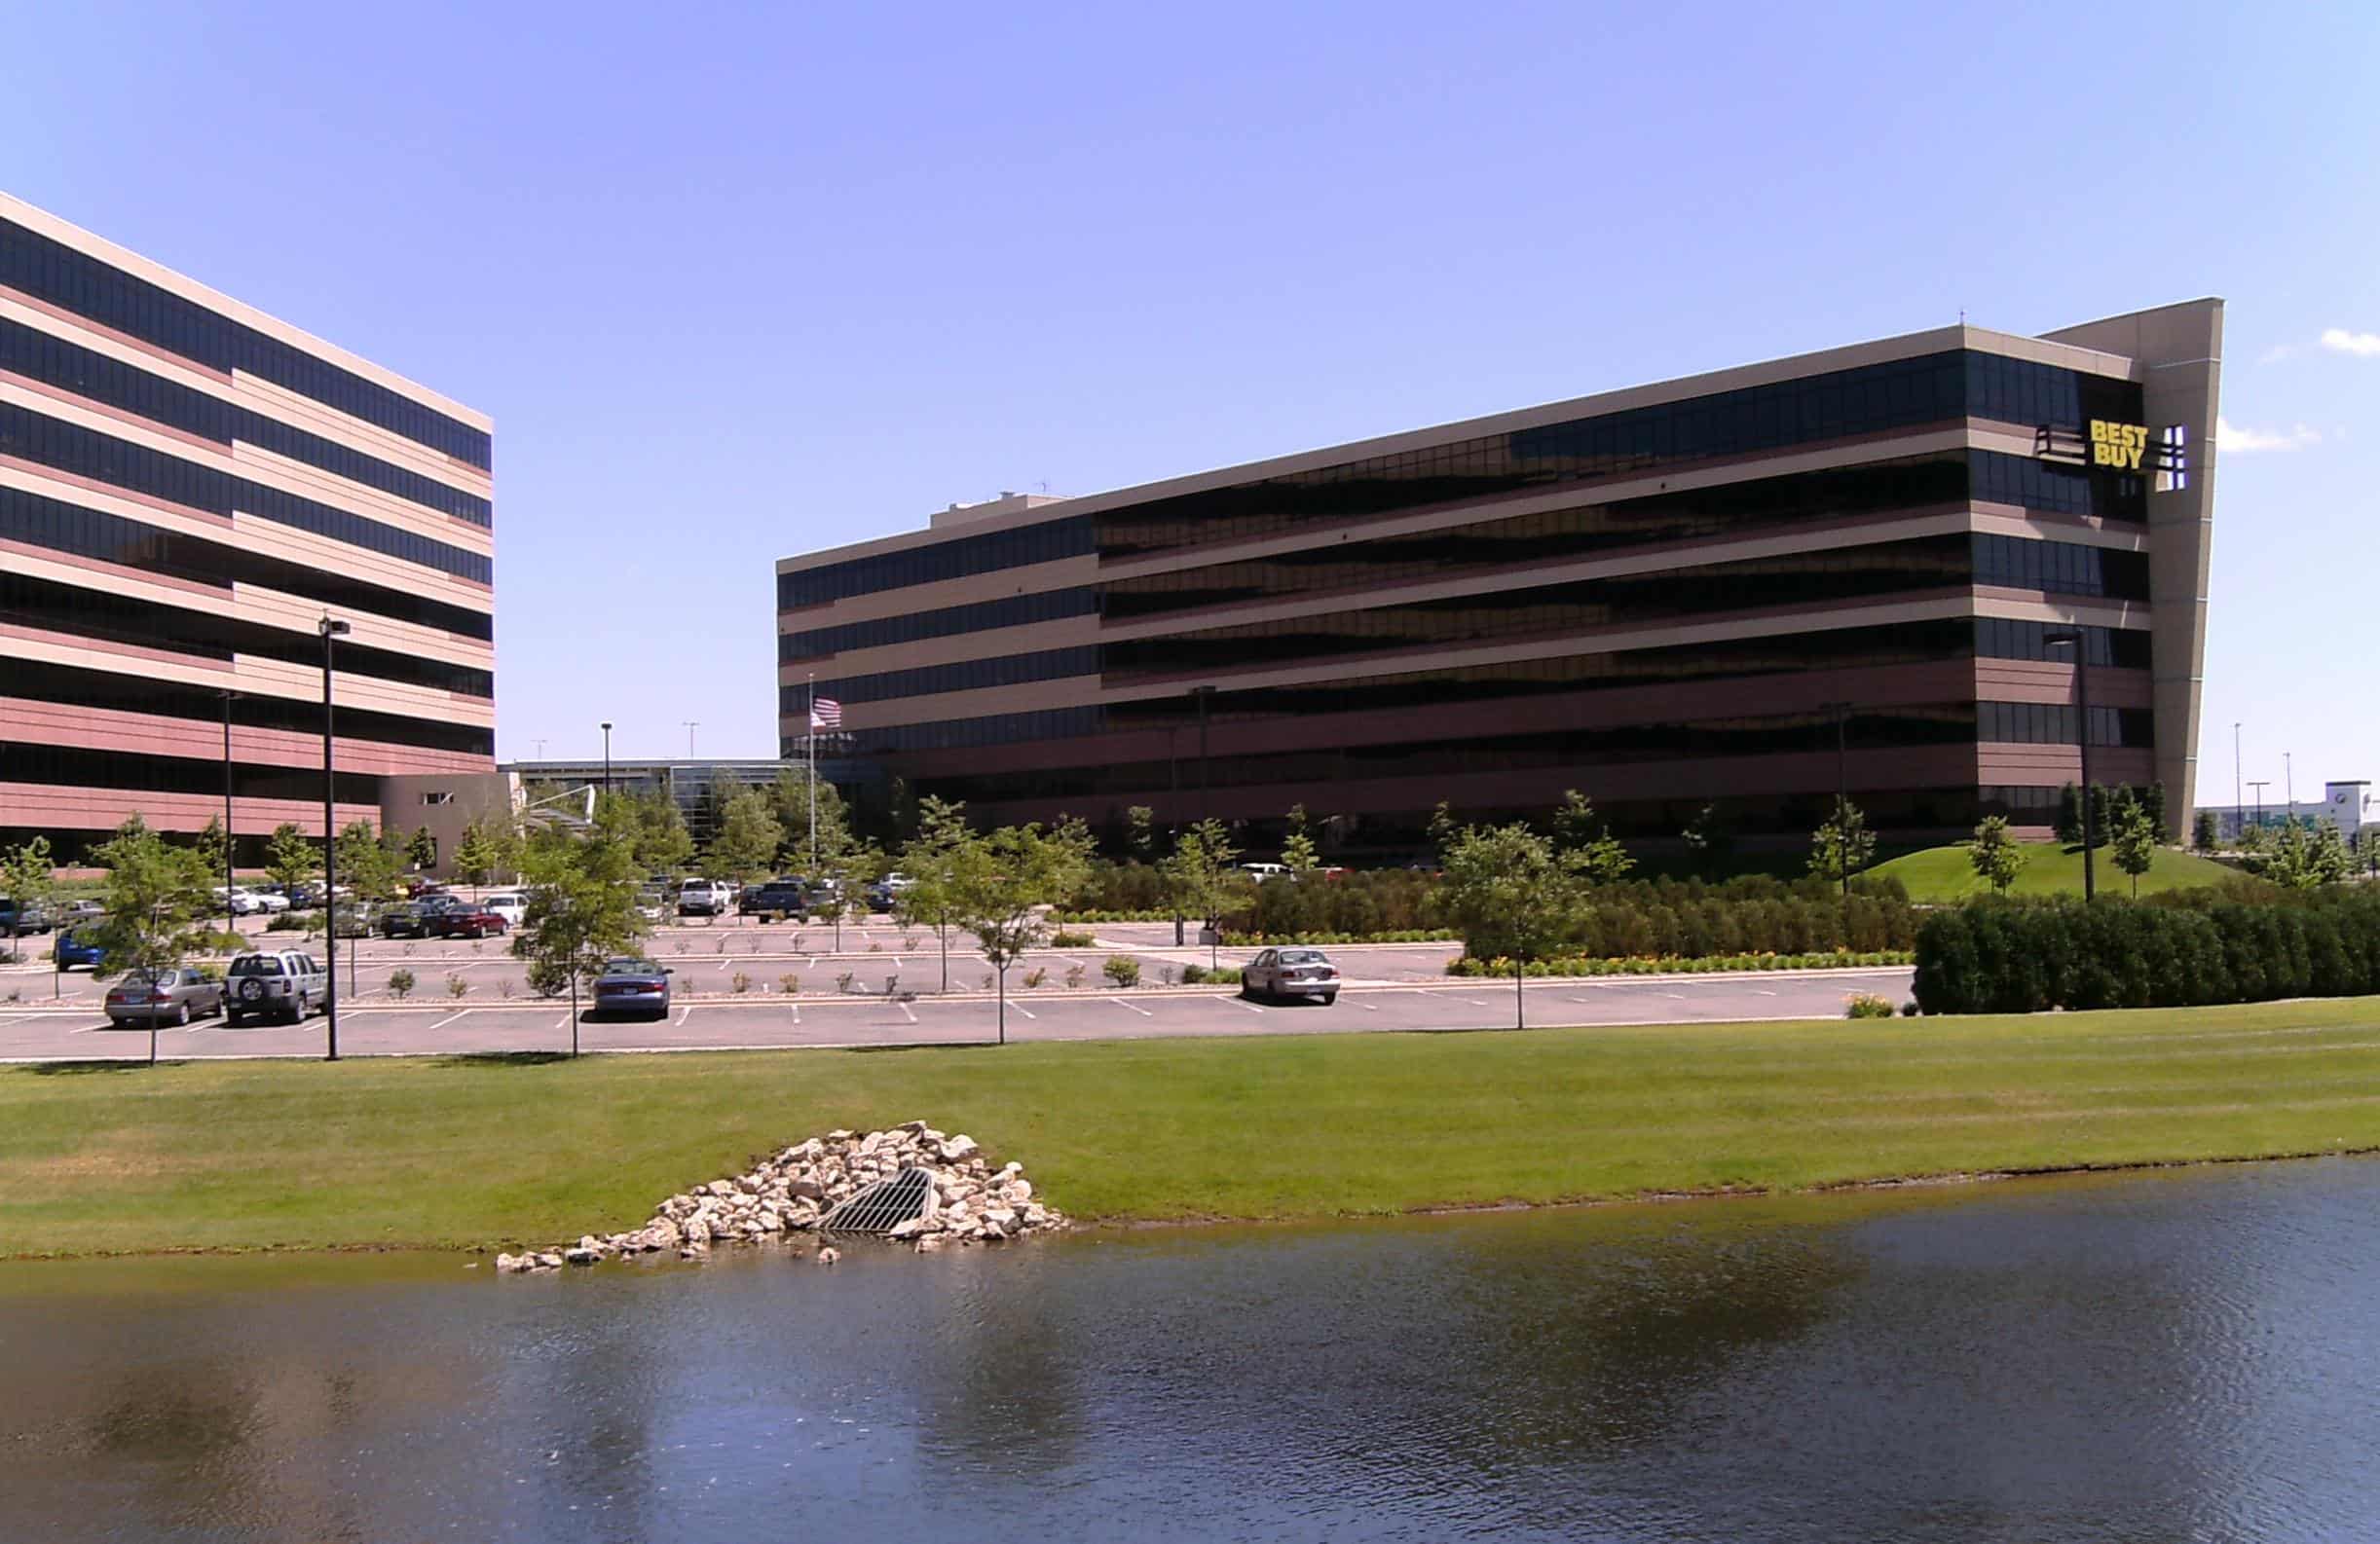
- Median home value: $294,000
- Homes worth over $1 million: 0.5%
- Homeownership rate: 61.7%
- Median household income: $80,712
- Total population: 36,809
27. Blaine
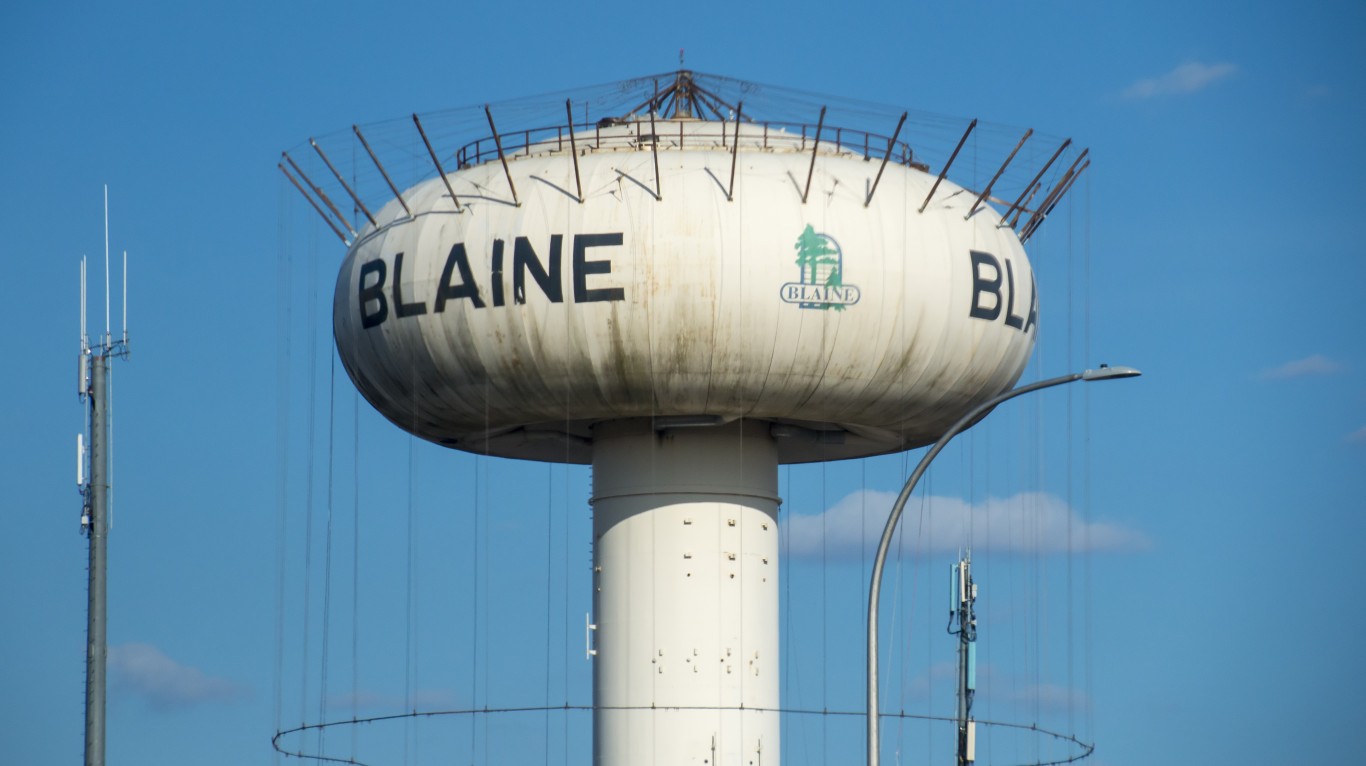
- Median home value: $303,800
- Homes worth over $1 million: 0.5%
- Homeownership rate: 85.3%
- Median household income: $100,659
- Total population: 70,047
26. Elk River
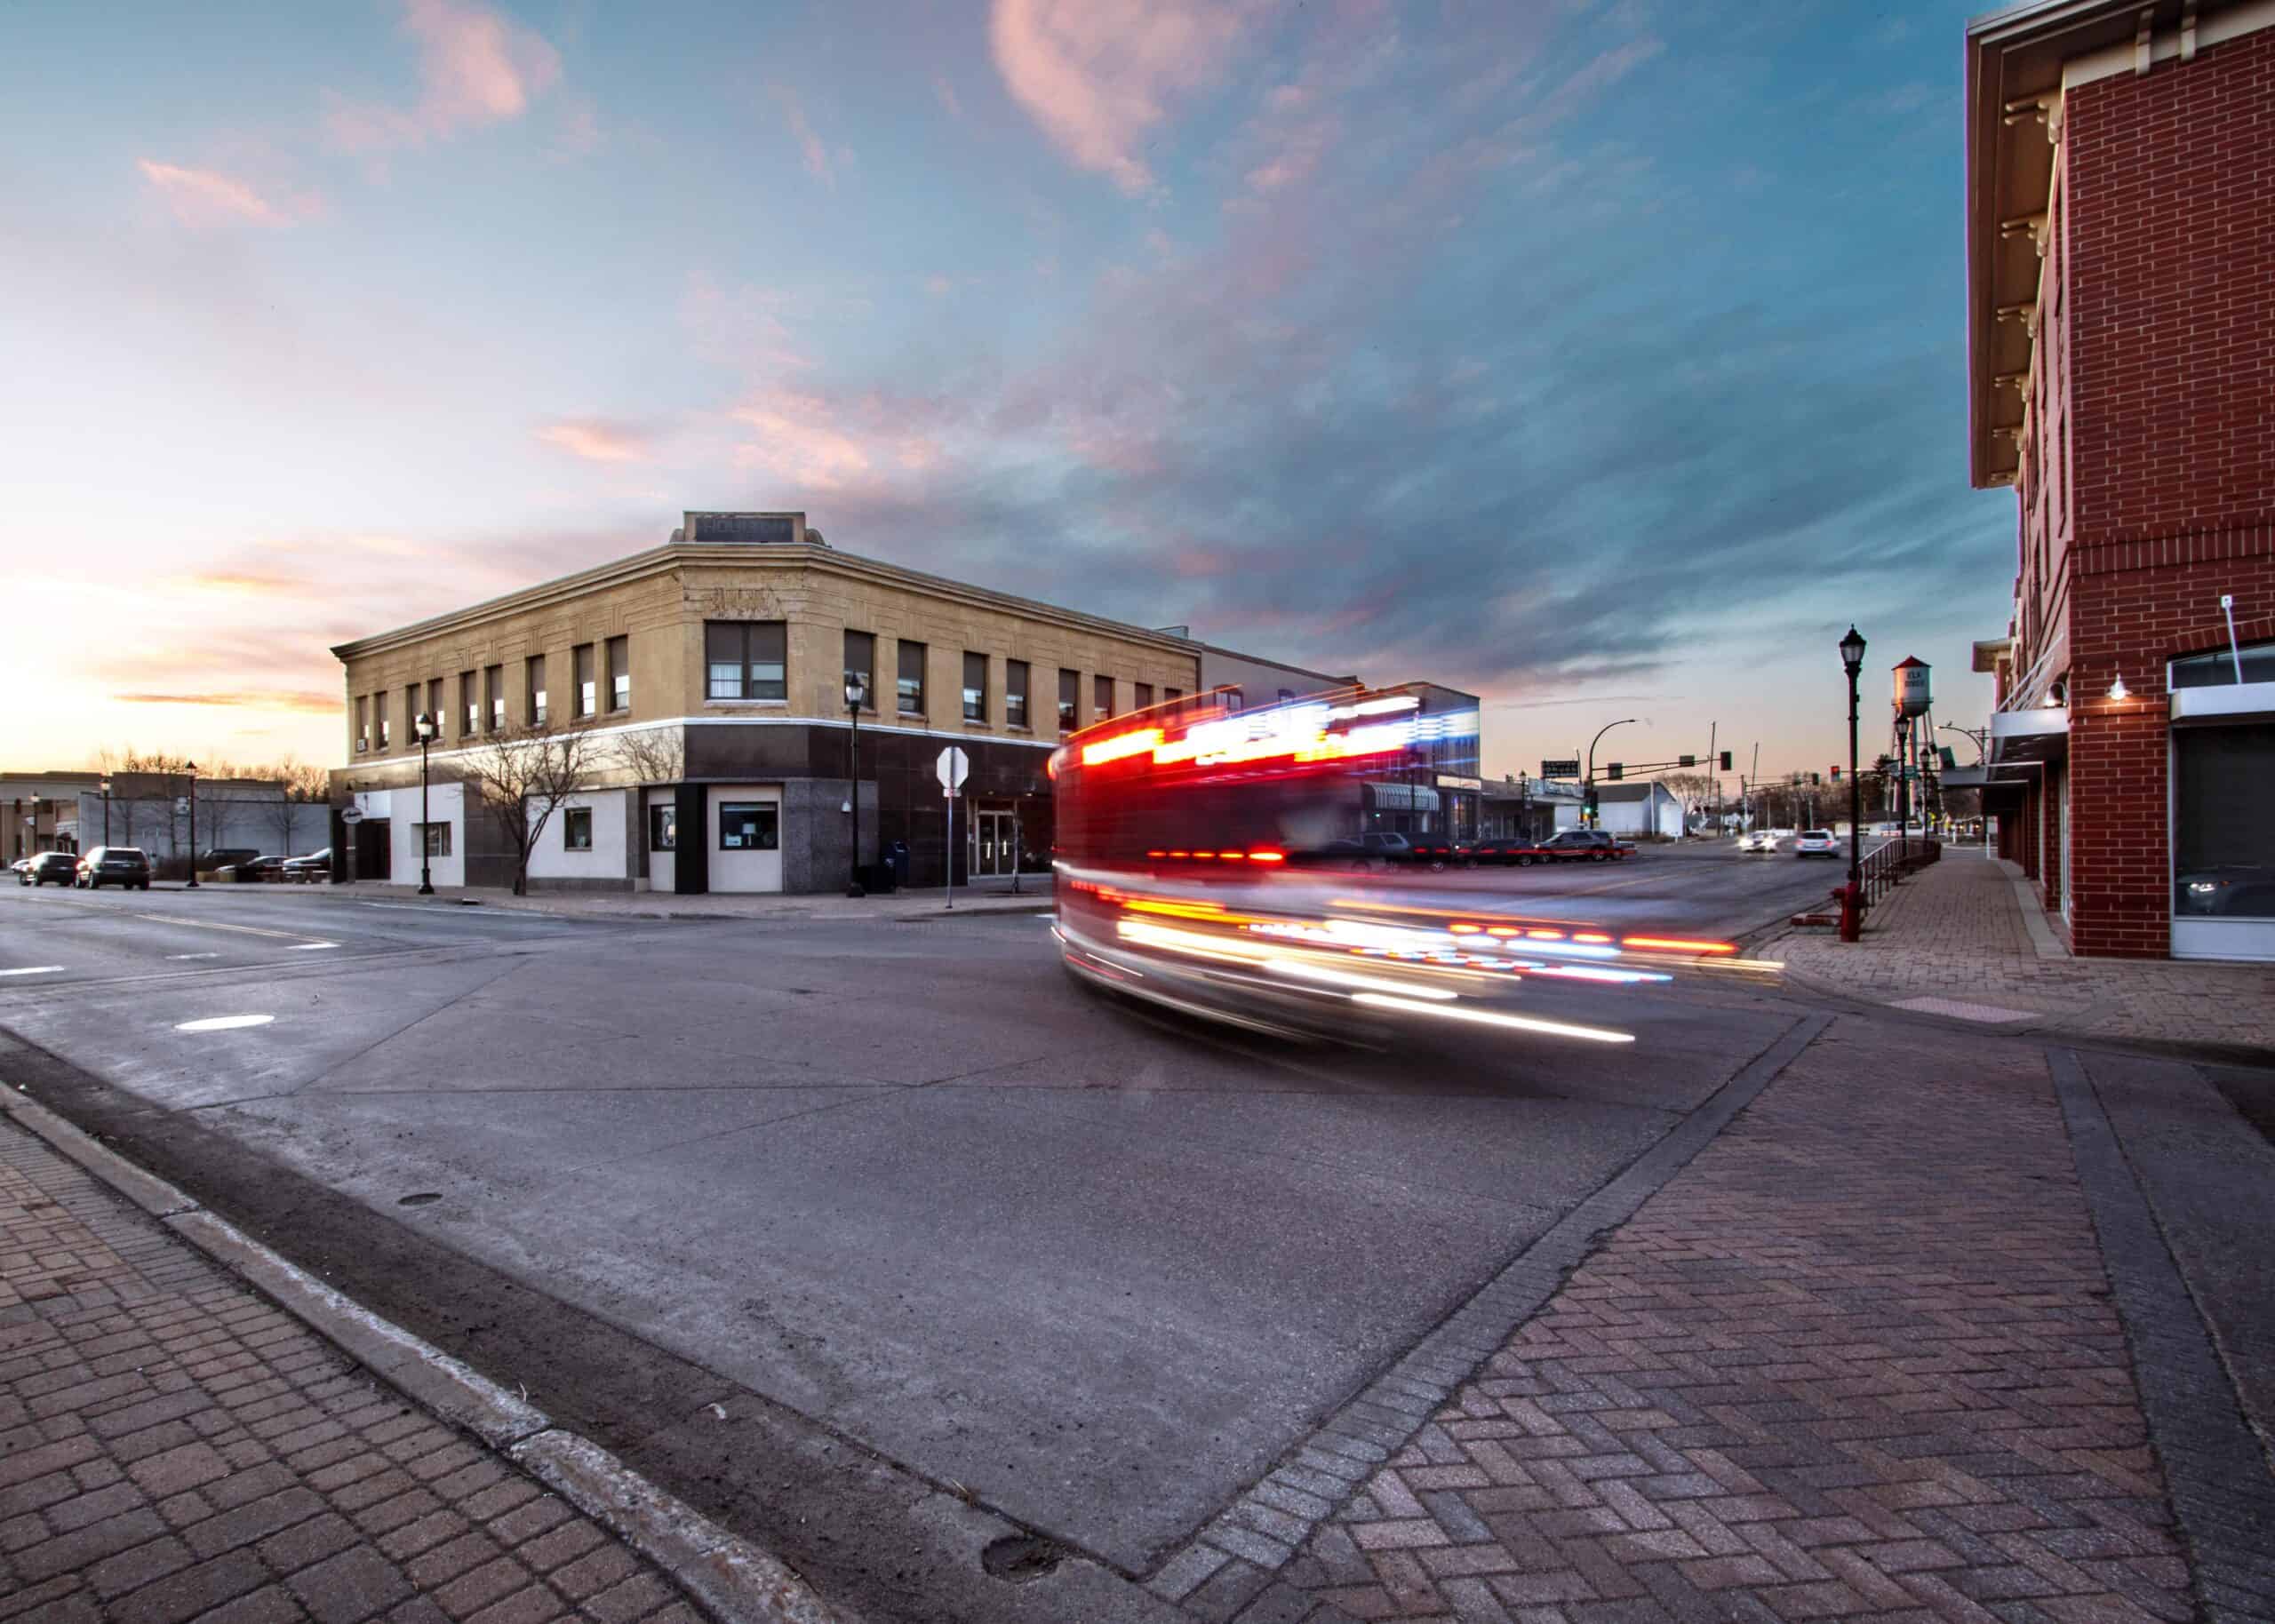
- Median home value: $305,700
- Homes worth over $1 million: 0.8%
- Homeownership rate: 78.5%
- Median household income: $95,597
- Total population: 25,936
25. Burnsville
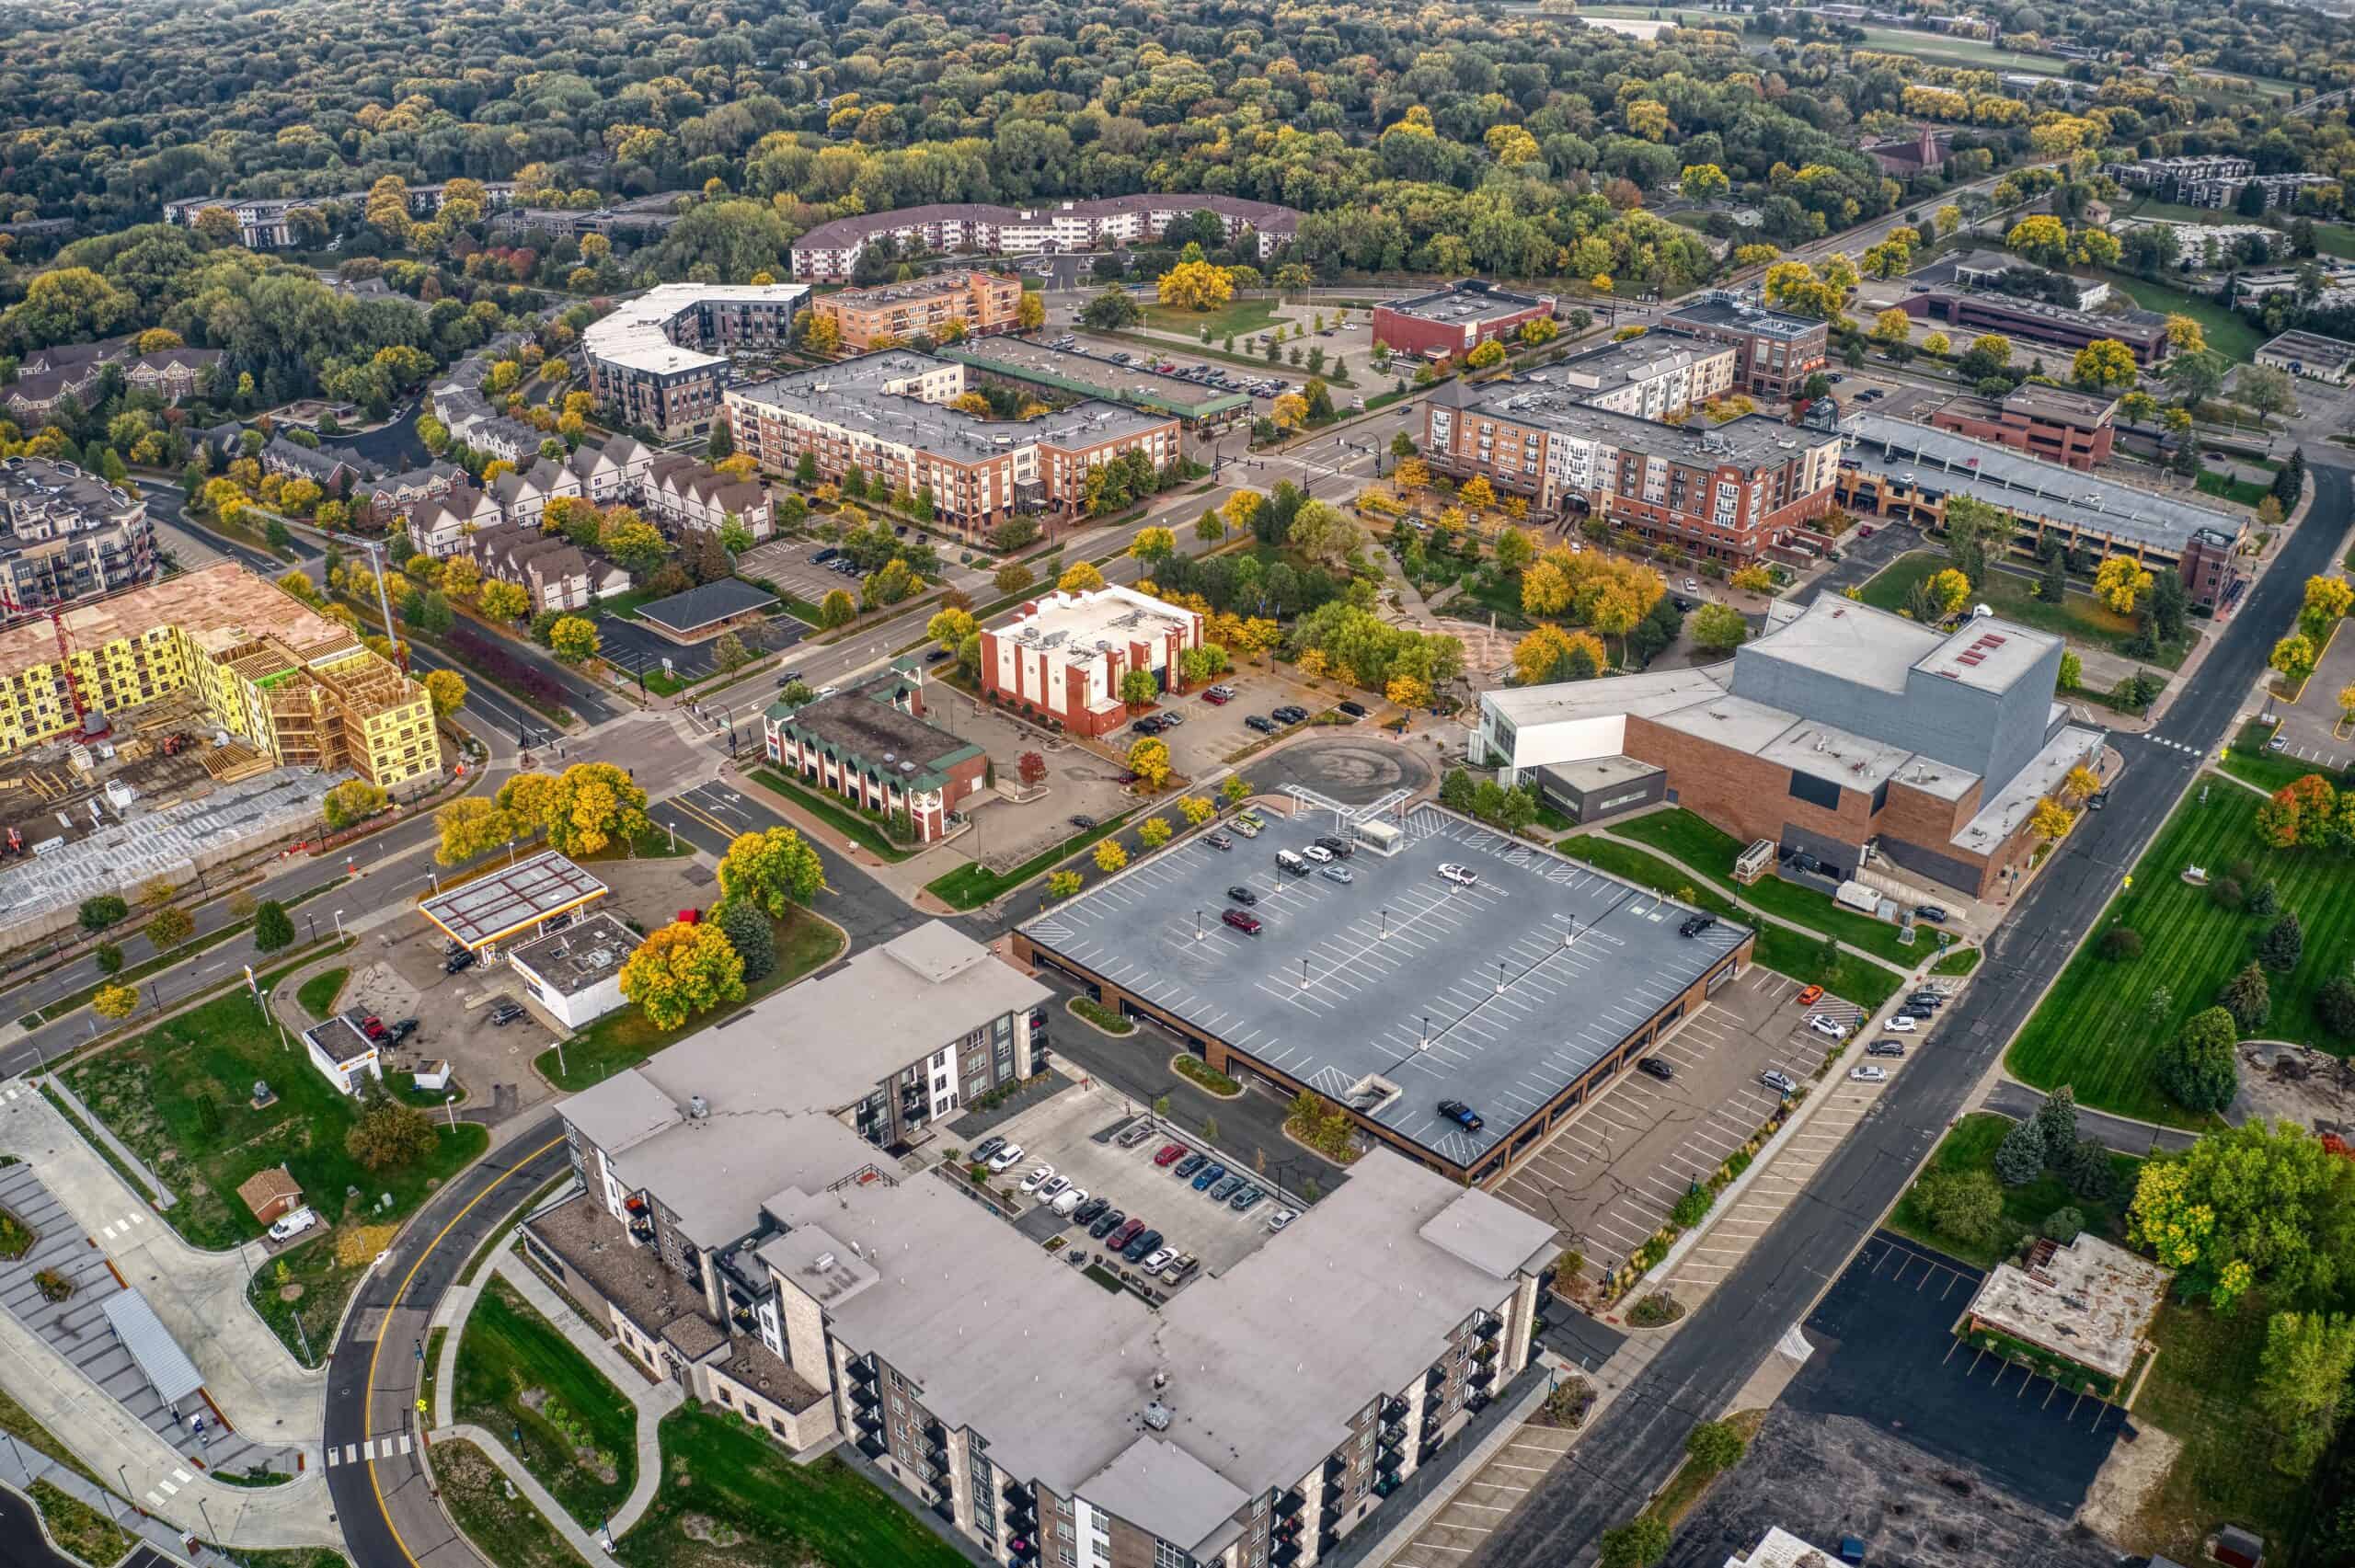
- Median home value: $315,700
- Homes worth over $1 million: 0.6%
- Homeownership rate: 68.2%
- Median household income: $85,801
- Total population: 64,075
24. Roseville
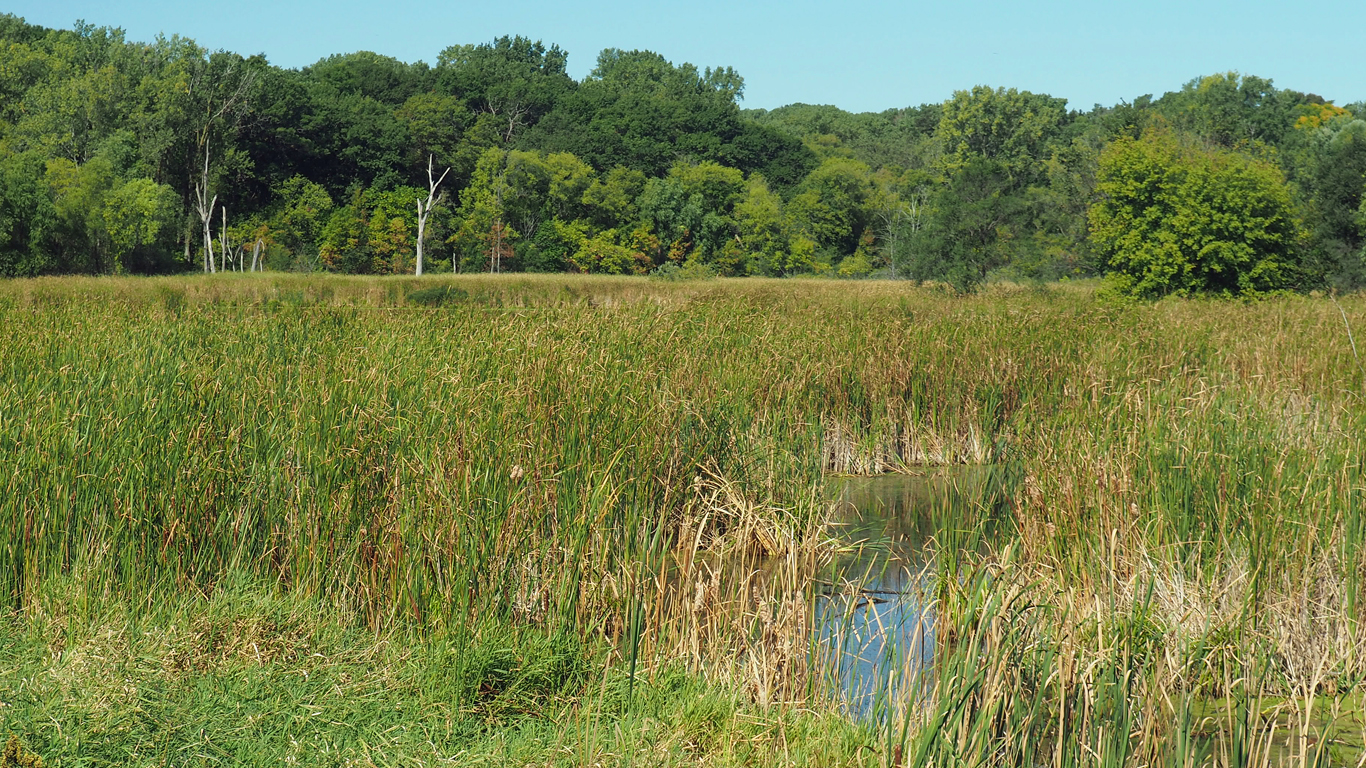
- Median home value: $318,400
- Homes worth over $1 million: 1.6%
- Homeownership rate: 69.1%
- Median household income: $87,702
- Total population: 36,066
23. Bloomington
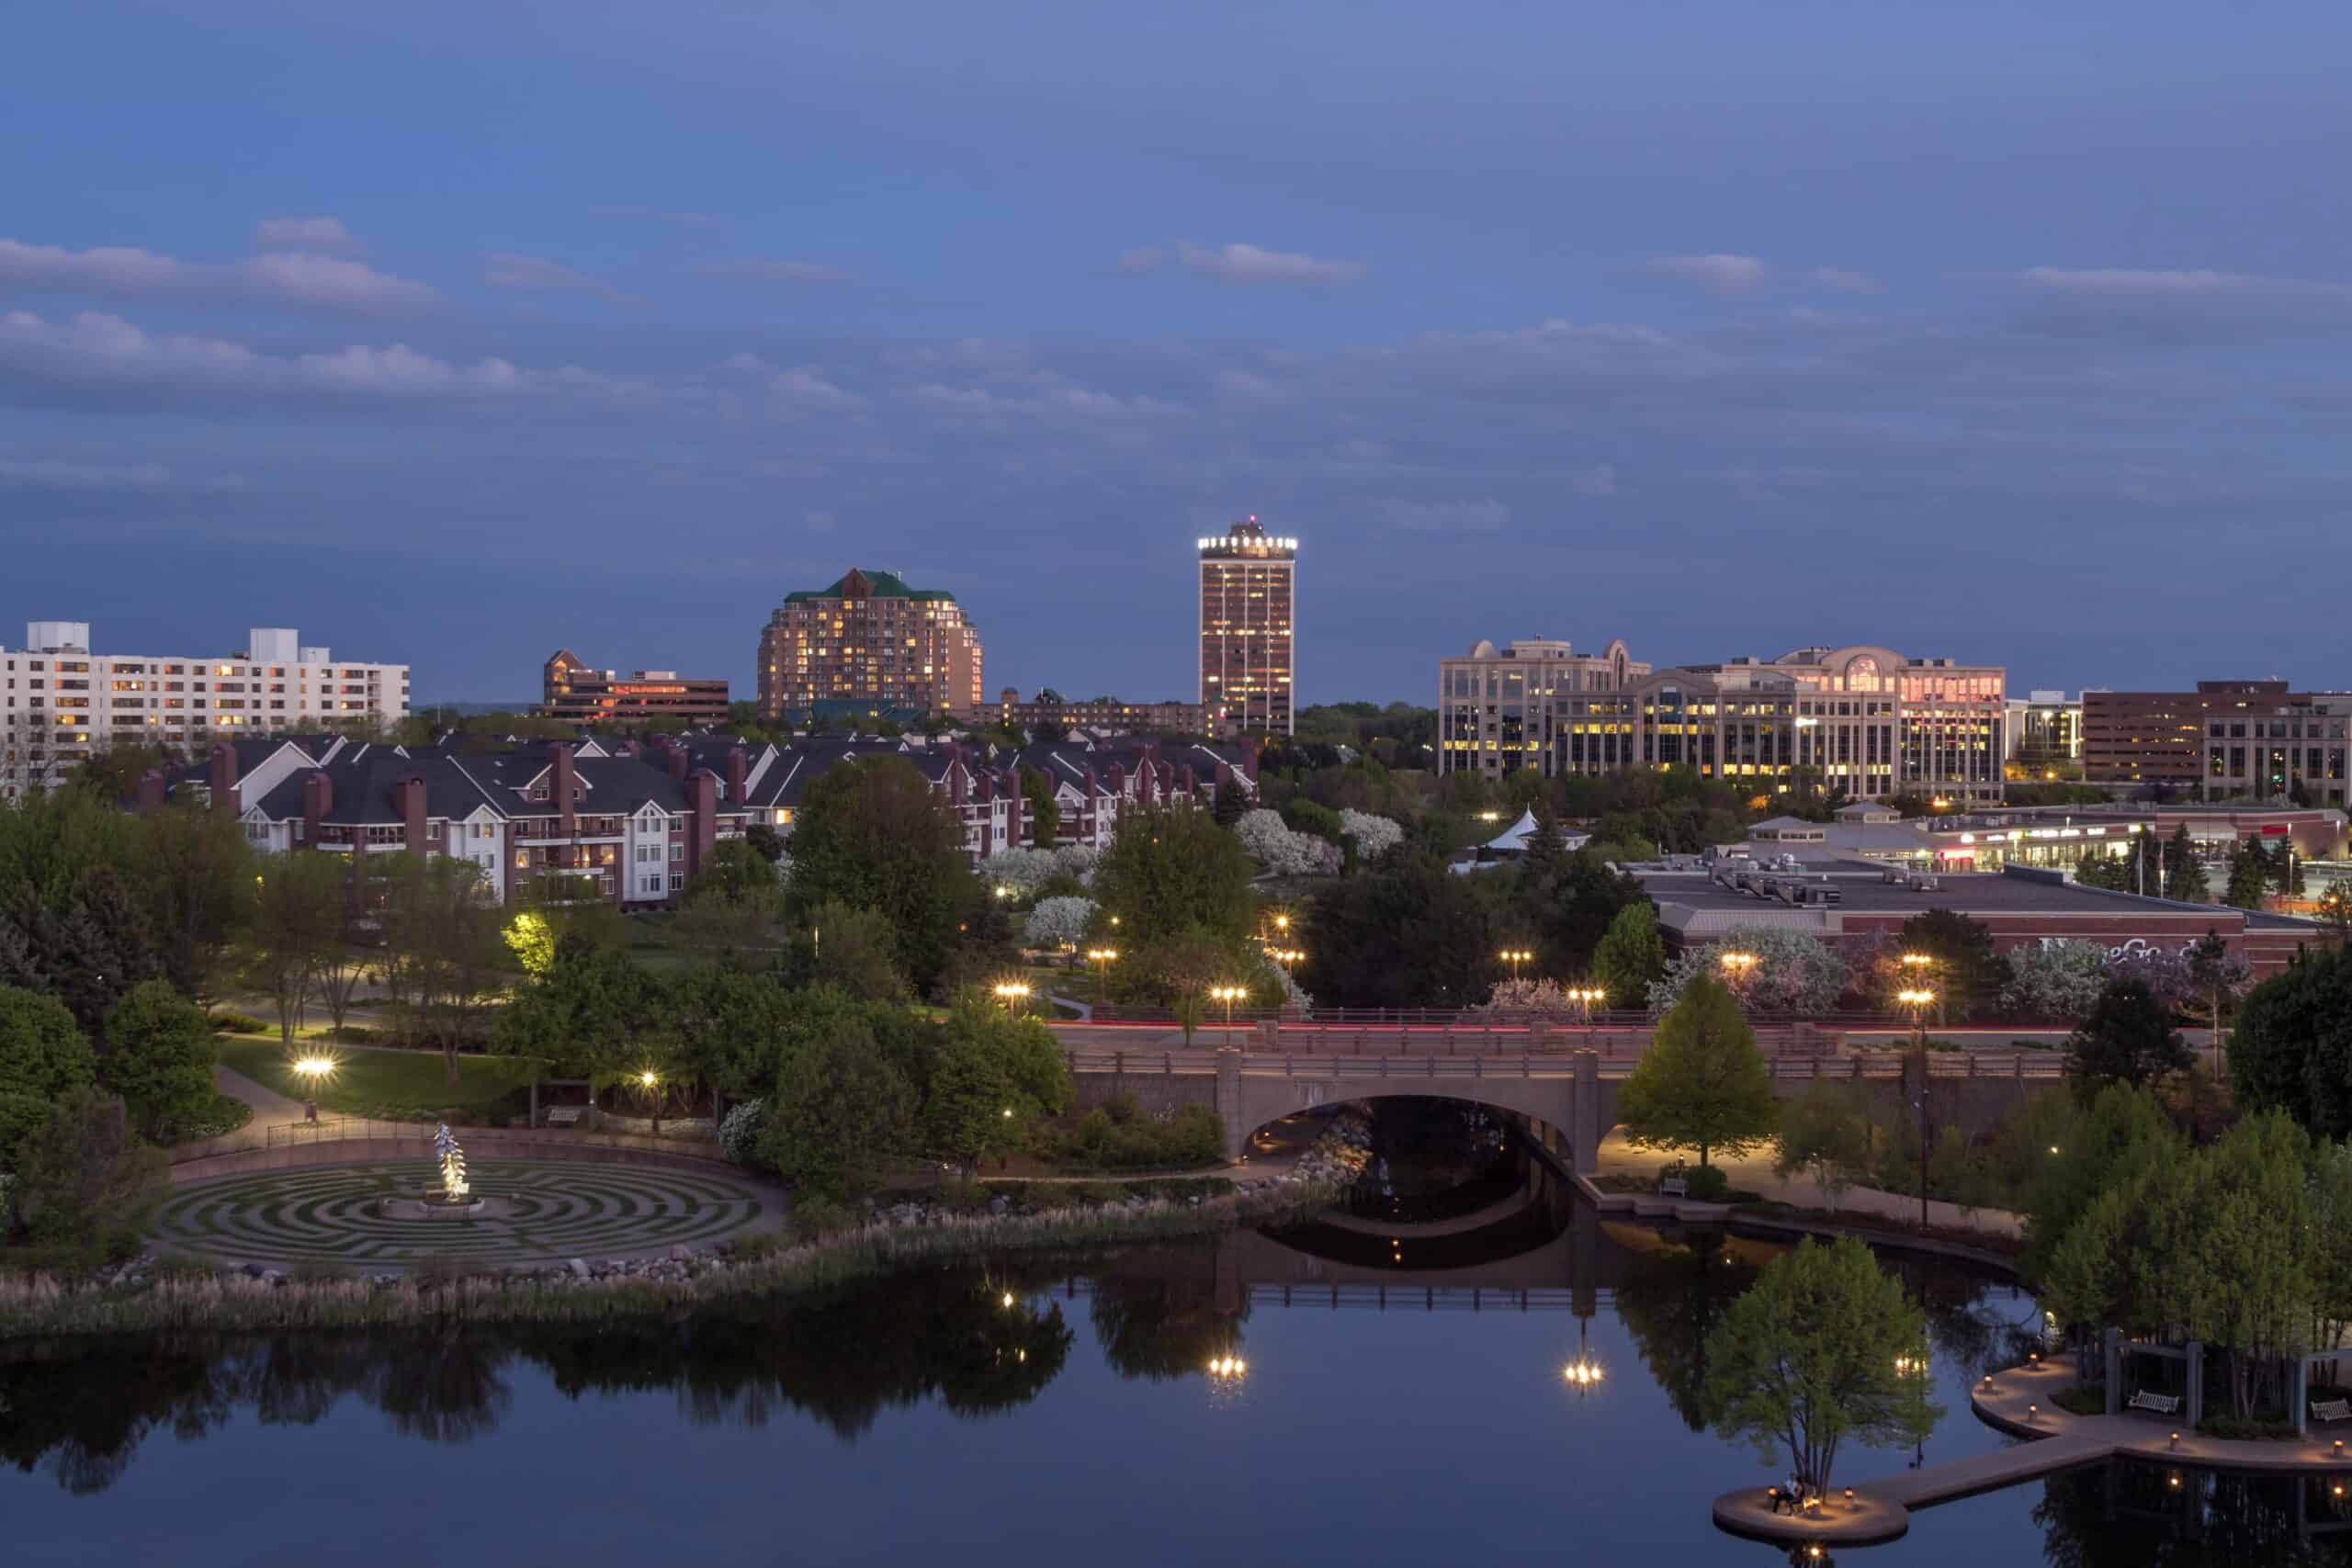
- Median home value: $327,100
- Homes worth over $1 million: 0.8%
- Homeownership rate: 67.0%
- Median household income: $87,381
- Total population: 89,244
22. Minneapolis
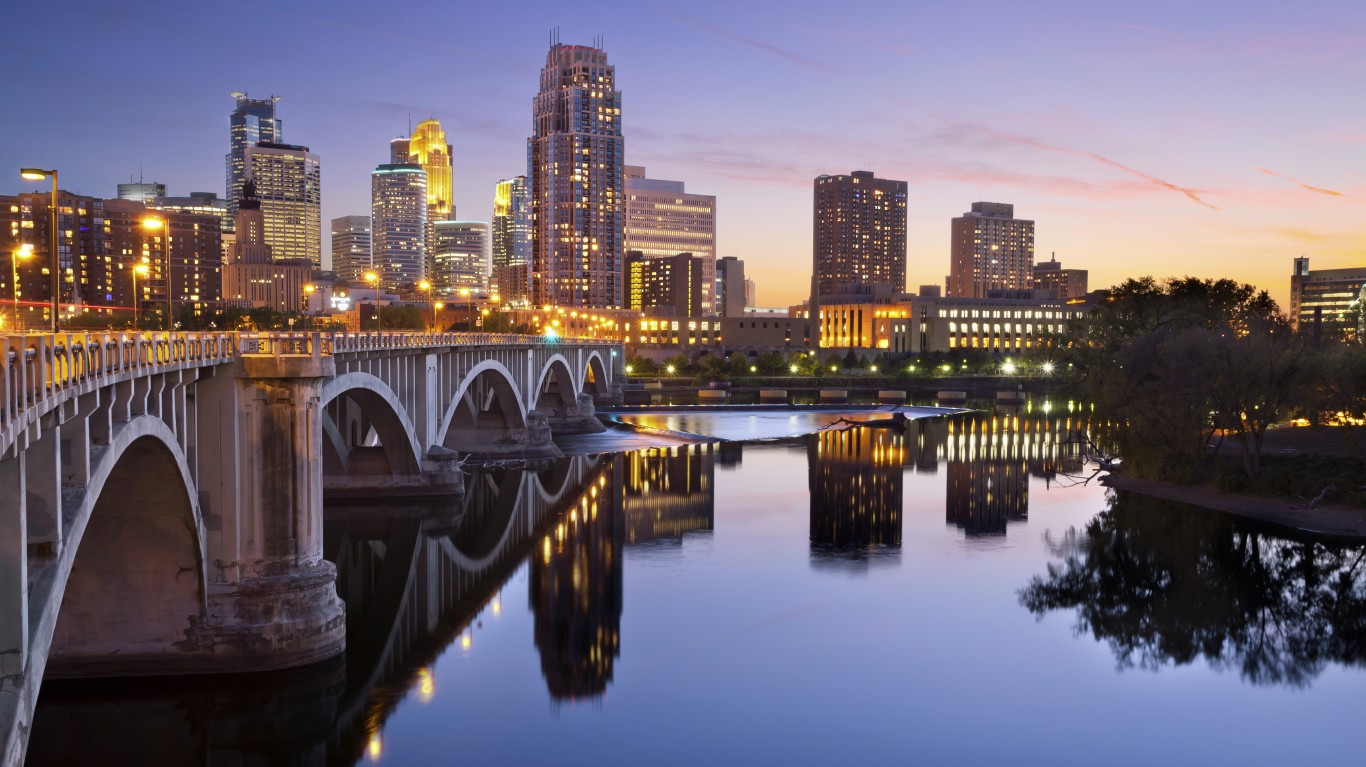
- Median home value: $328,700
- Homes worth over $1 million: 3.6%
- Homeownership rate: 48.1%
- Median household income: $76,332
- Total population: 426,877
21. Apple Valley

- Median home value: $333,300
- Homes worth over $1 million: 0.4%
- Homeownership rate: 75.6%
- Median household income: $97,588
- Total population: 55,594
20. Ramsey
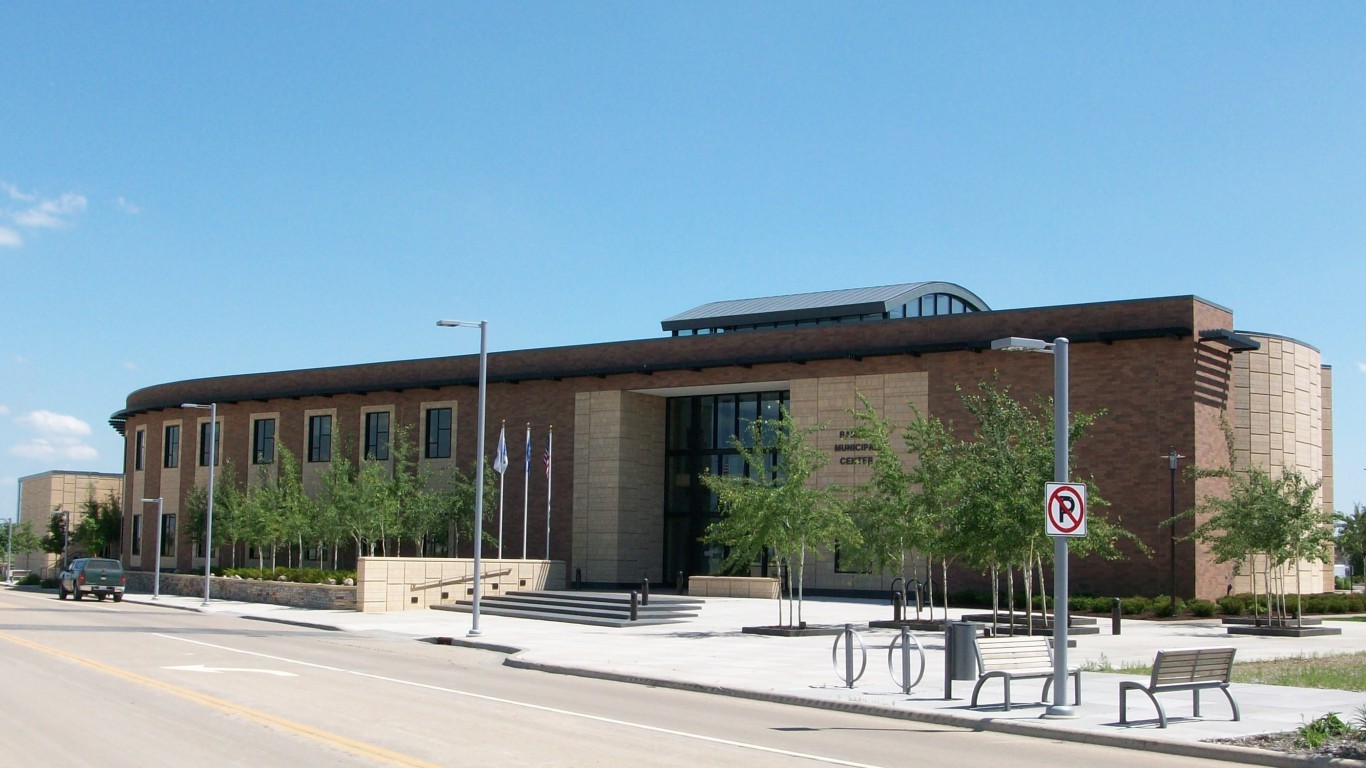
- Median home value: $334,200
- Homes worth over $1 million: 0.7%
- Homeownership rate: 84.8%
- Median household income: $110,212
- Total population: 27,774
19. Cottage Grove
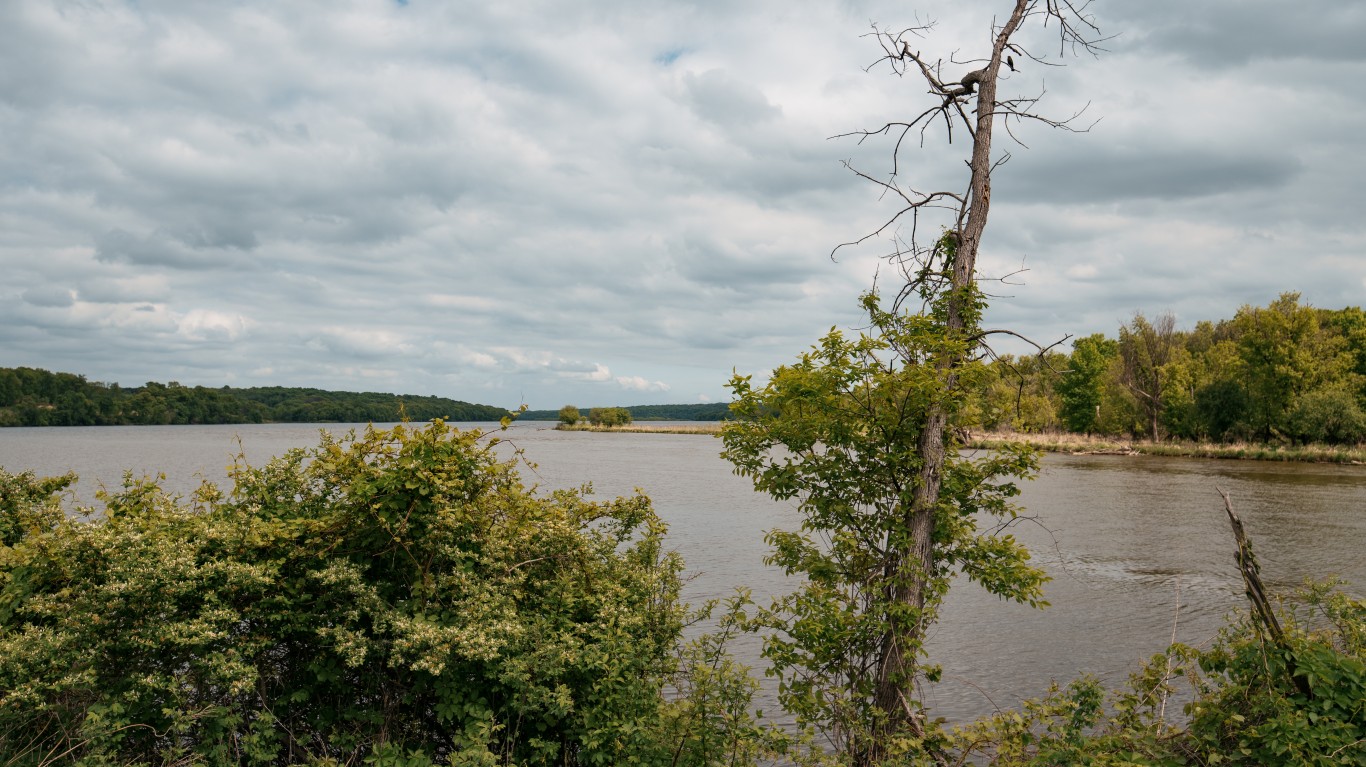
- Median home value: $337,000
- Homes worth over $1 million: 0.8%
- Homeownership rate: 88.1%
- Median household income: $117,673
- Total population: 39,274
18. Inver Grove Heights

- Median home value: $337,200
- Homes worth over $1 million: 0.5%
- Homeownership rate: 73.7%
- Median household income: $98,719
- Total population: 35,673
17. Shakopee
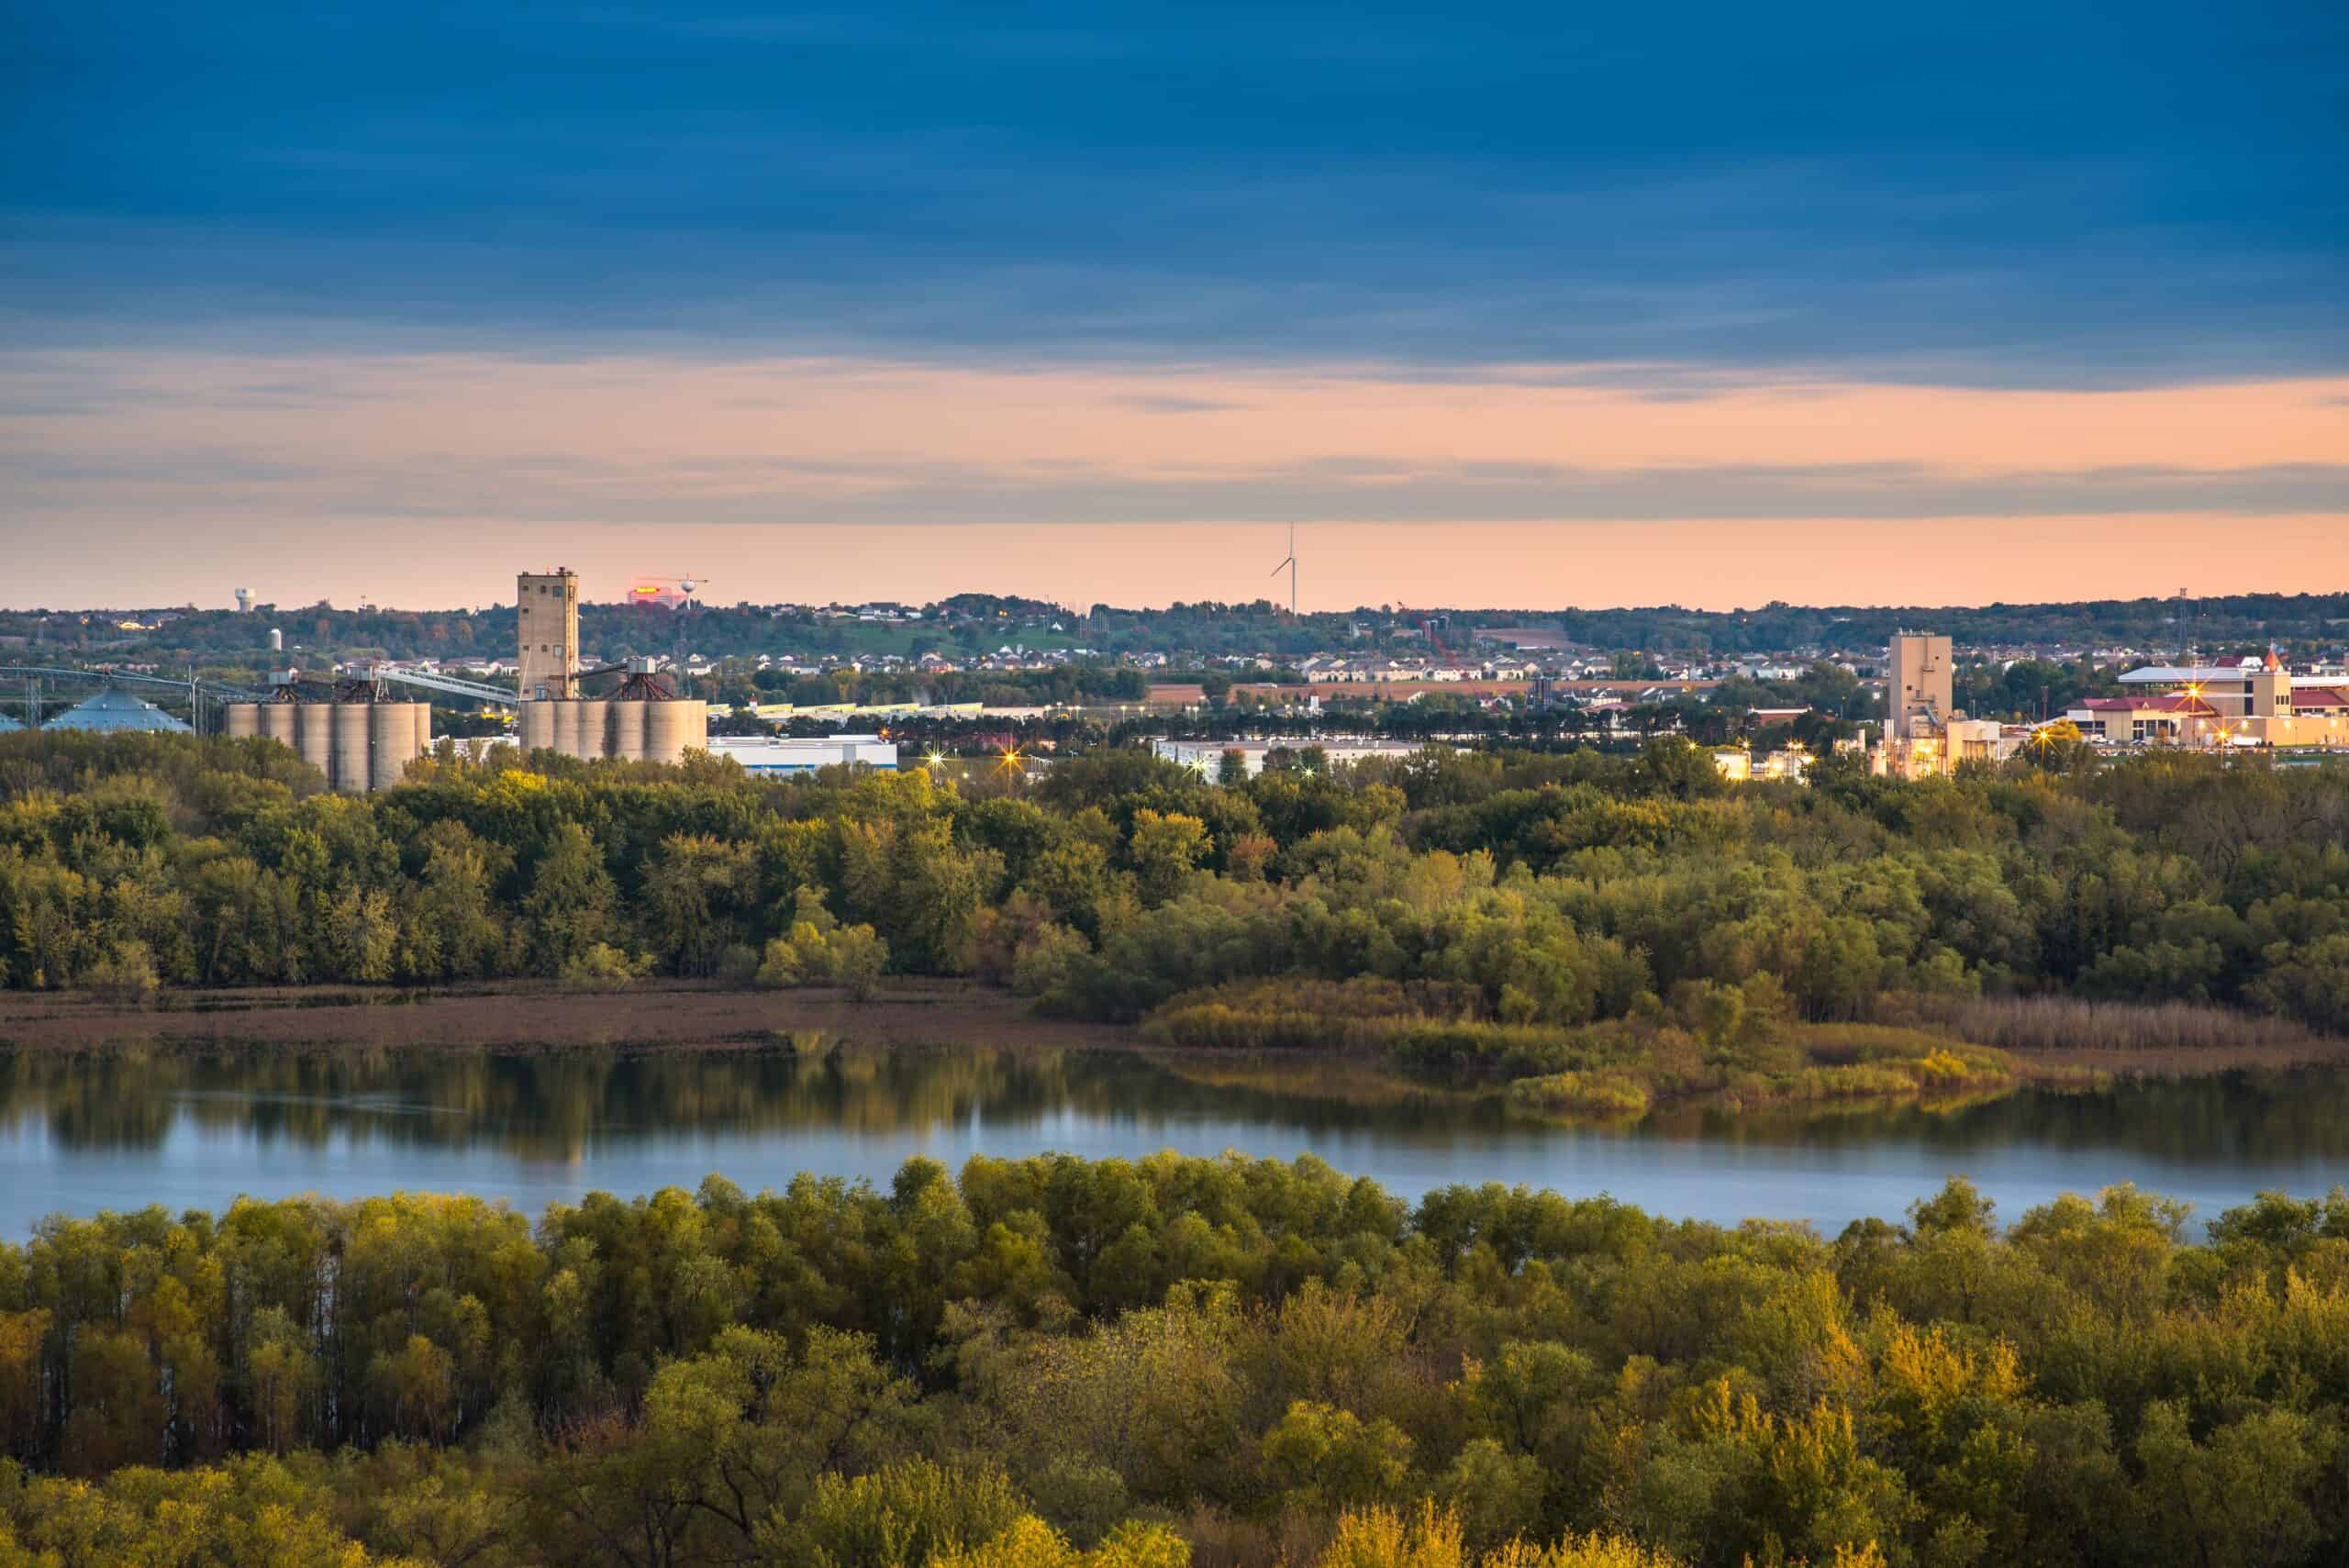
- Median home value: $348,300
- Homes worth over $1 million: 1.2%
- Homeownership rate: 73.1%
- Median household income: $103,924
- Total population: 44,135
16. Shoreview
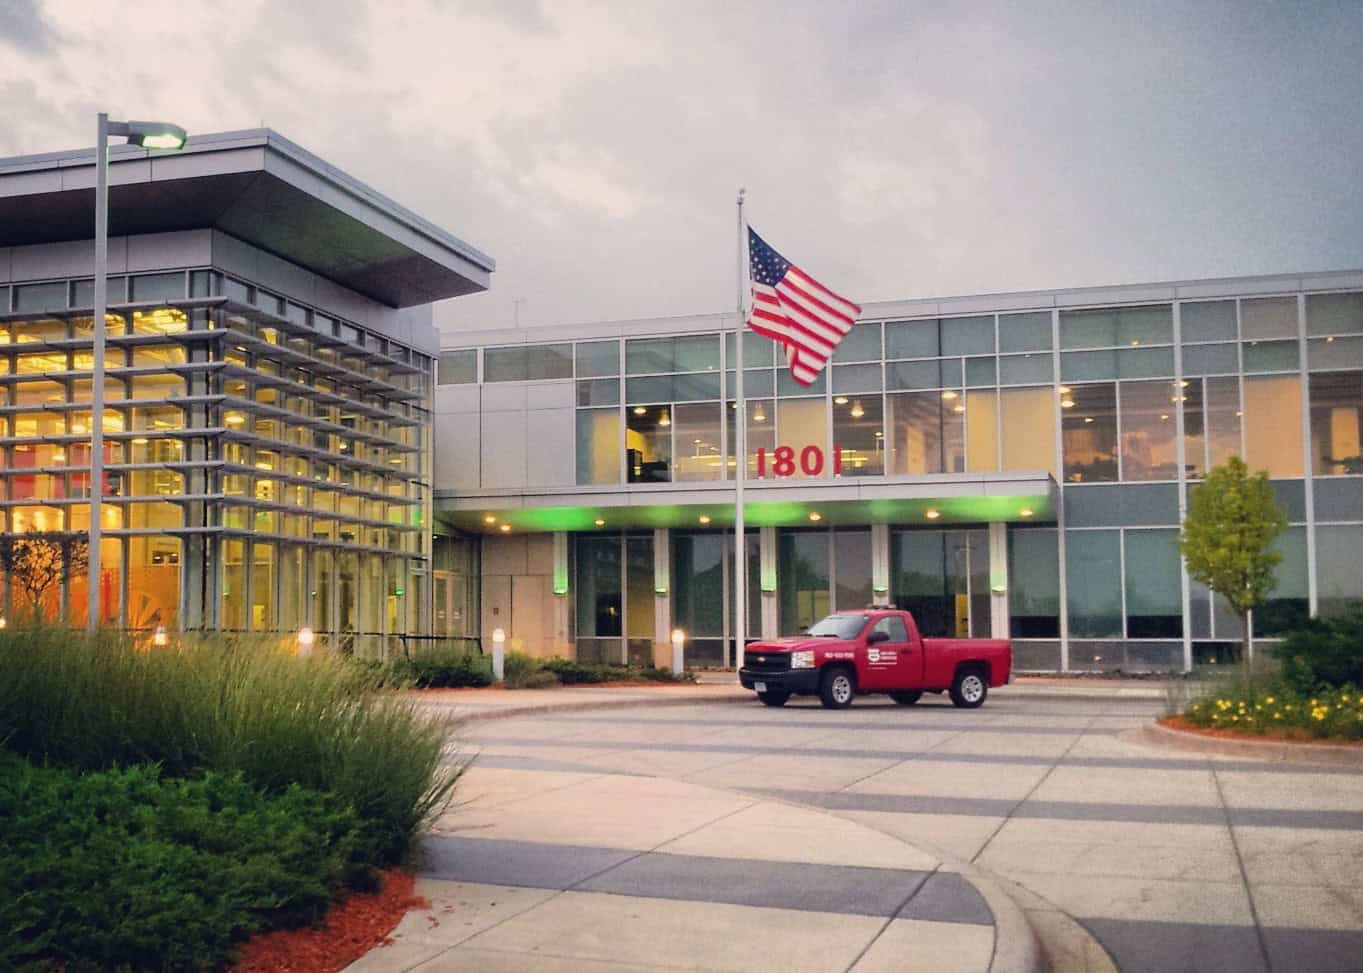
- Median home value: $349,300
- Homes worth over $1 million: 1.2%
- Homeownership rate: 83.4%
- Median household income: $106,153
- Total population: 26,846
15. St. Louis Park
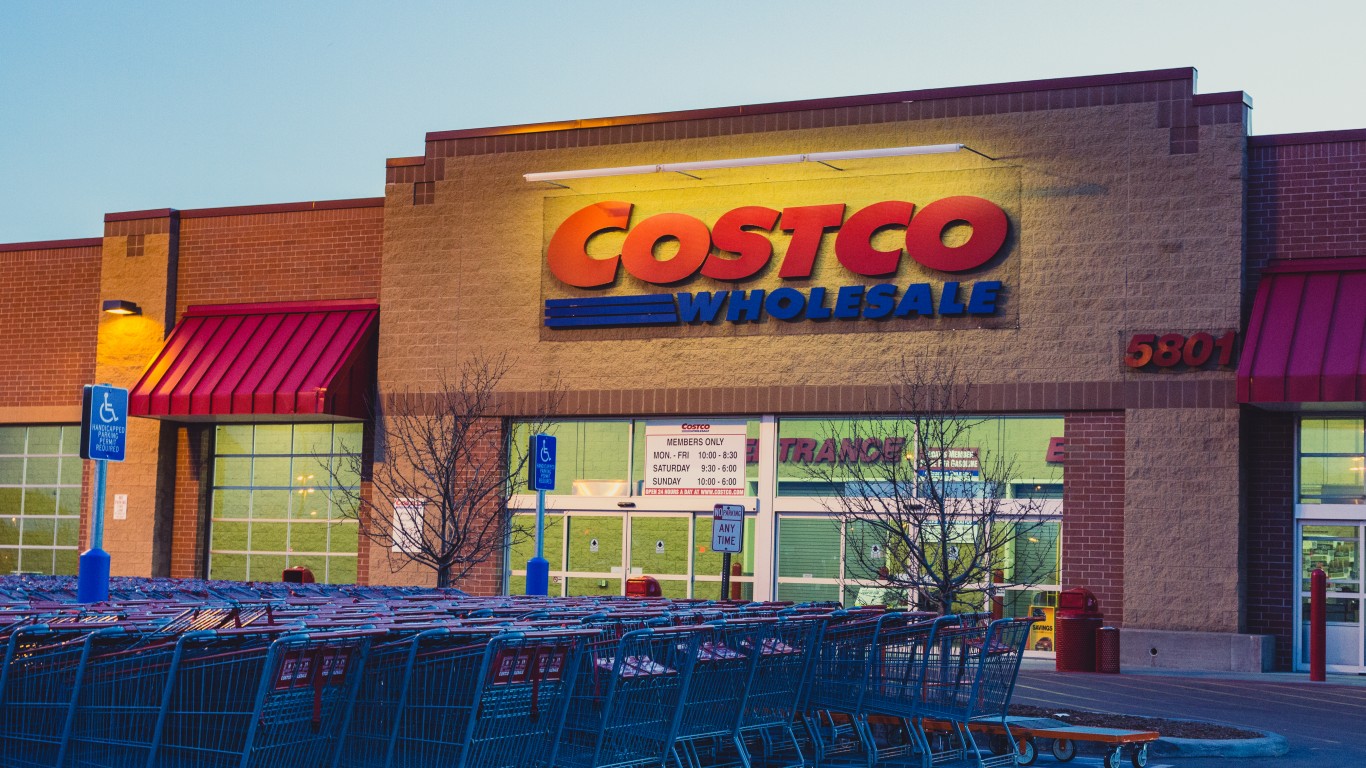
- Median home value: $357,900
- Homes worth over $1 million: 1.5%
- Homeownership rate: 58.7%
- Median household income: $94,263
- Total population: 49,500
14. Chaska
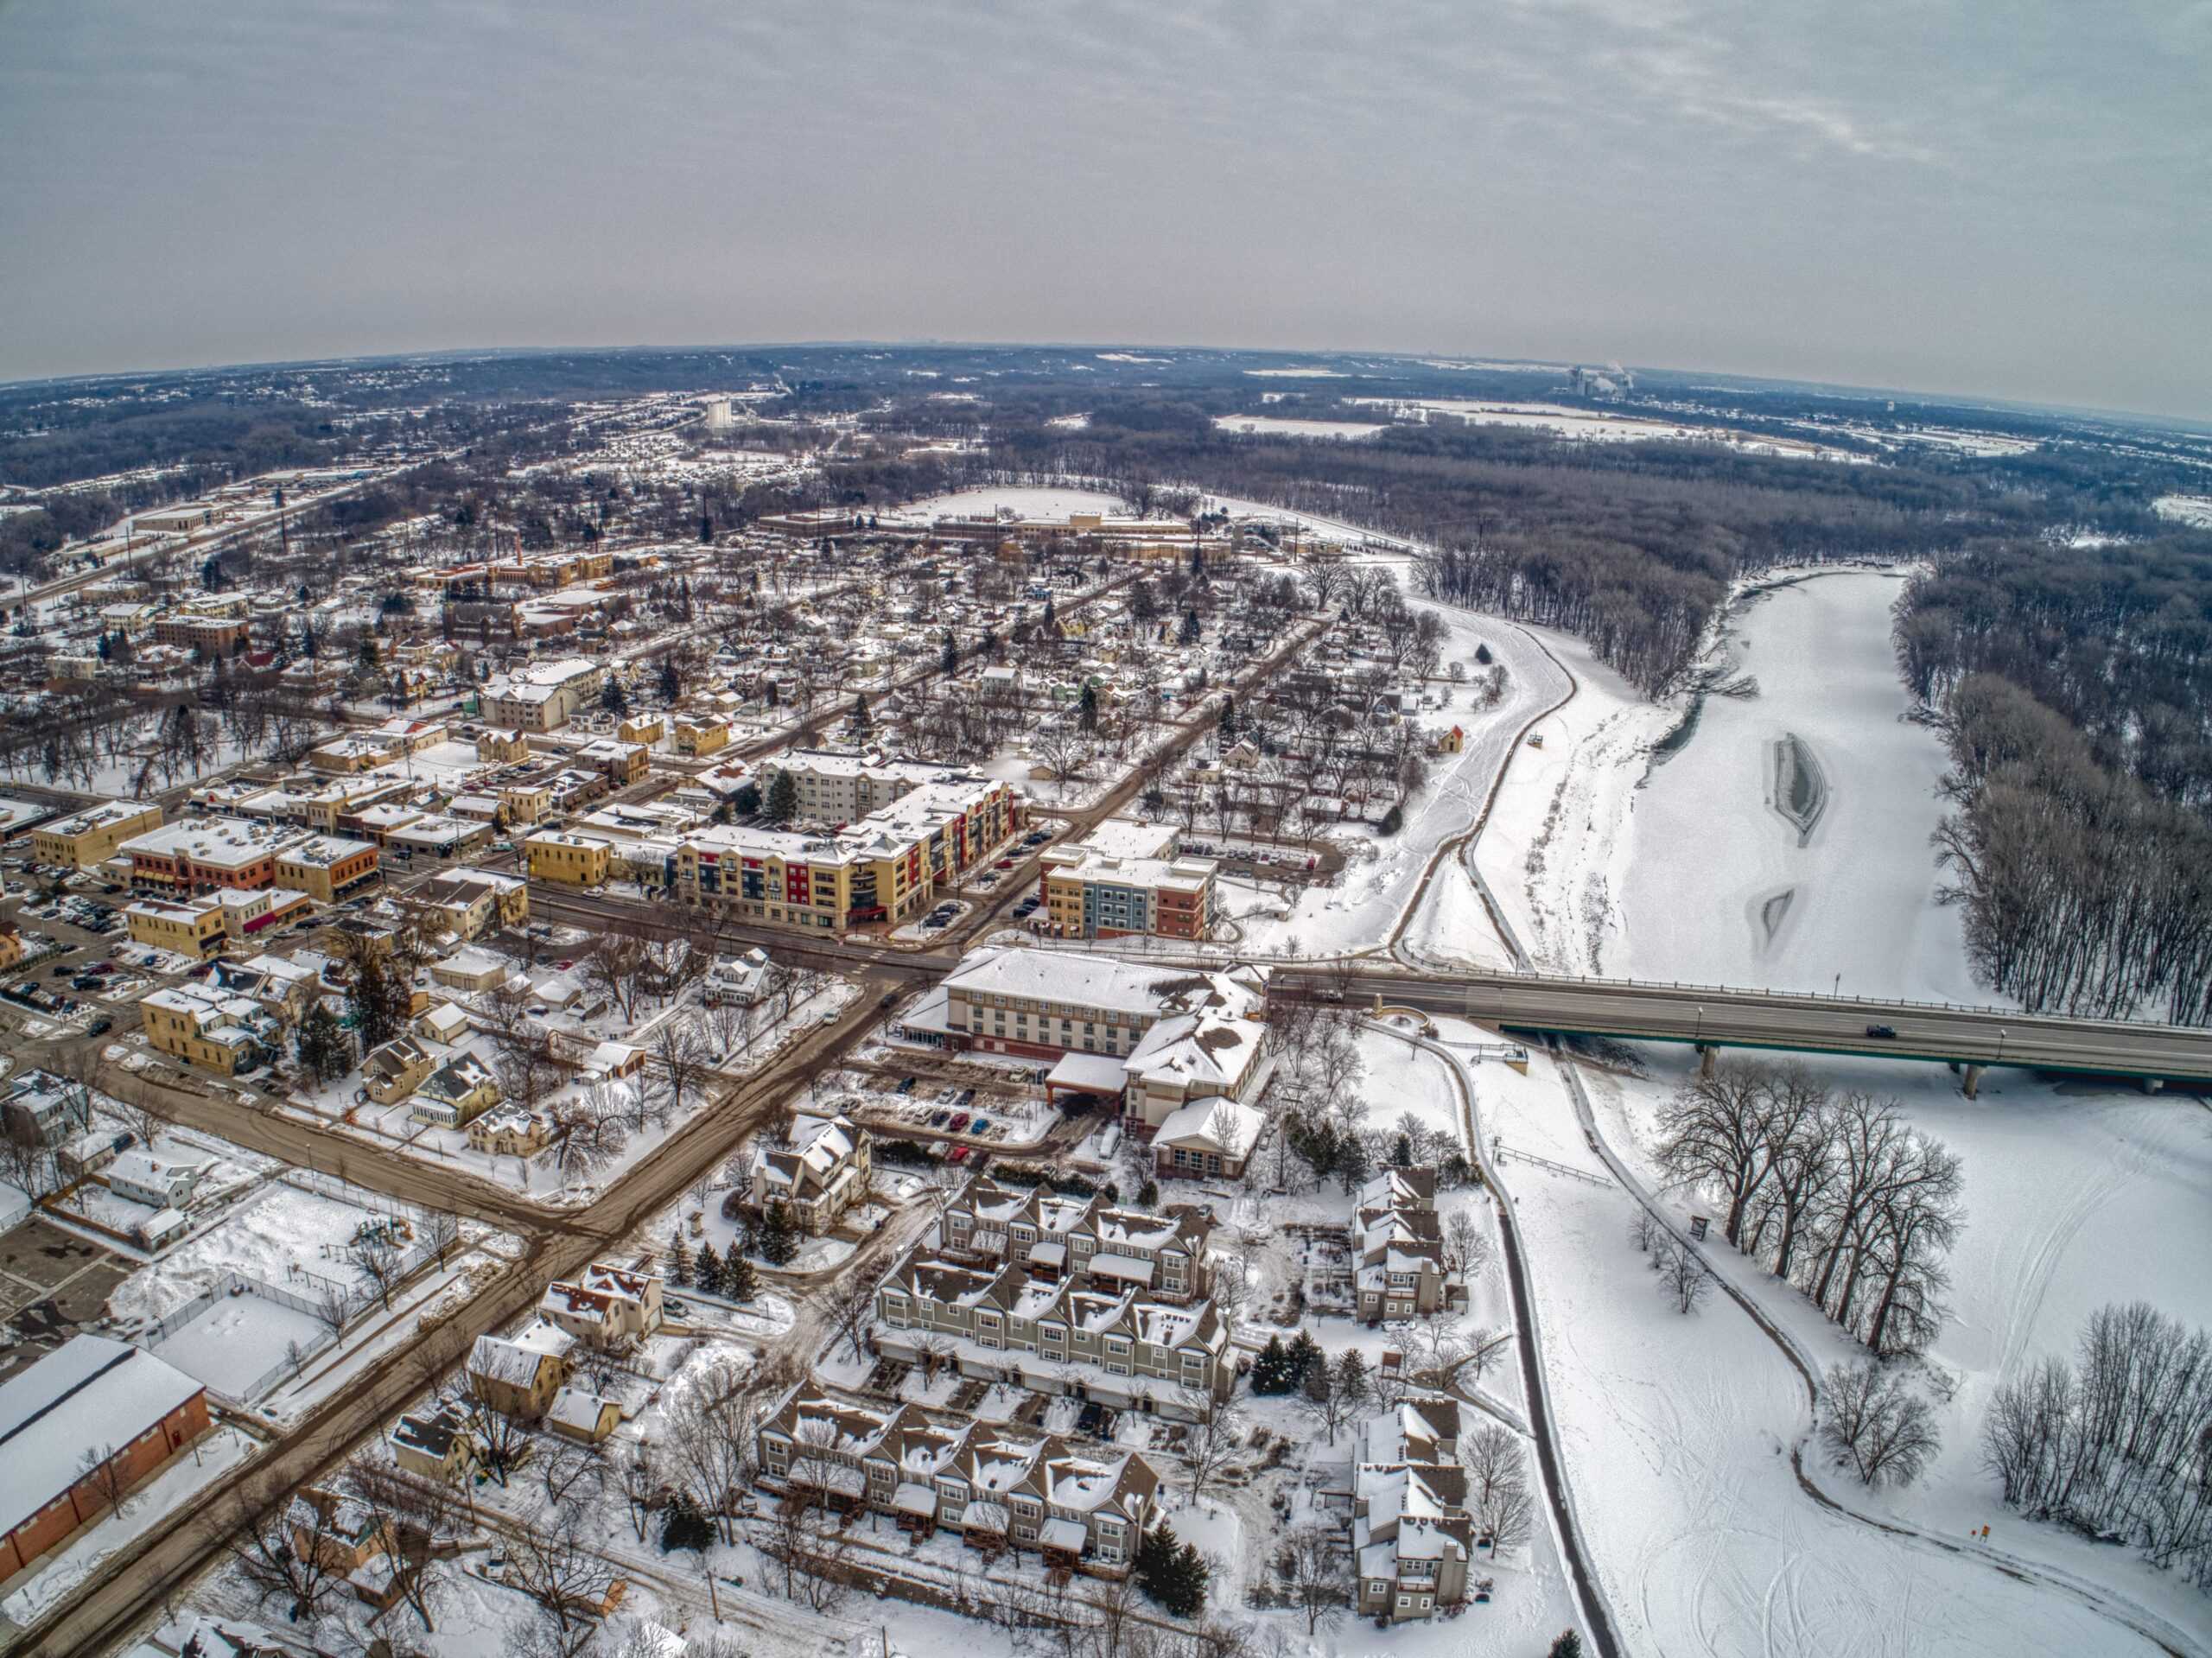
- Median home value: $359,700
- Homes worth over $1 million: 0.7%
- Homeownership rate: 70.0%
- Median household income: $99,988
- Total population: 27,764
13. Eagan
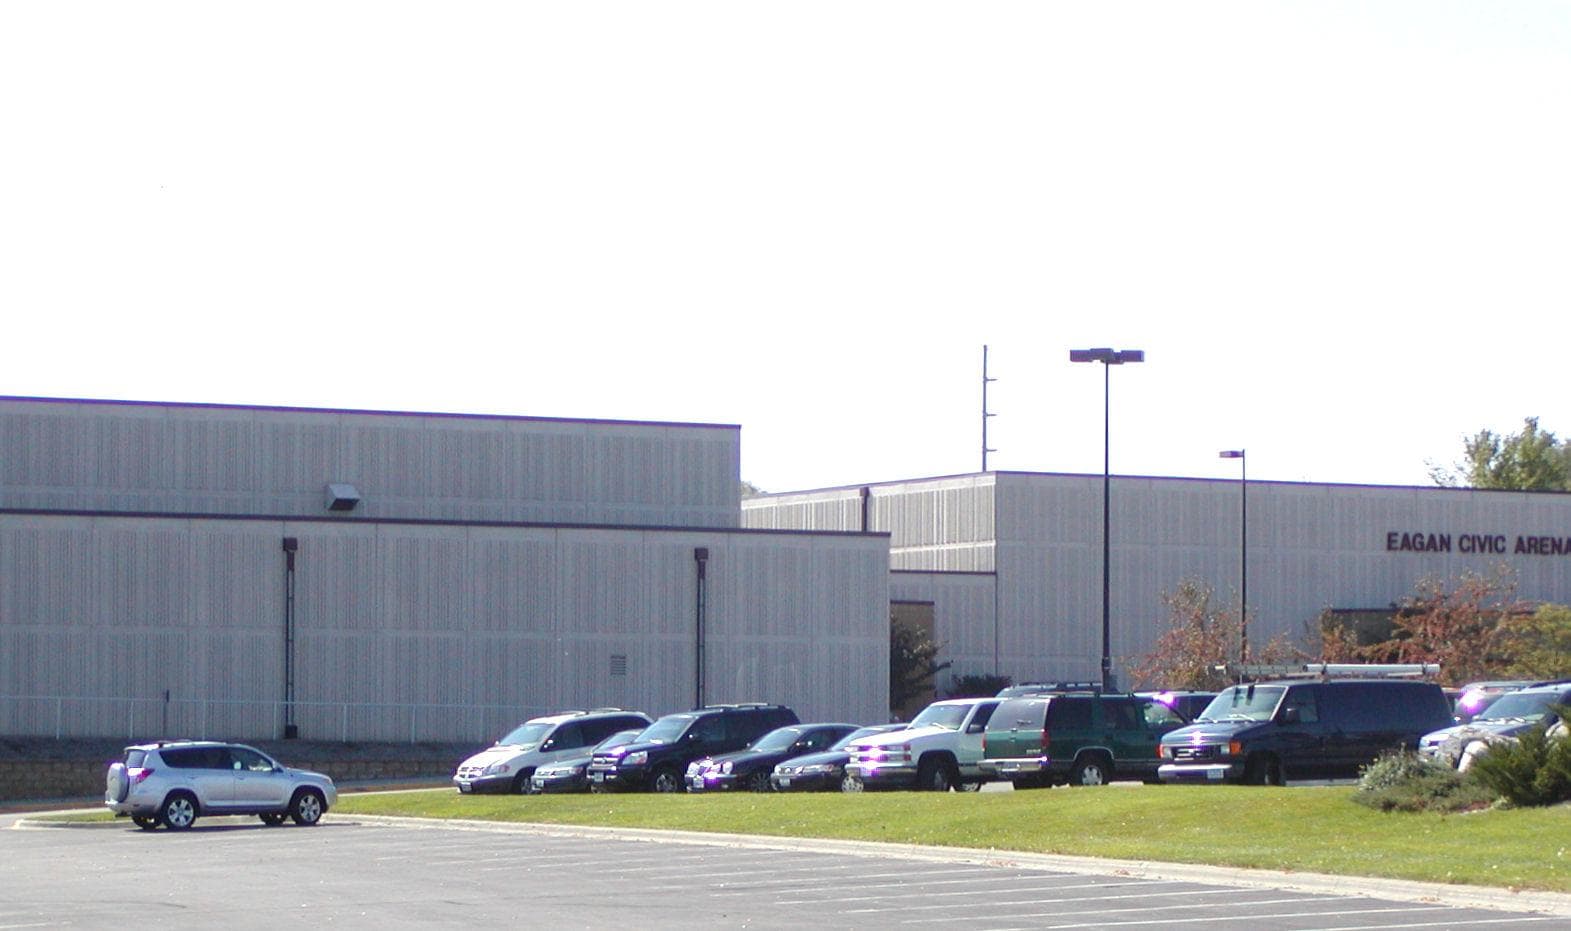
- Median home value: $362,200
- Homes worth over $1 million: 0.5%
- Homeownership rate: 70.3%
- Median household income: $104,101
- Total population: 68,262
12. Andover
- Median home value: $370,200
- Homes worth over $1 million: 1.1%
- Homeownership rate: 93.7%
- Median household income: $123,054
- Total population: 32,639
11. Savage
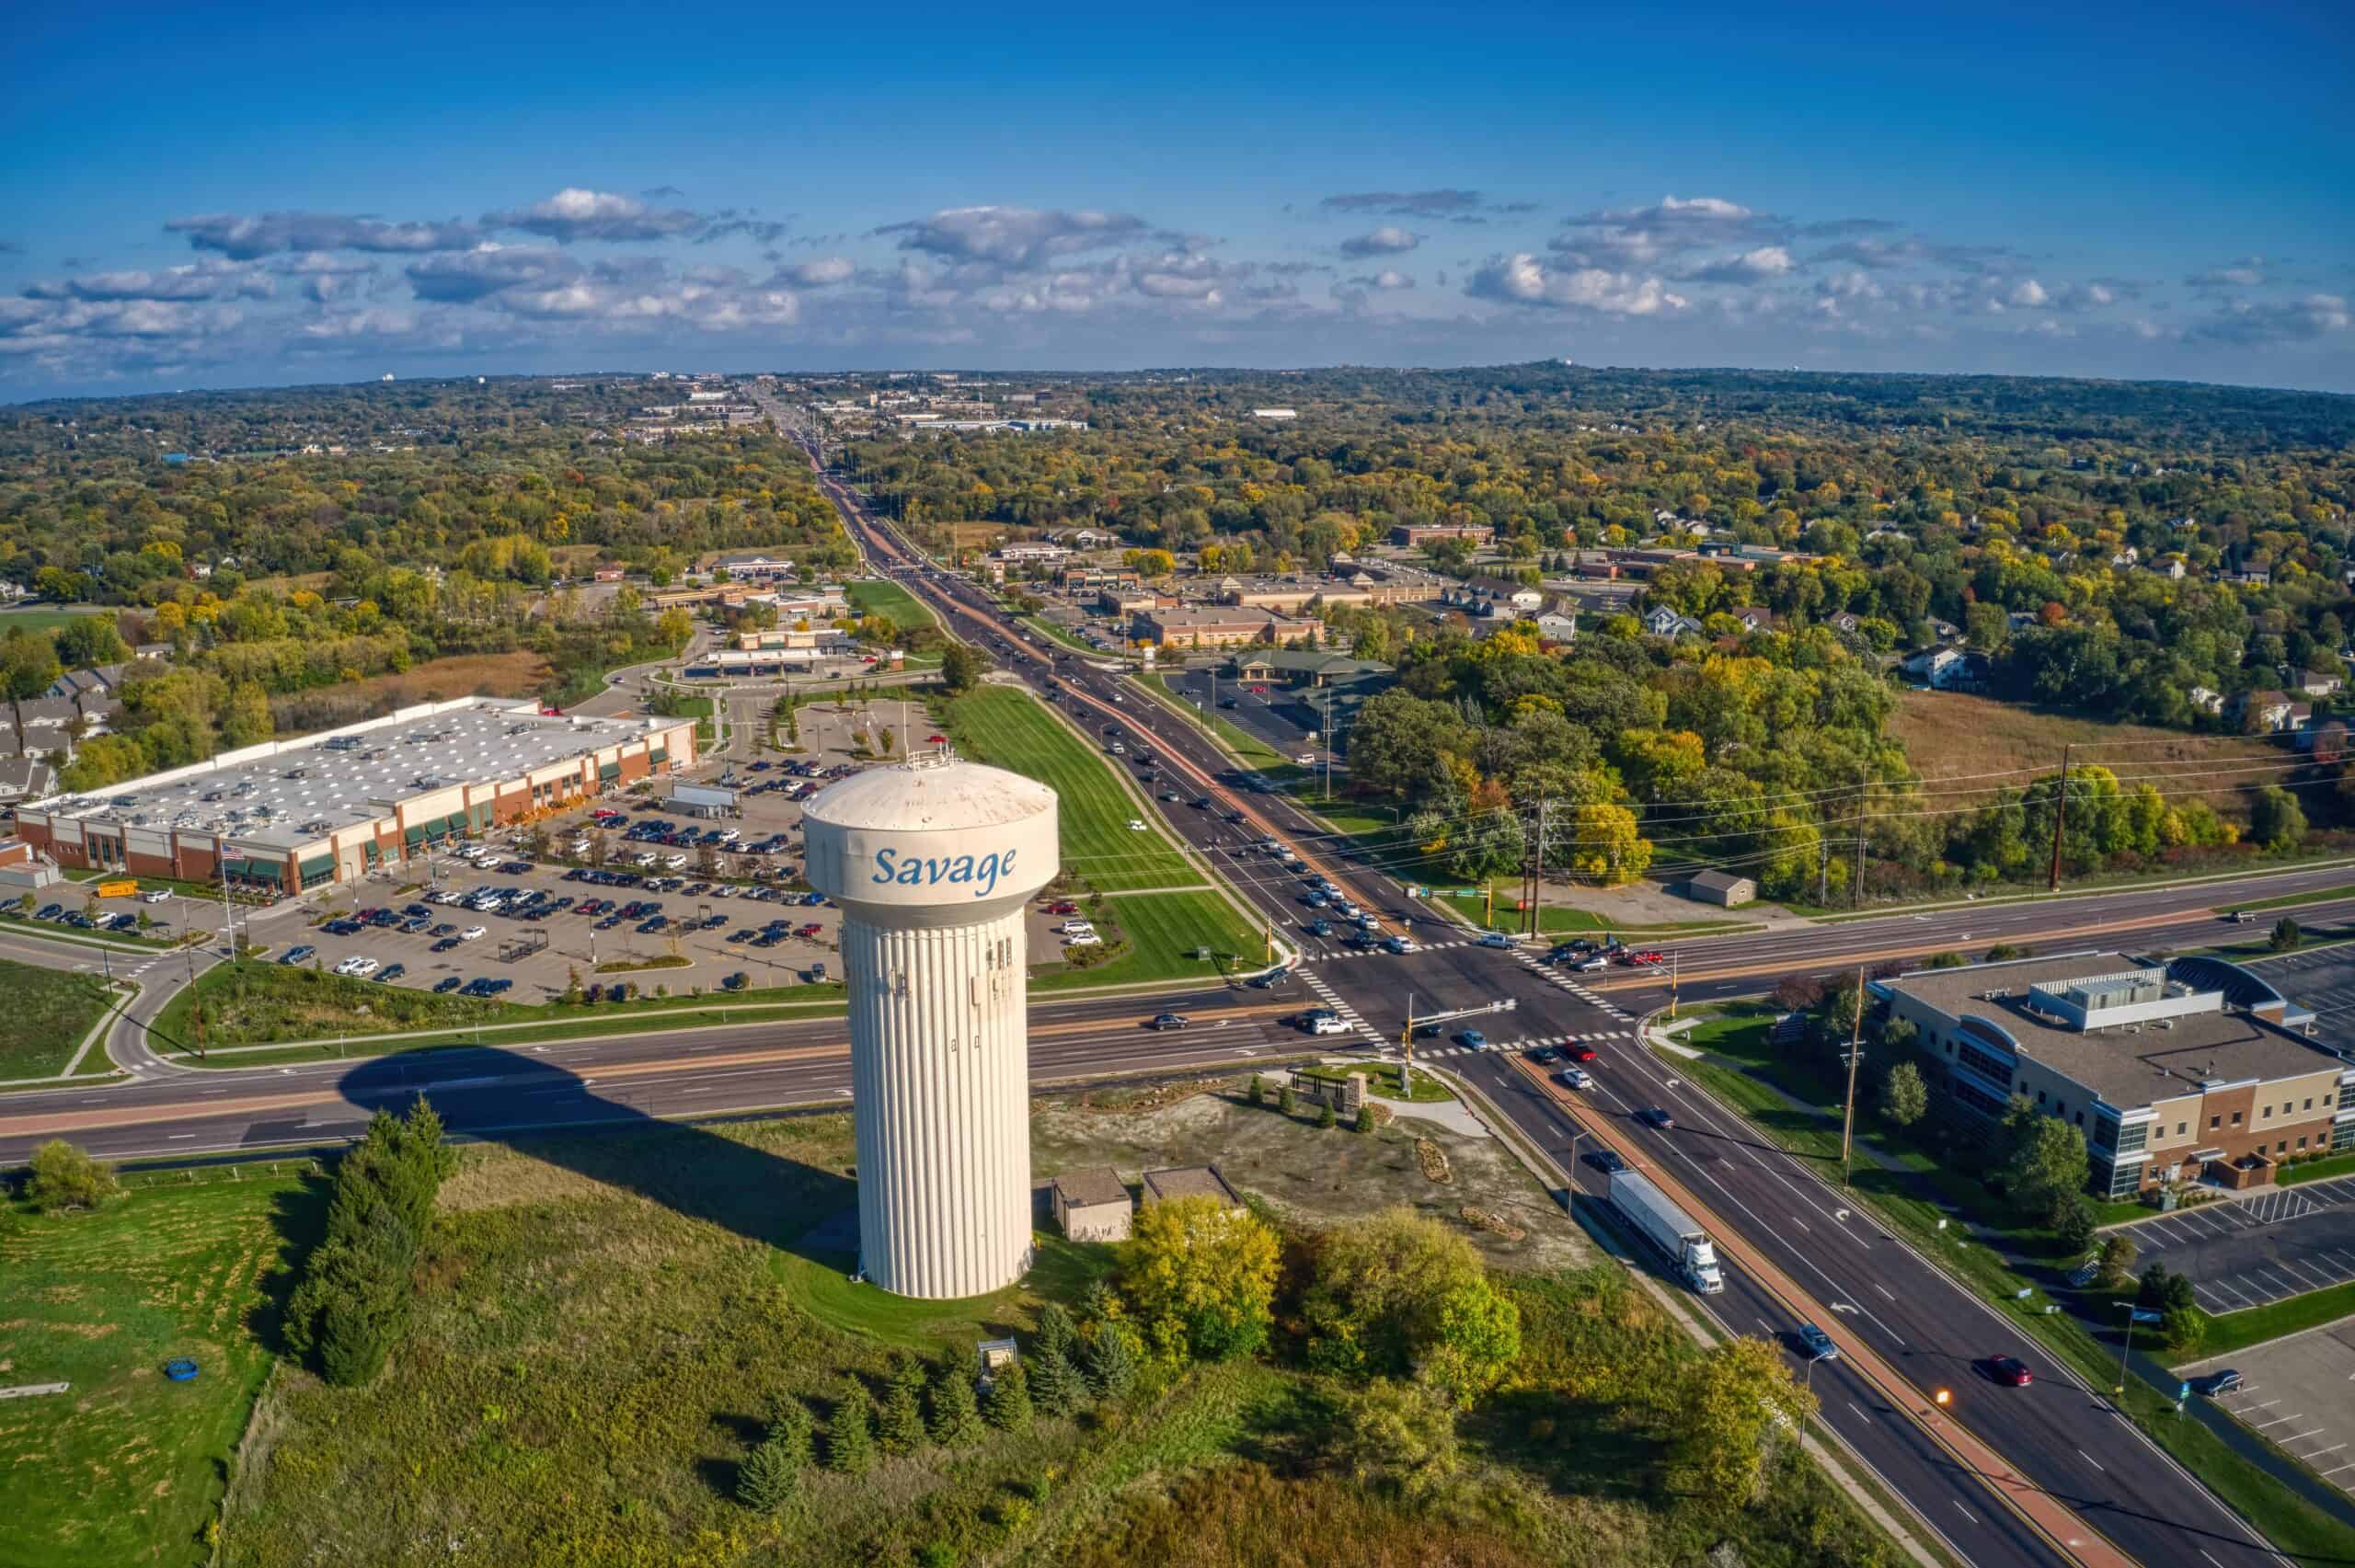
- Median home value: $377,600
- Homes worth over $1 million: 1.9%
- Homeownership rate: 85.7%
- Median household income: $123,069
- Total population: 32,441
10. Rosemount
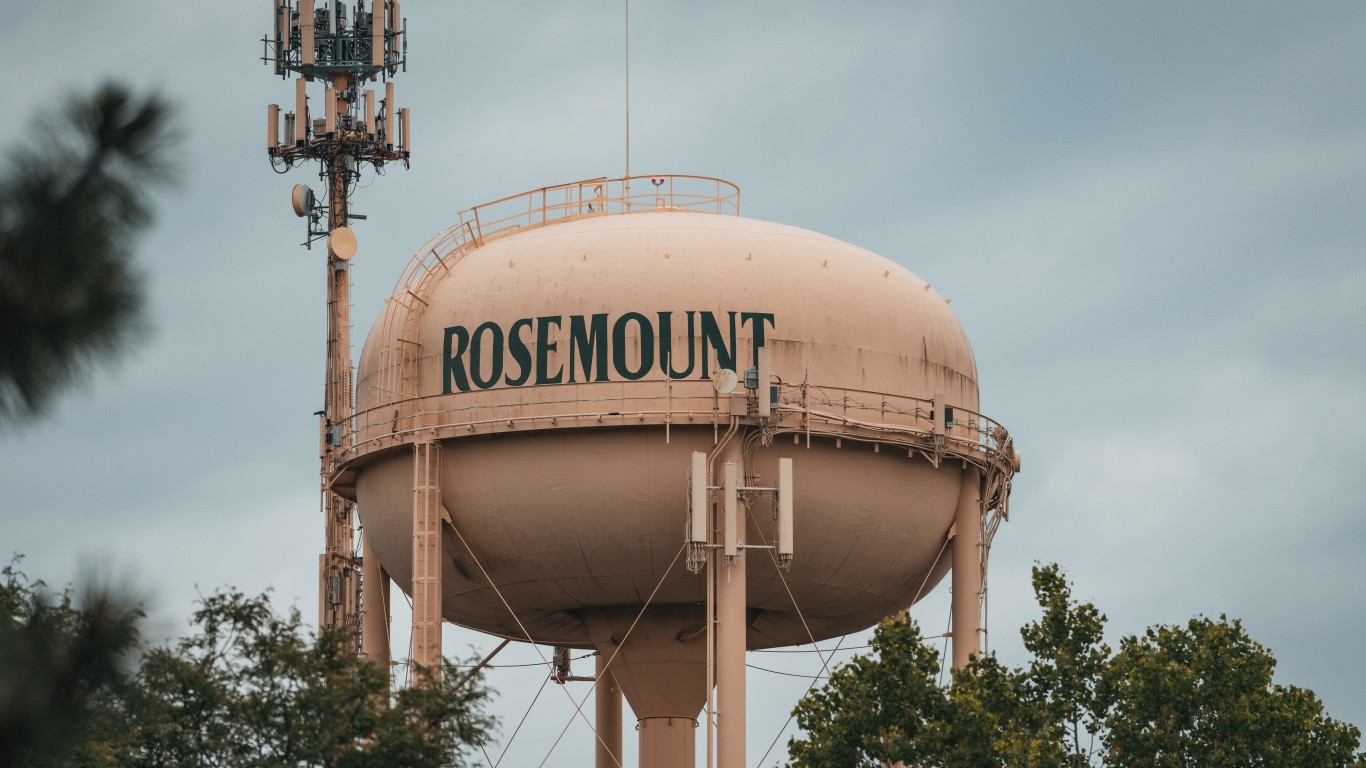
- Median home value: $378,500
- Homes worth over $1 million: 1.0%
- Homeownership rate: 86.7%
- Median household income: $127,252
- Total population: 25,993
9. Maple Grove

- Median home value: $379,800
- Homes worth over $1 million: 1.2%
- Homeownership rate: 83.6%
- Median household income: $127,001
- Total population: 70,110
8. Lakeville
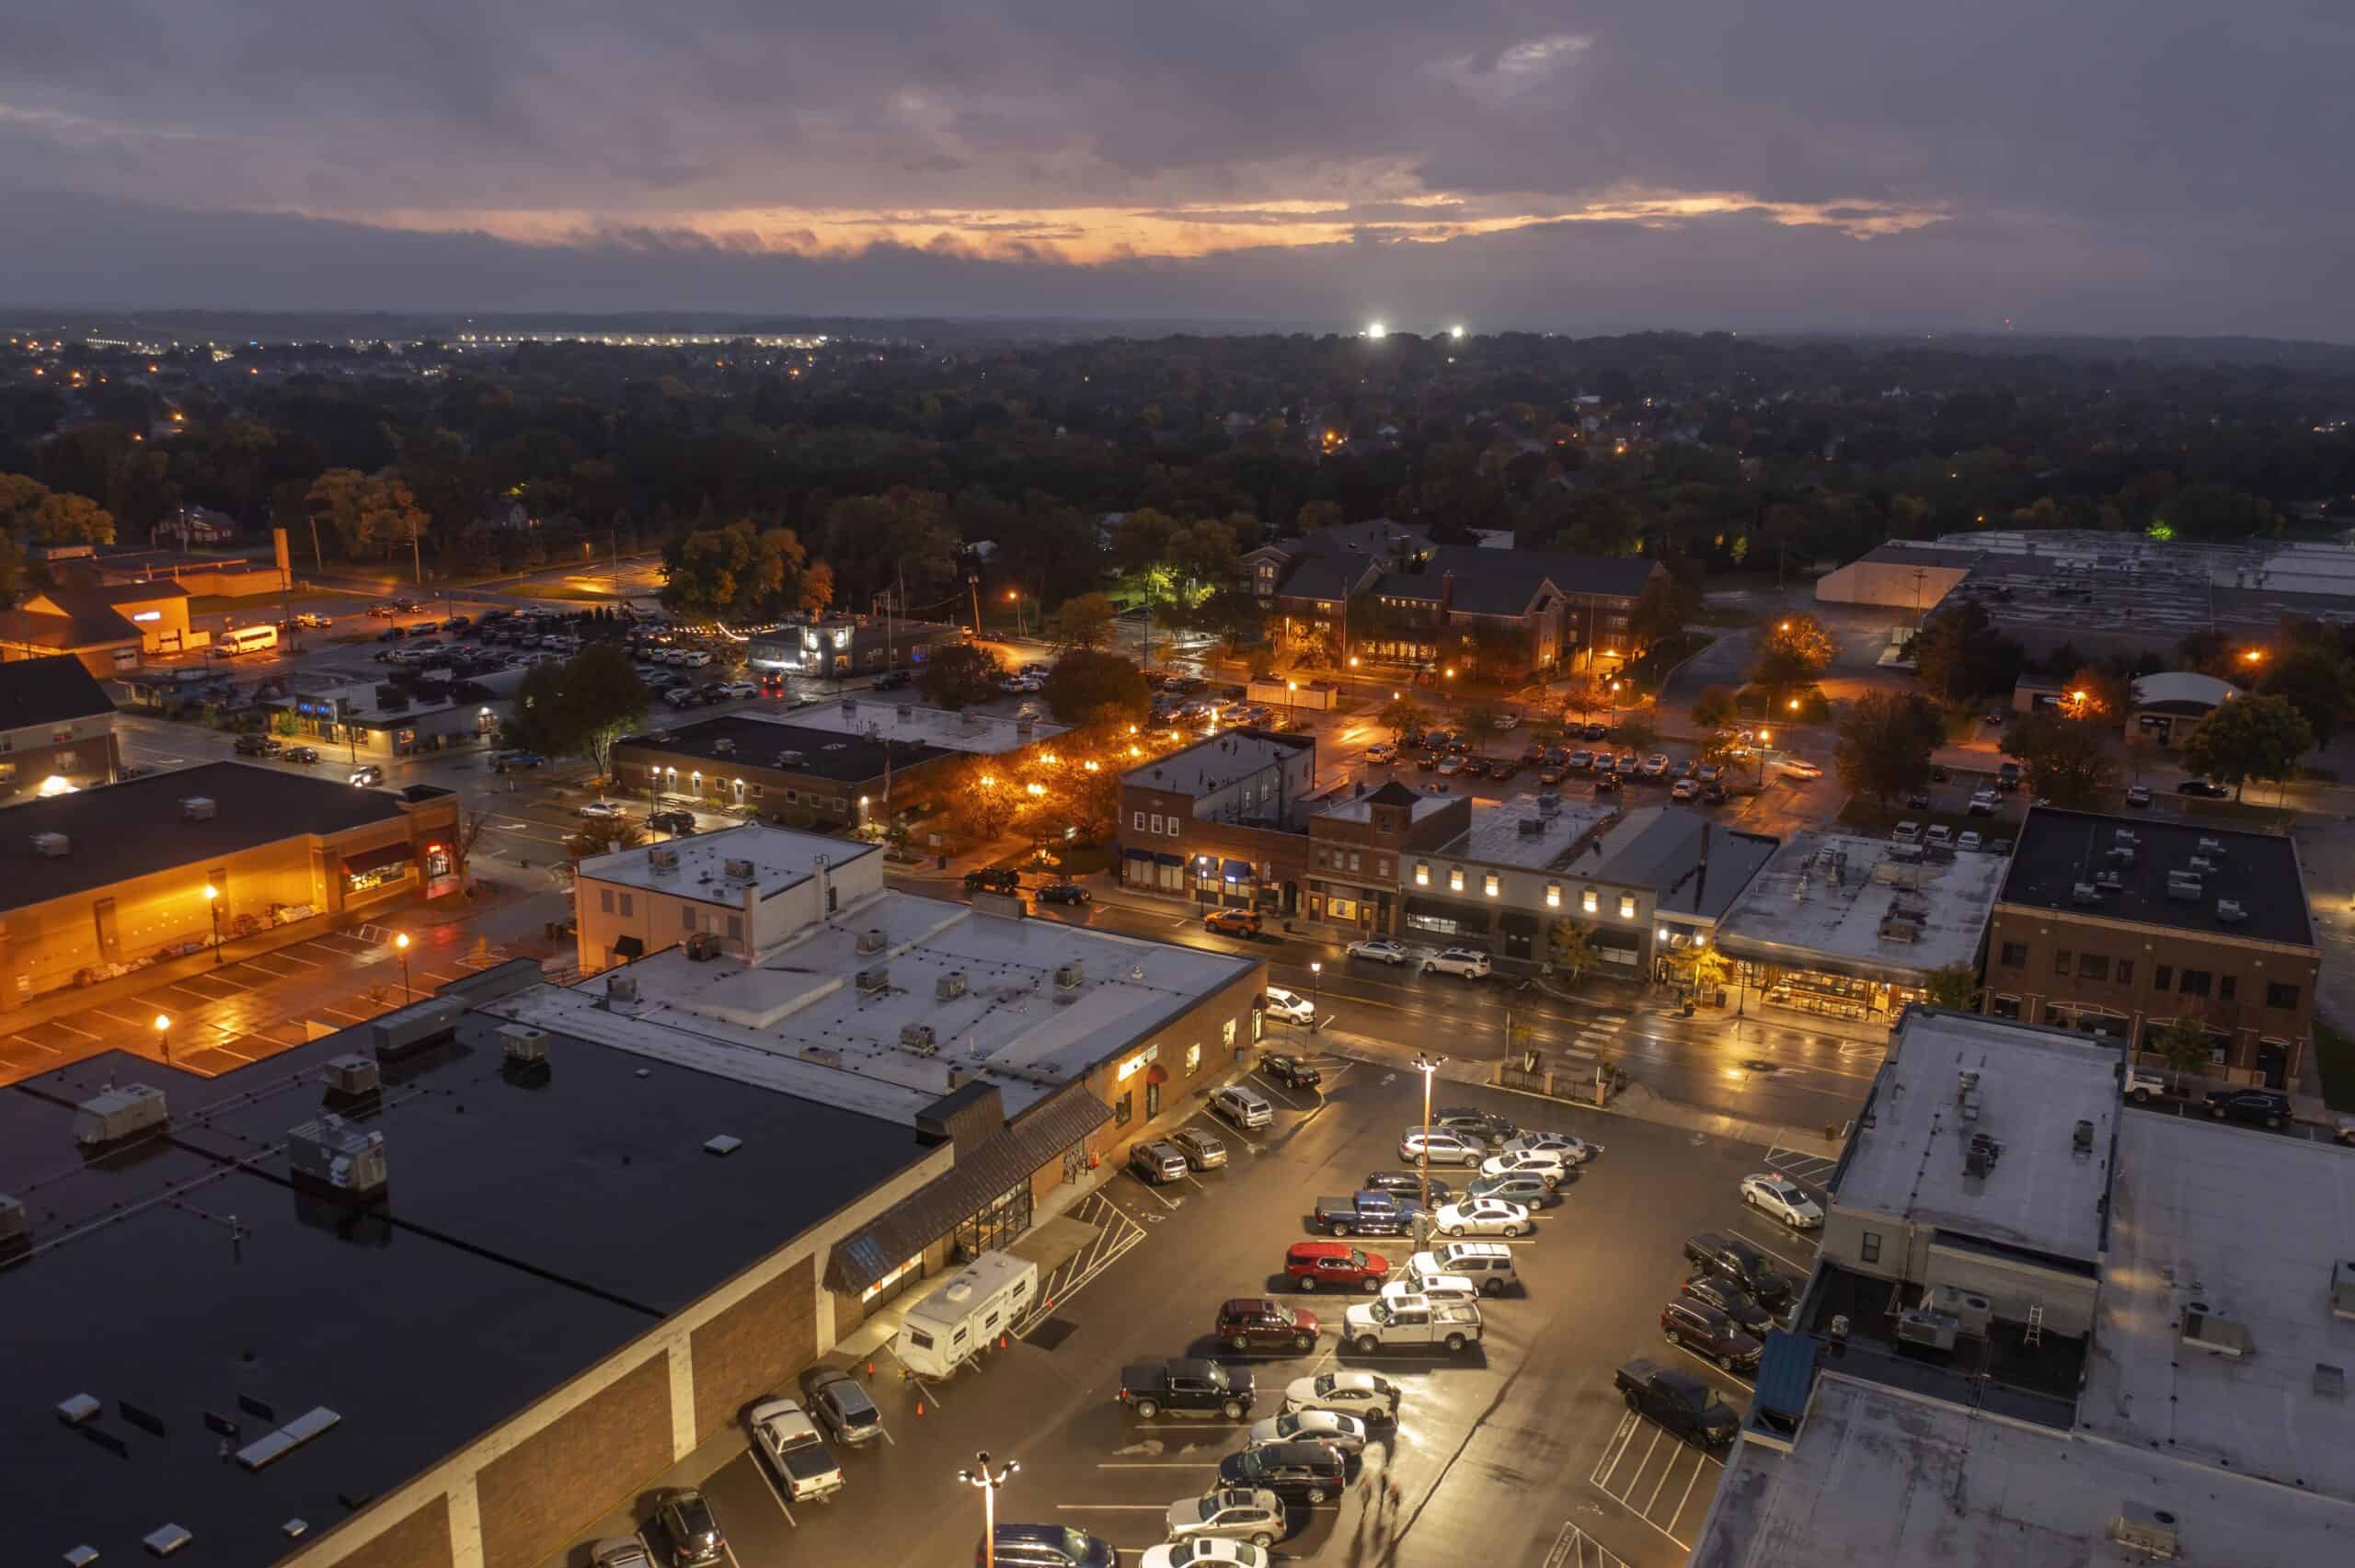
- Median home value: $395,900
- Homes worth over $1 million: 1.2%
- Homeownership rate: 87.4%
- Median household income: $129,069
- Total population: 70,696
7. Prior Lake
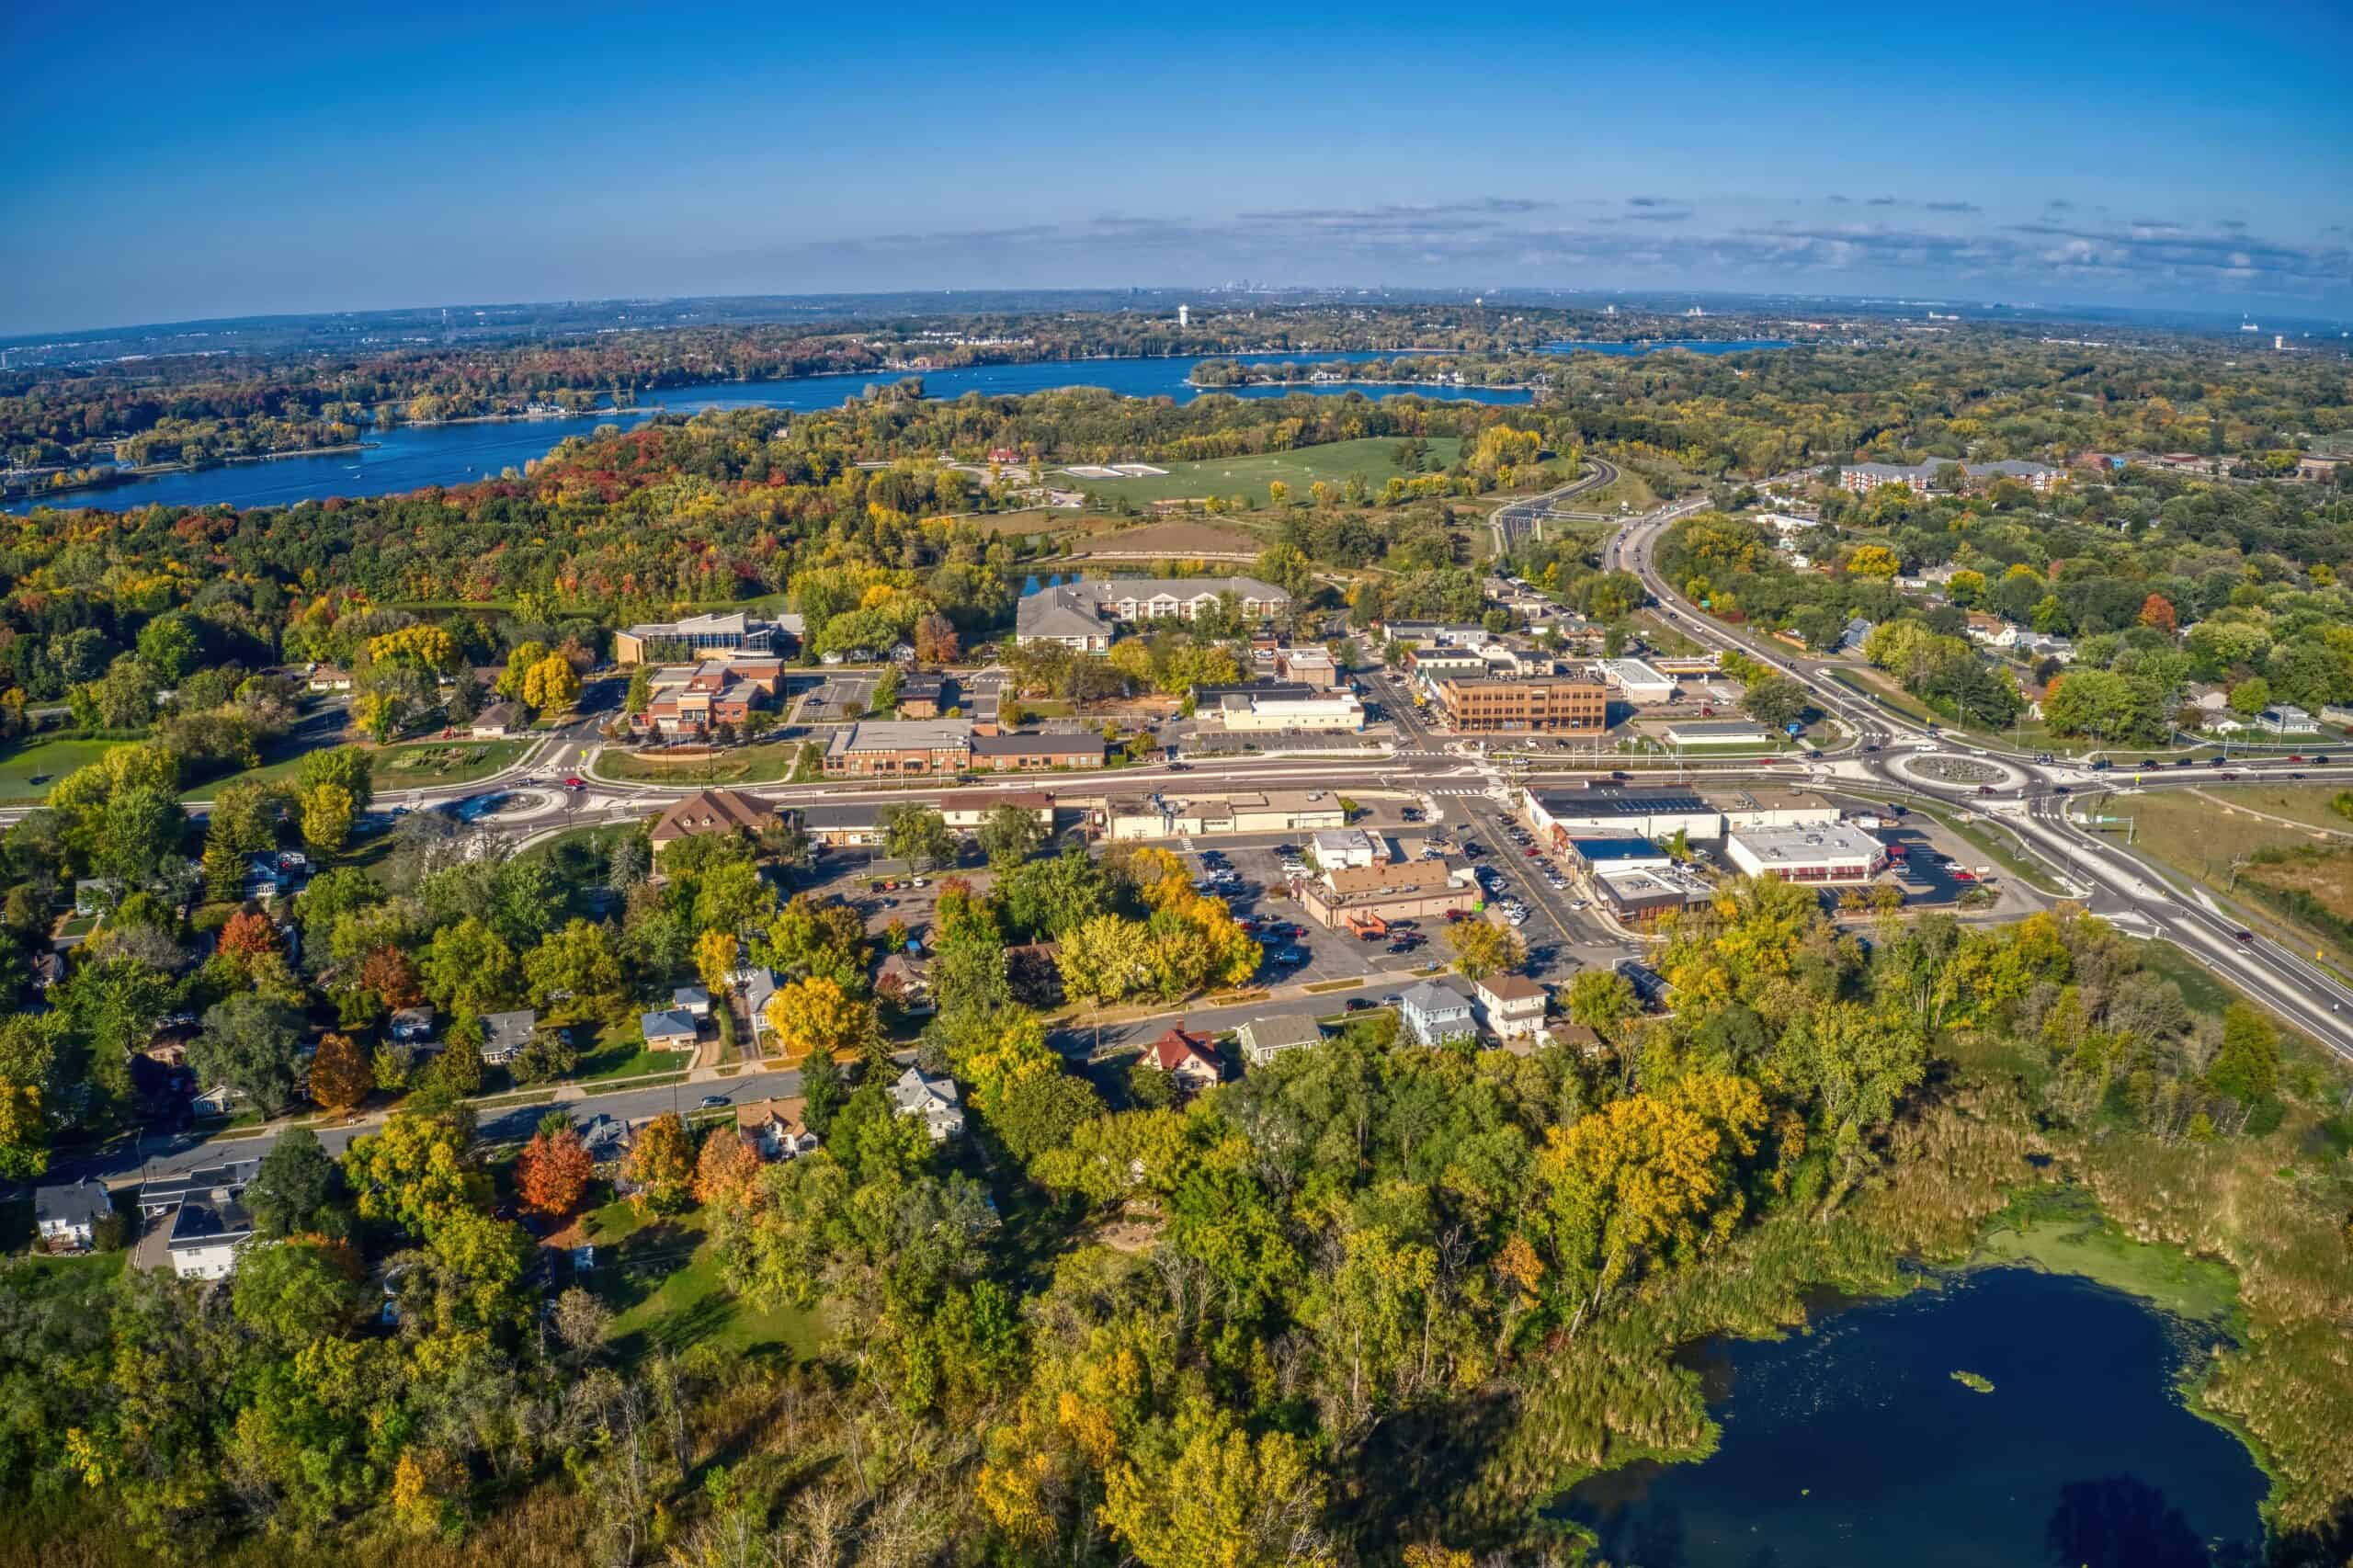
- Median home value: $400,500
- Homes worth over $1 million: 6.2%
- Homeownership rate: 86.2%
- Median household income: $129,539
- Total population: 27,608
6. Woodbury
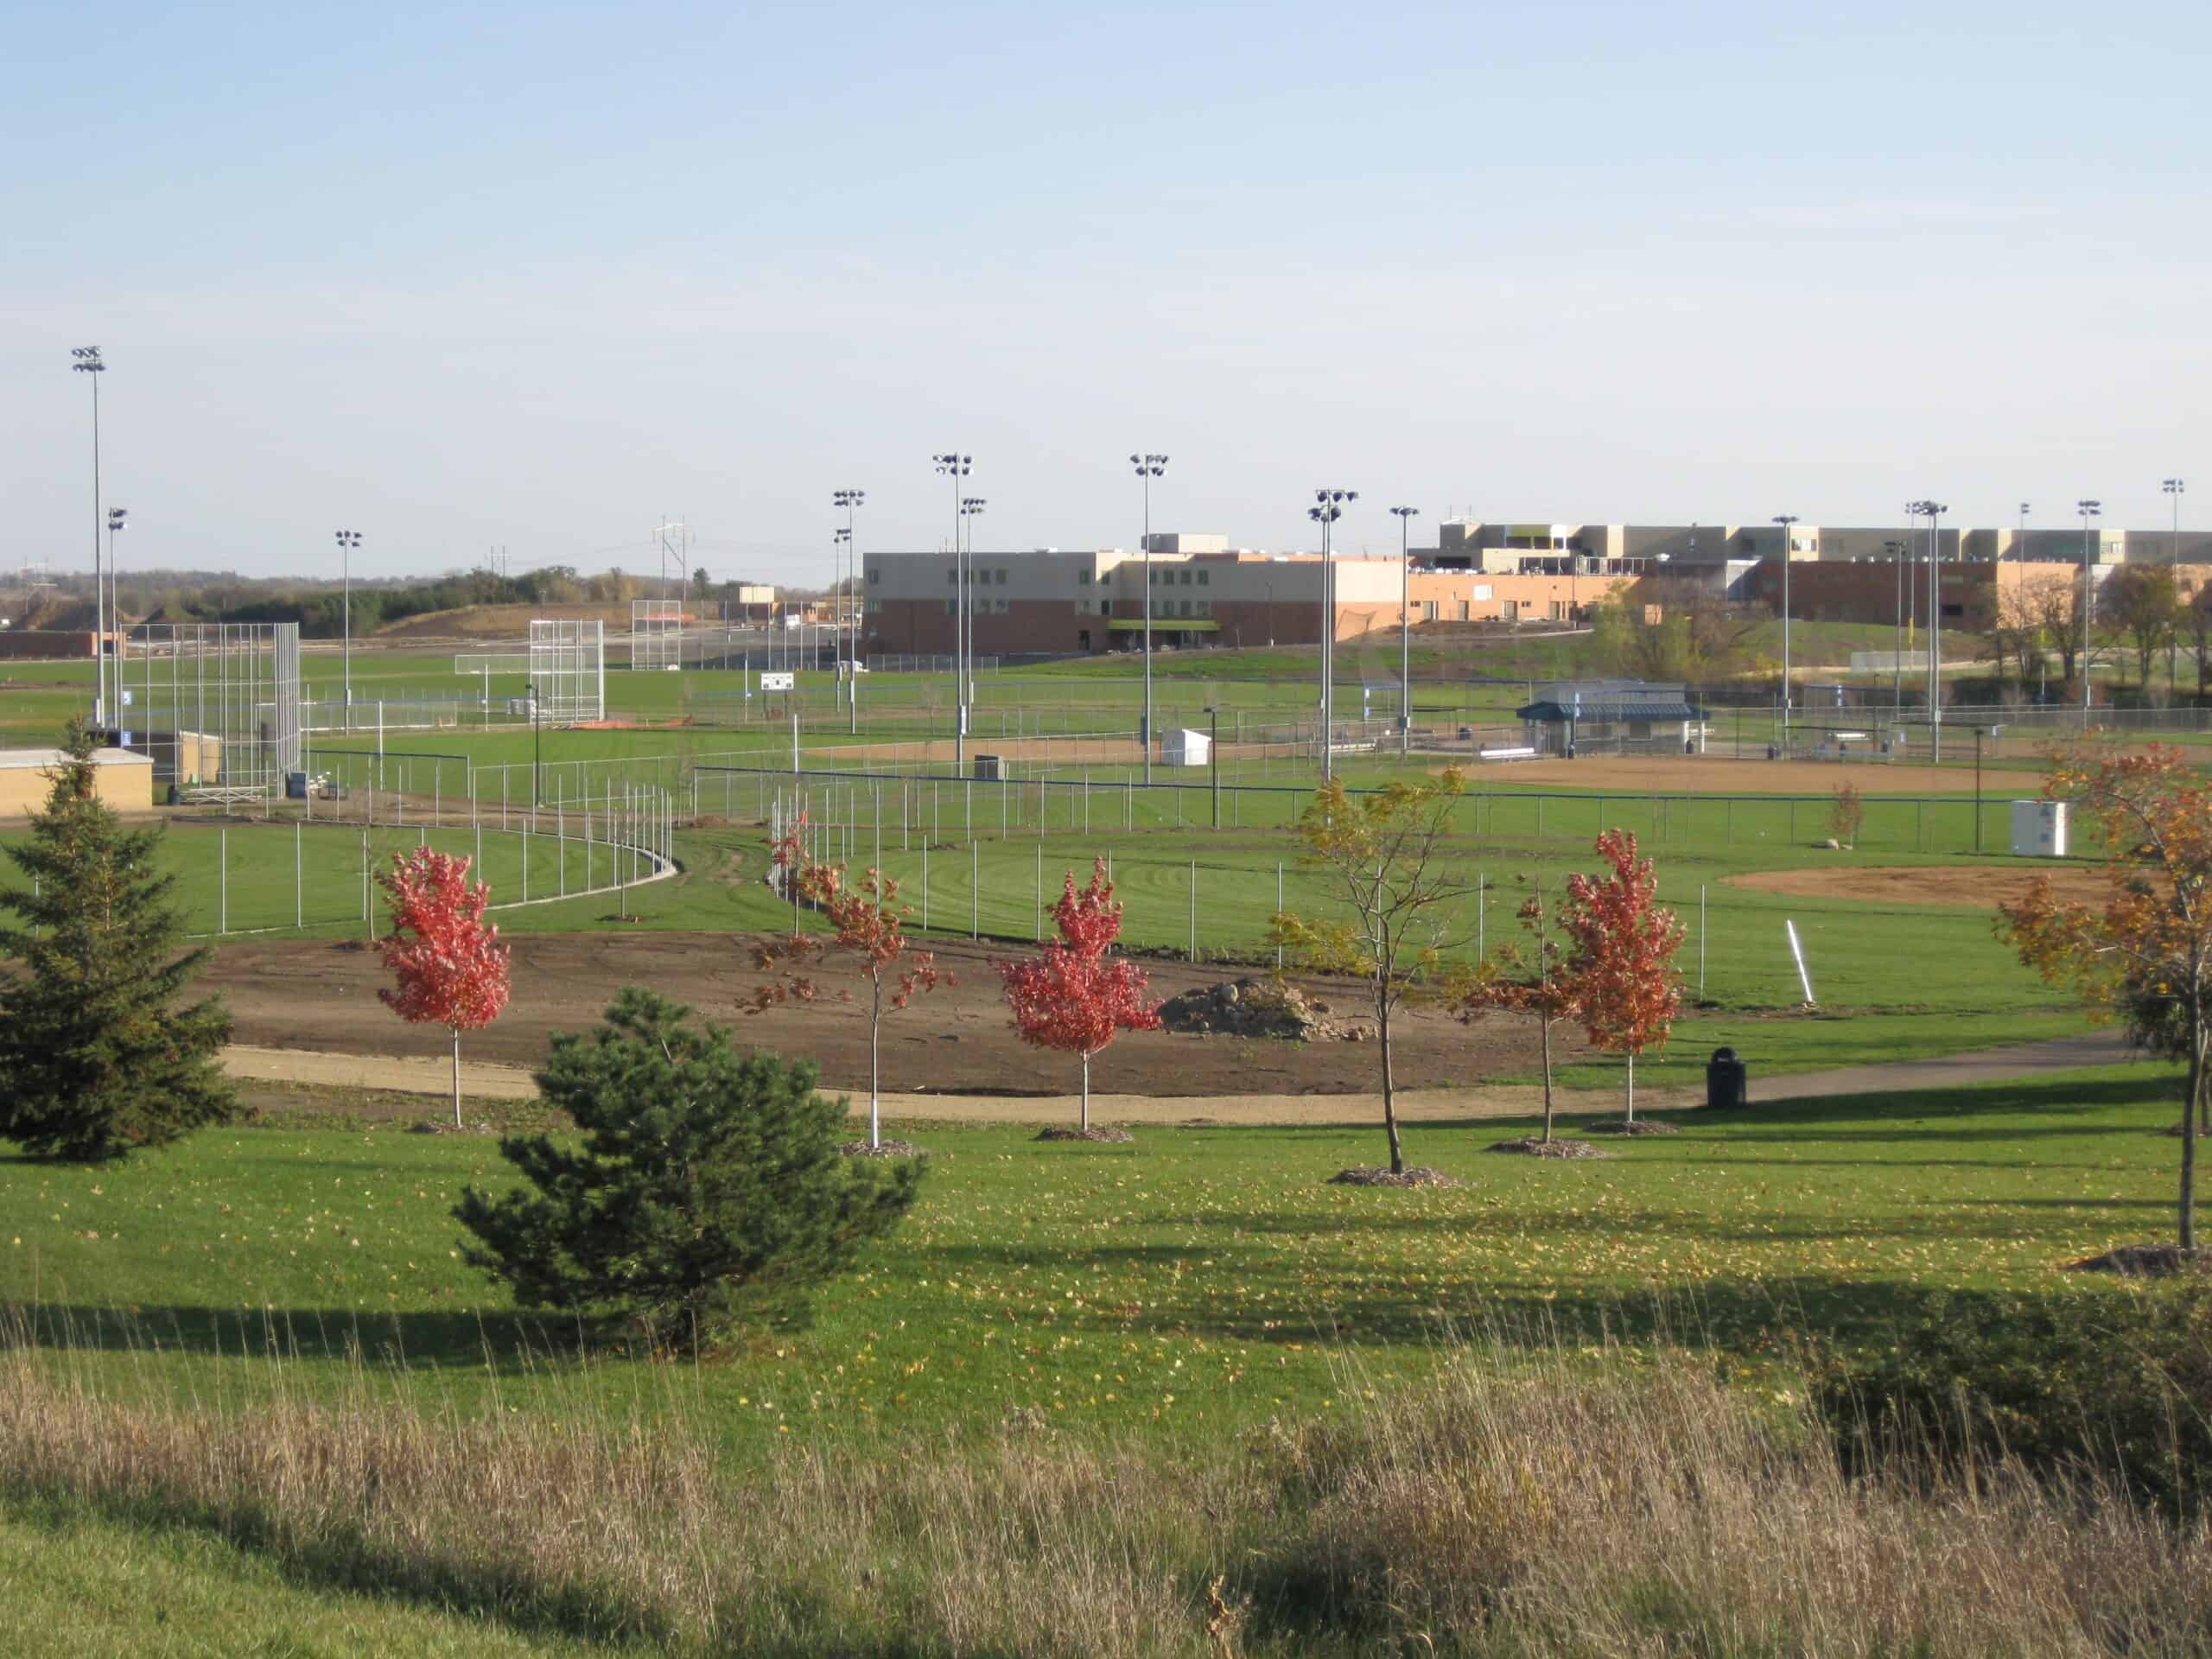
- Median home value: $409,900
- Homes worth over $1 million: 0.9%
- Homeownership rate: 80.0%
- Median household income: $125,097
- Total population: 75,549
5. Minnetonka
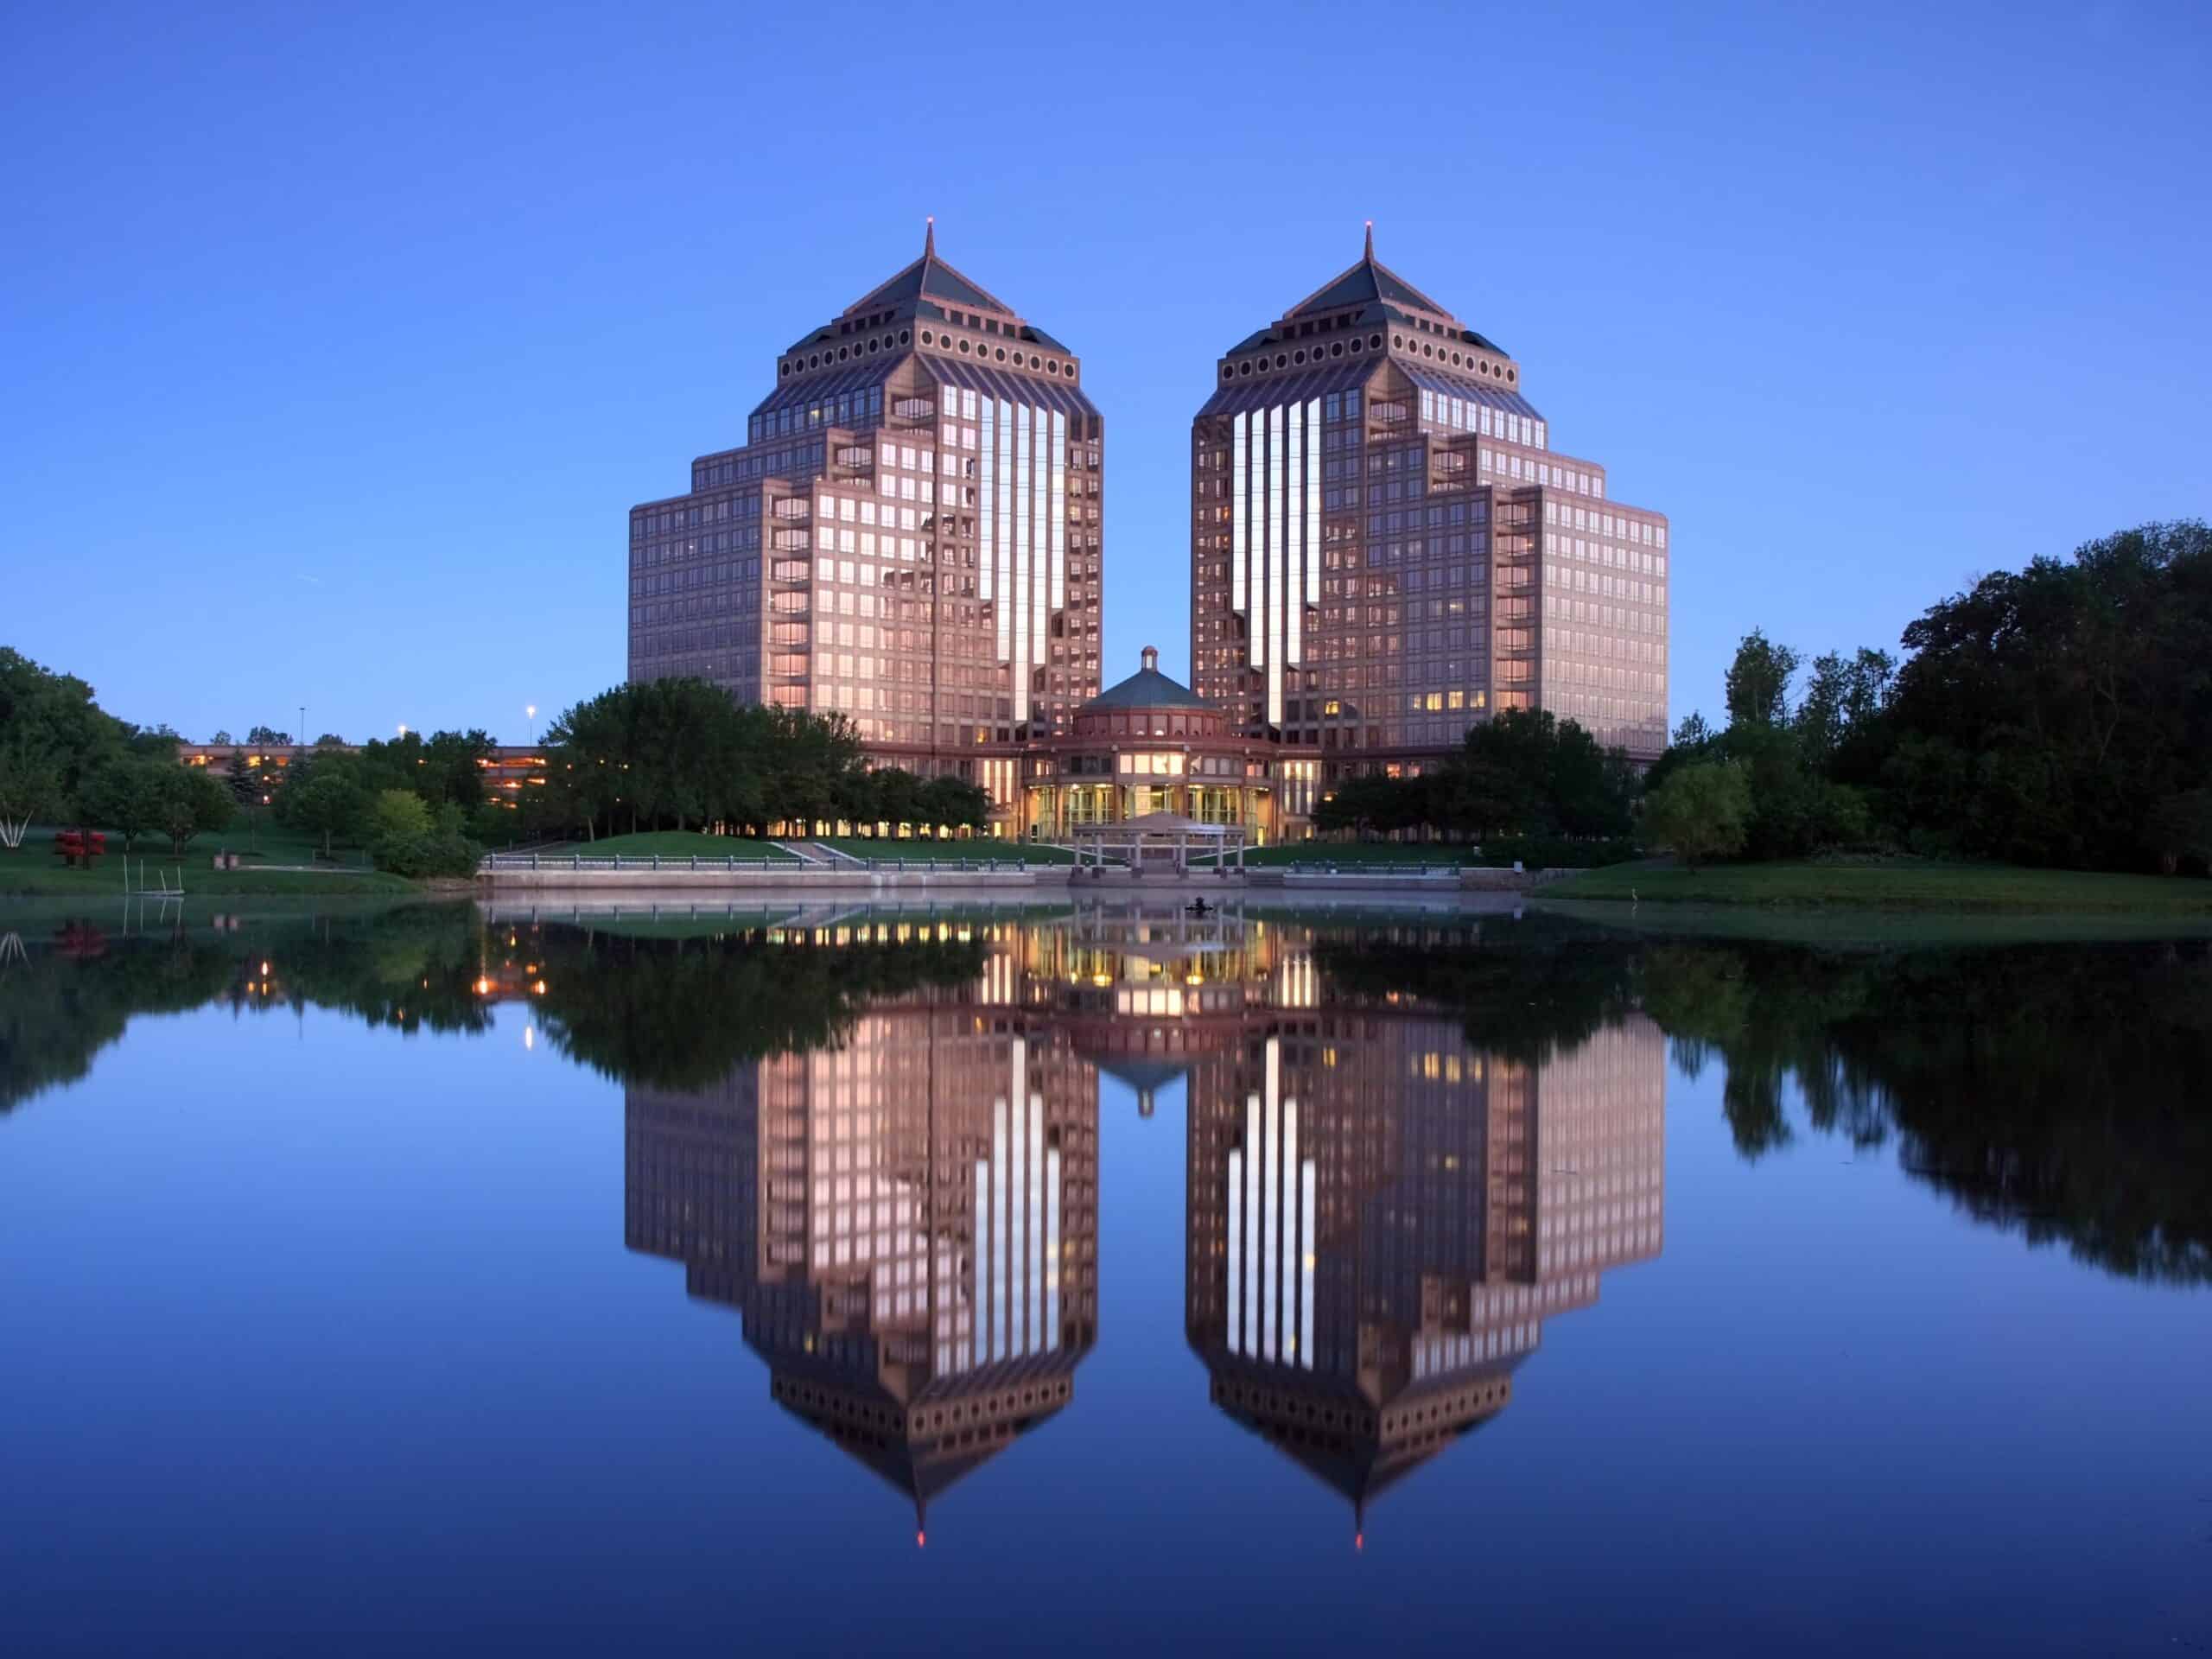
- Median home value: $430,800
- Homes worth over $1 million: 4.6%
- Homeownership rate: 72.2%
- Median household income: $114,867
- Total population: 53,529
4. Eden Prairie
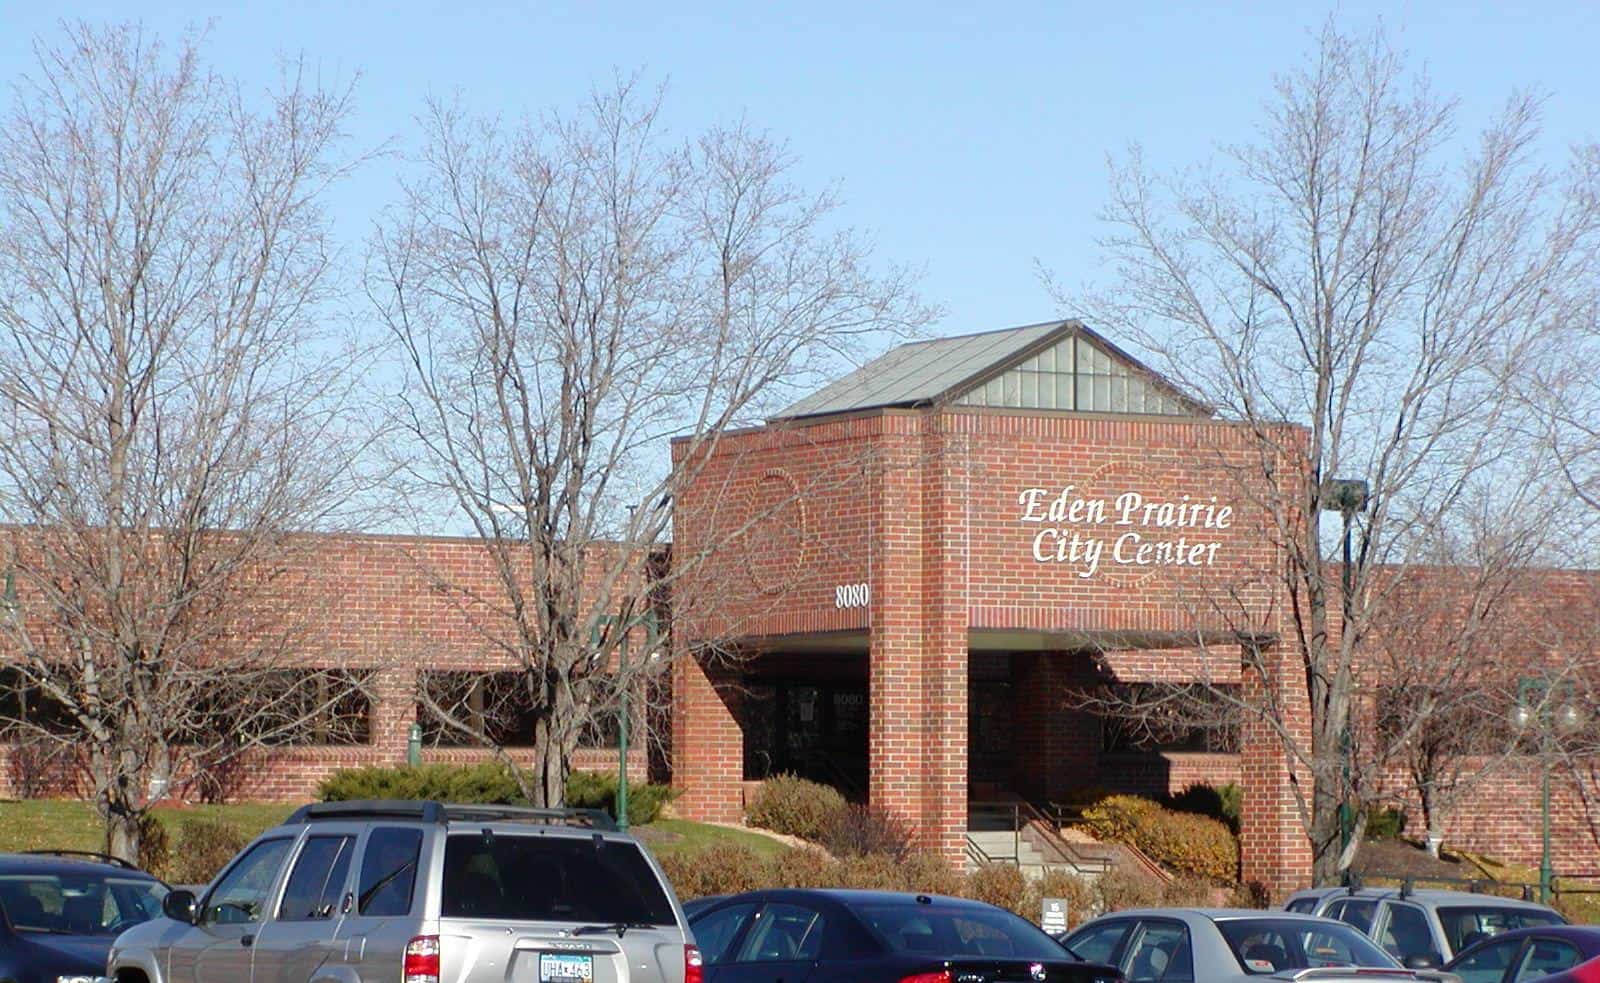
- Median home value: $442,200
- Homes worth over $1 million: 4.7%
- Homeownership rate: 76.3%
- Median household income: $129,345
- Total population: 63,623
3. Plymouth
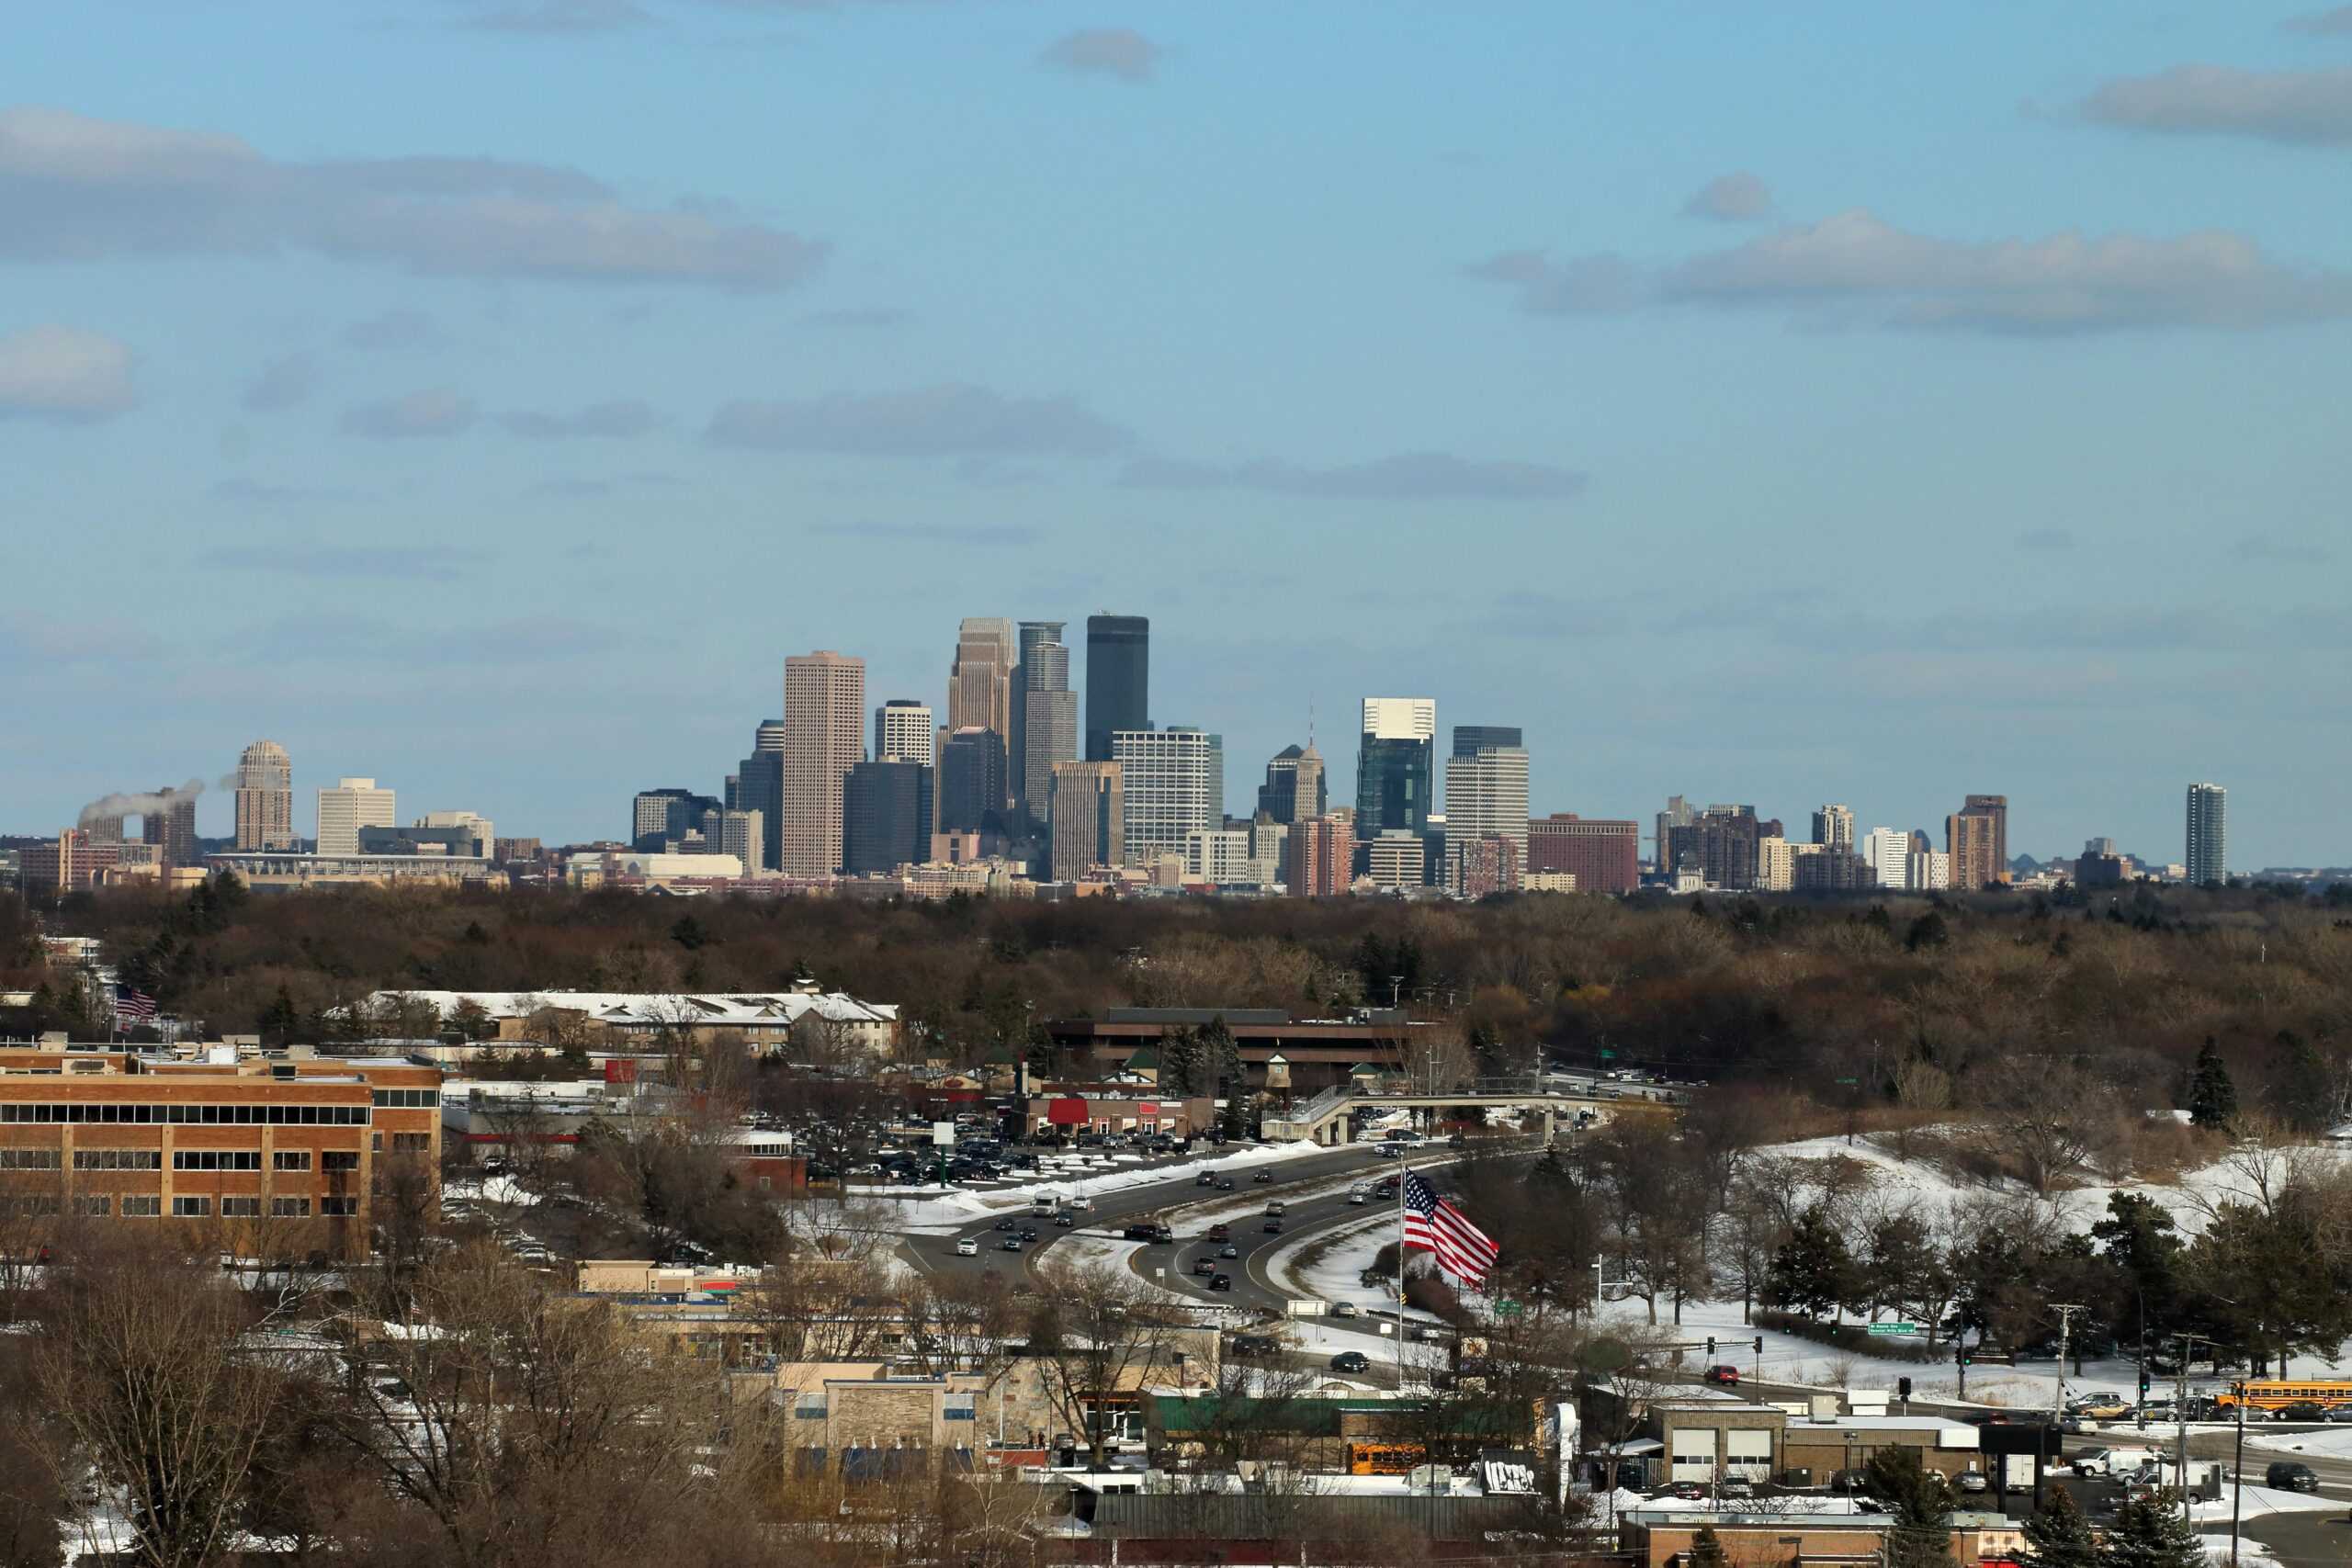
- Median home value: $447,600
- Homes worth over $1 million: 1.4%
- Homeownership rate: 74.6%
- Median household income: $130,131
- Total population: 79,918
2. Chanhassen
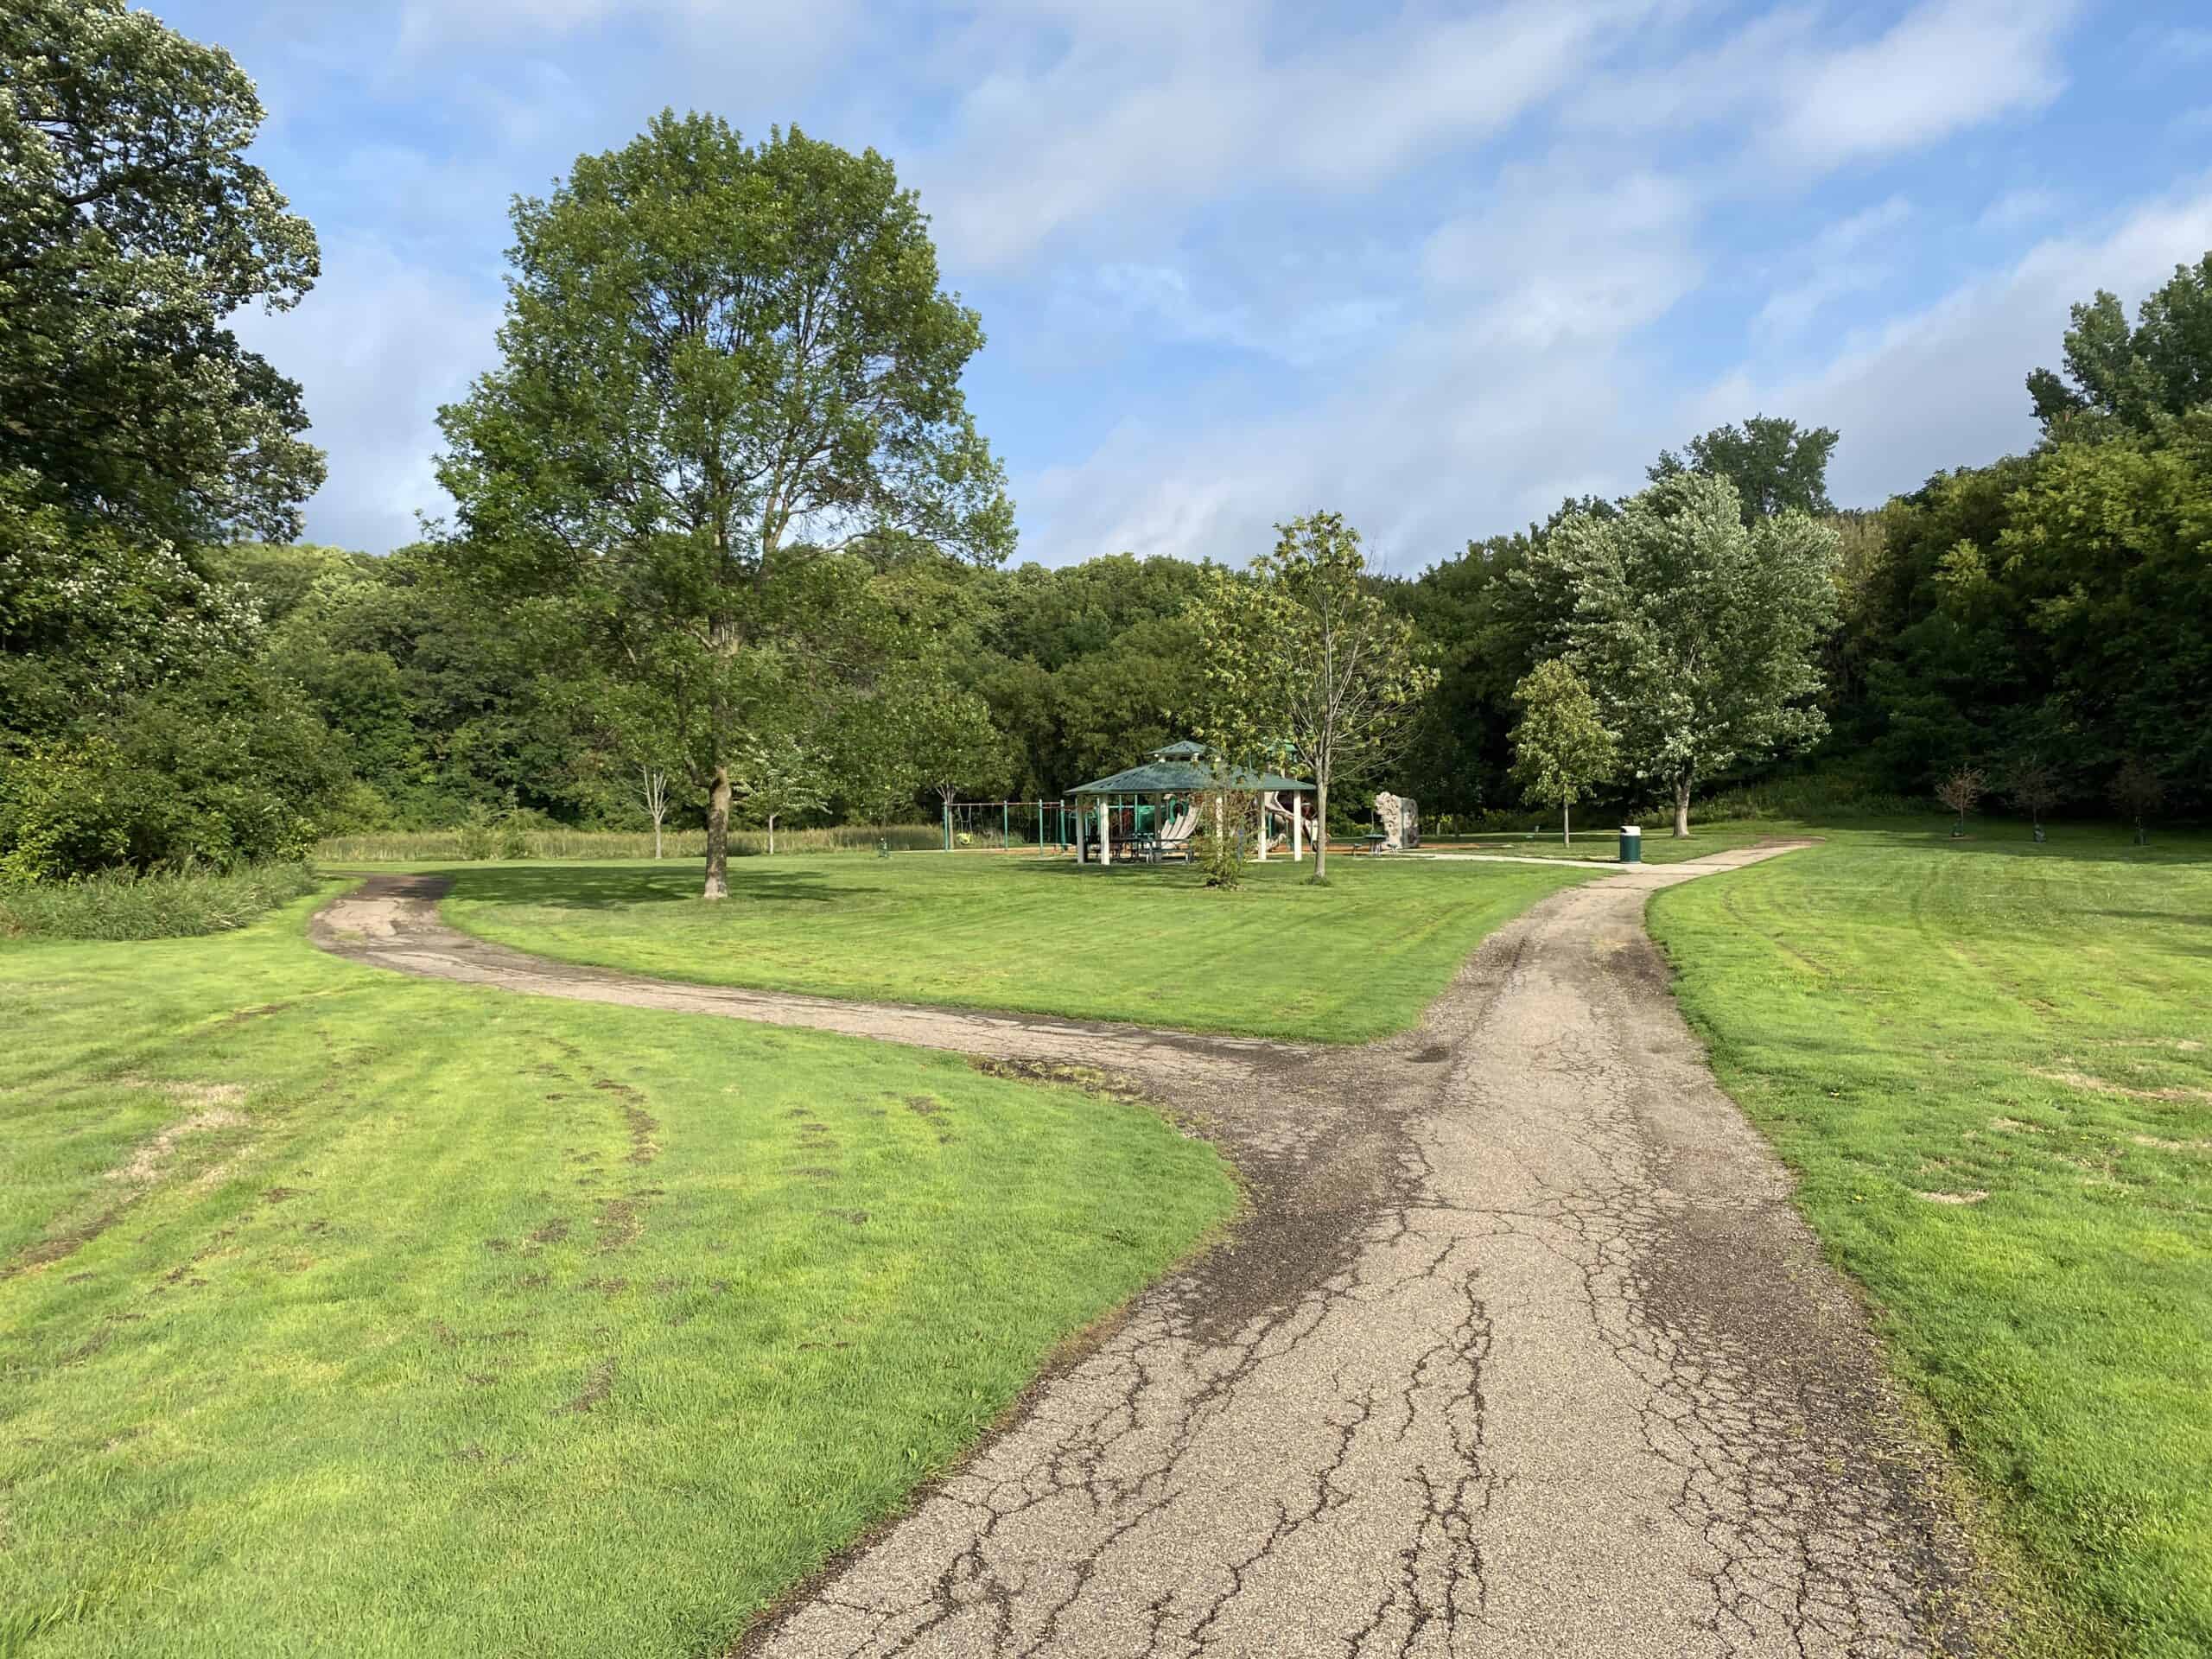
- Median home value: $488,000
- Homes worth over $1 million: 8.2%
- Homeownership rate: 86.6%
- Median household income: $131,633
- Total population: 25,868
1. Edina
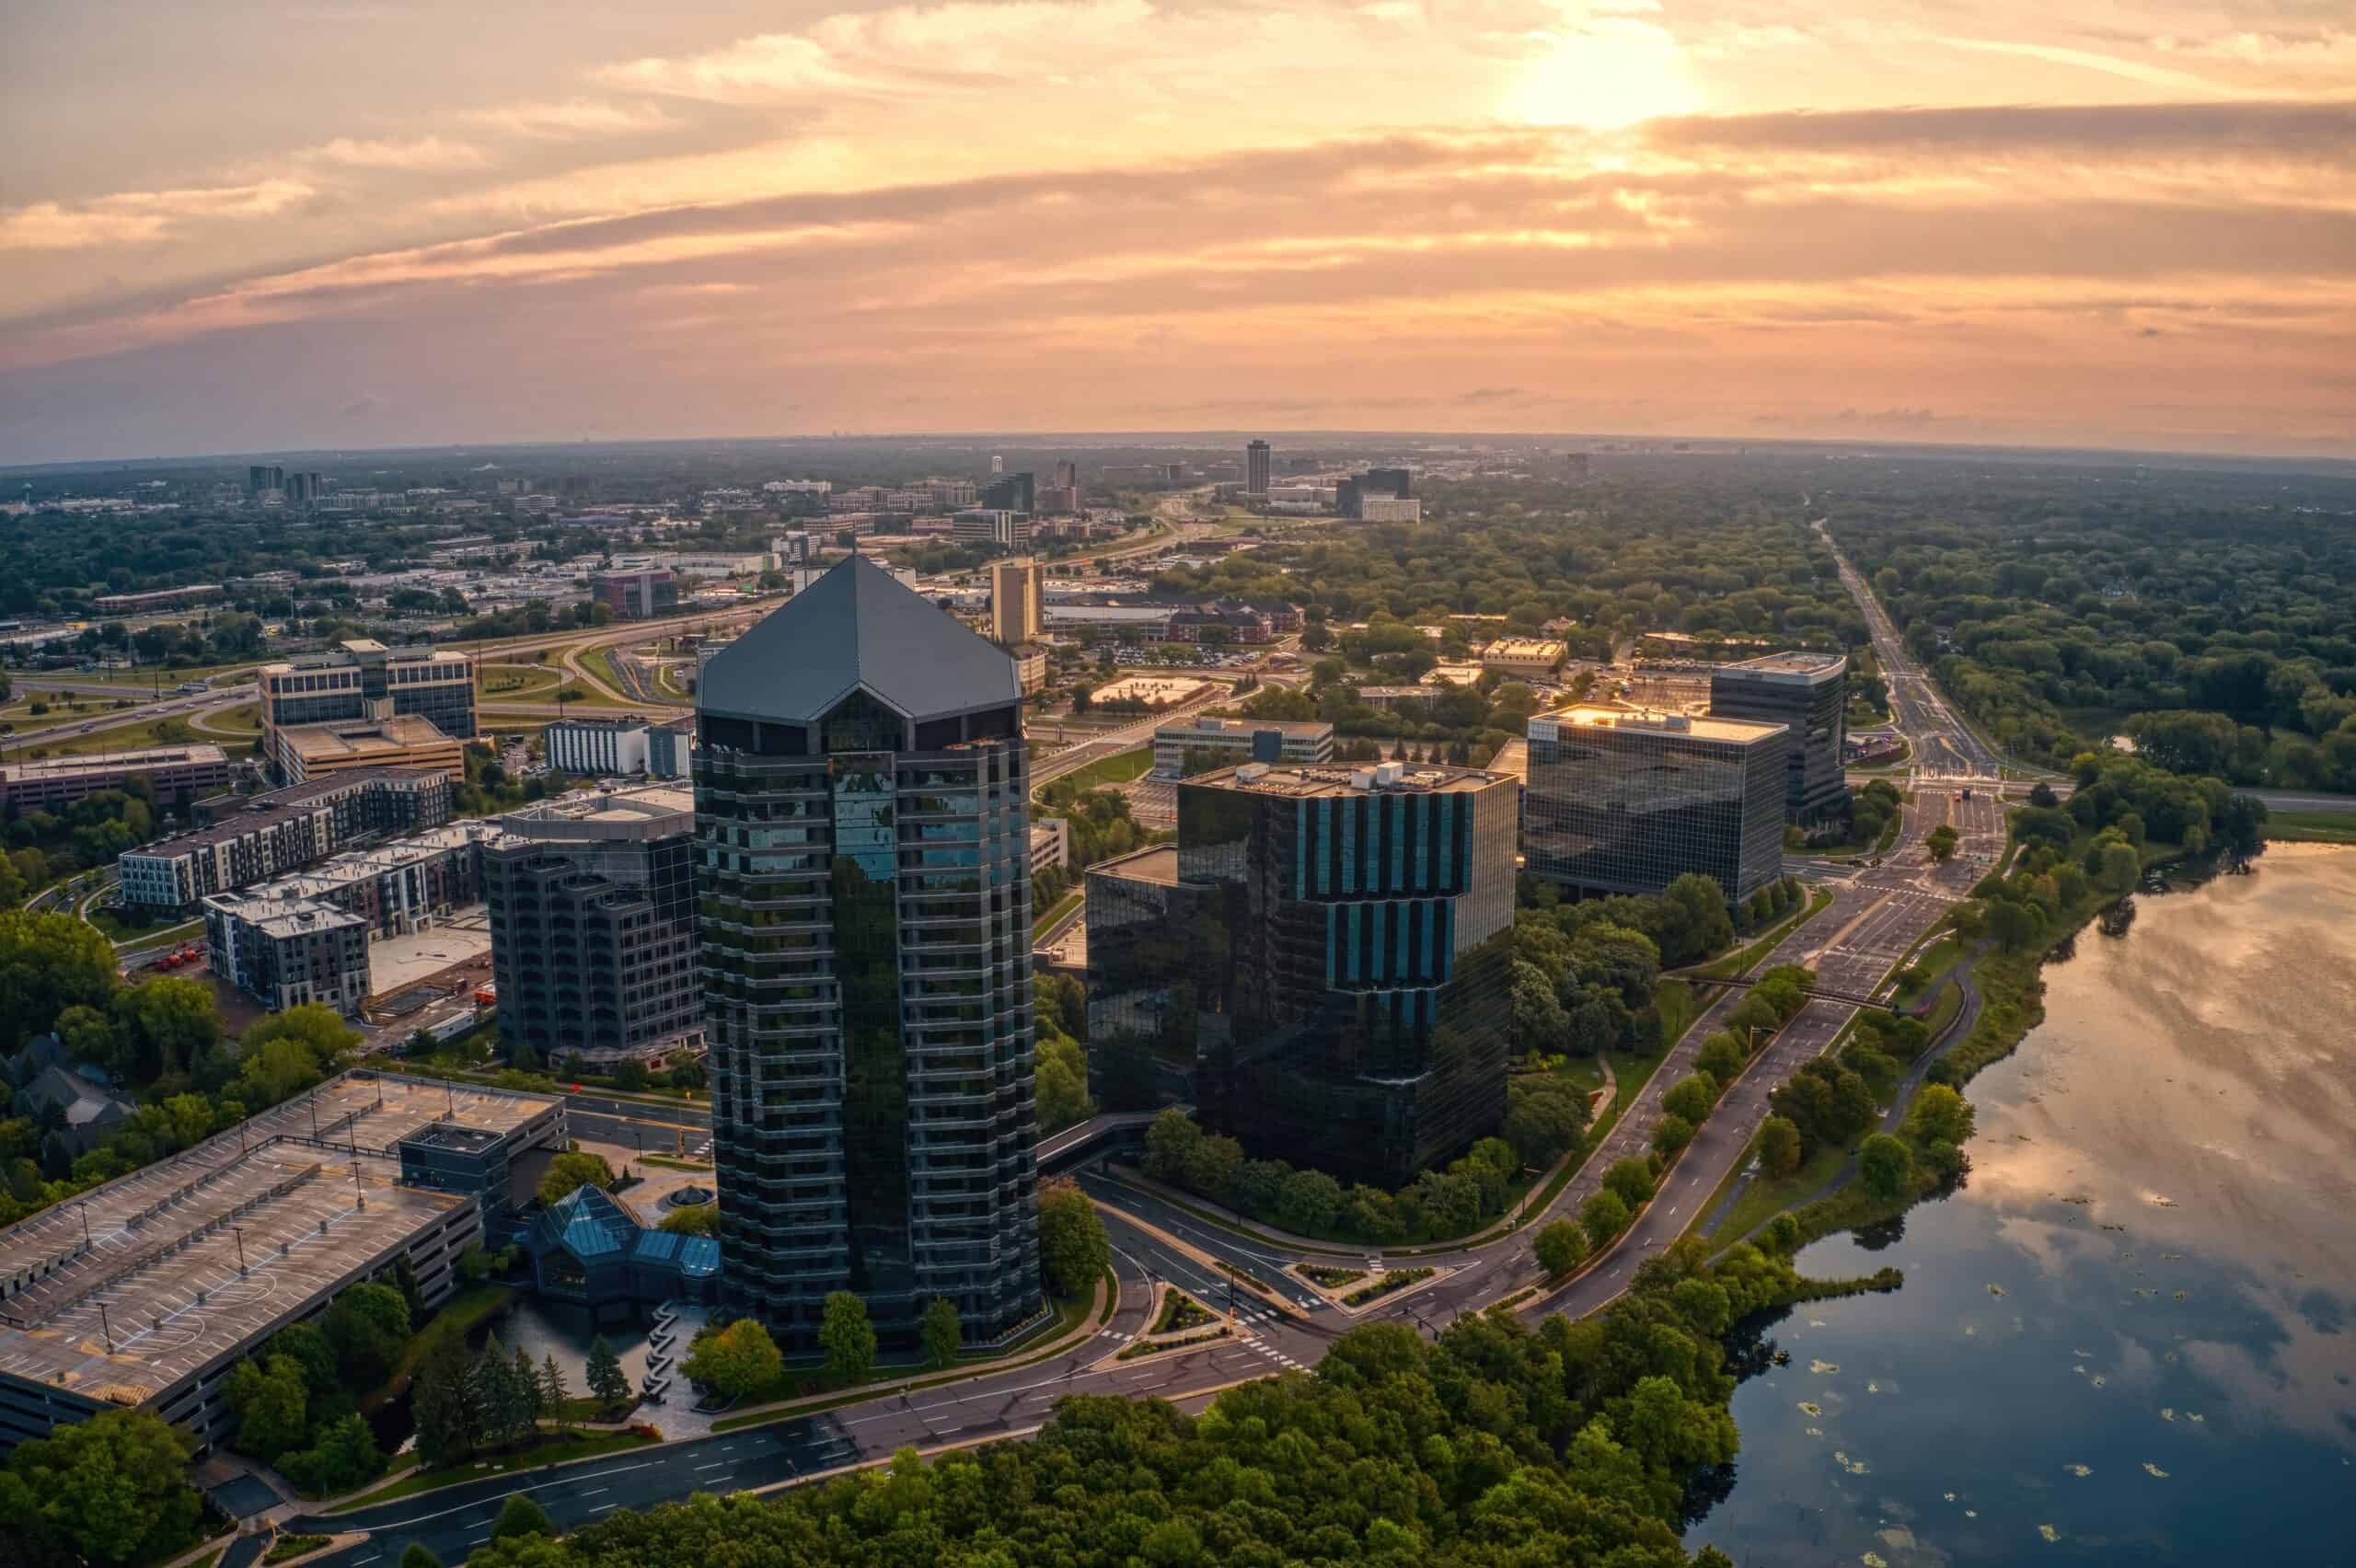
- Median home value: $601,700
- Homes worth over $1 million: 17.5%
- Homeownership rate: 70.9%
- Median household income: $125,506
- Total population: 53,037
| Rank | Places in Minnesota with at least 25,000 residents | Median home value ($) | Homeownership rate (%) | Median household income ($) | Total Population |
|---|---|---|---|---|---|
| 1 | Edina | 601,700 | 70.9 | 125,506 | 53,037 |
| 2 | Chanhassen | 488,000 | 86.6 | 131,633 | 25,868 |
| 3 | Plymouth | 447,600 | 74.6 | 130,131 | 79,918 |
| 4 | Eden Prairie | 442,200 | 76.3 | 129,345 | 63,623 |
| 5 | Minnetonka | 430,800 | 72.2 | 114,867 | 53,529 |
| 6 | Woodbury | 409,900 | 80.0 | 125,097 | 75,549 |
| 7 | Prior Lake | 400,500 | 86.2 | 129,539 | 27,608 |
| 8 | Lakeville | 395,900 | 87.4 | 129,069 | 70,696 |
| 9 | Maple Grove | 379,800 | 83.6 | 127,001 | 70,110 |
| 10 | Rosemount | 378,500 | 86.7 | 127,252 | 25,993 |
| 11 | Savage | 377,600 | 85.7 | 123,069 | 32,441 |
| 12 | Andover | 370,200 | 93.7 | 123,054 | 32,639 |
| 13 | Eagan | 362,200 | 70.3 | 104,101 | 68,262 |
| 14 | Chaska | 359,700 | 70.0 | 99,988 | 27,764 |
| 15 | St. Louis Park | 357,900 | 58.7 | 94,263 | 49,500 |
| 16 | Shoreview | 349,300 | 83.4 | 106,153 | 26,846 |
| 17 | Shakopee | 348,300 | 73.1 | 103,924 | 44,135 |
| 18 | Inver Grove Heights | 337,200 | 73.7 | 98,719 | 35,673 |
| 19 | Cottage Grove | 337,000 | 88.1 | 117,673 | 39,274 |
| 20 | Ramsey | 334,200 | 84.8 | 110,212 | 27,774 |
| 21 | Apple Valley | 333,300 | 75.6 | 97,588 | 55,594 |
| 22 | Minneapolis | 328,700 | 48.1 | 76,332 | 426,877 |
| 23 | Bloomington | 327,100 | 67.0 | 87,381 | 89,244 |
| 24 | Roseville | 318,400 | 69.1 | 87,702 | 36,066 |
| 25 | Burnsville | 315,700 | 68.2 | 85,801 | 64,075 |
| 26 | Elk River | 305,700 | 78.5 | 95,597 | 25,936 |
| 27 | Blaine | 303,800 | 85.3 | 100,659 | 70,047 |
| 28 | Richfield | 294,000 | 61.7 | 80,712 | 36,809 |
| 29 | Brooklyn Park | 289,400 | 69.2 | 82,271 | 84,951 |
| 30 | Oakdale | 288,700 | 77.2 | 86,003 | 28,029 |
| 31 | Maplewood | 282,000 | 72.1 | 86,769 | 41,405 |
| 32 | Rochester | 268,800 | 65.5 | 83,973 | 120,848 |
| 33 | Coon Rapids | 268,500 | 74.8 | 85,445 | 63,296 |
| 34 | St. Paul | 264,900 | 53.0 | 69,919 | 308,806 |
| 35 | Fridley | 257,100 | 60.9 | 76,592 | 29,731 |
| 36 | Brooklyn Center | 240,800 | 61.0 | 70,692 | 33,109 |
| 37 | Mankato | 236,200 | 49.6 | 61,726 | 44,444 |
| 38 | Moorhead | 234,300 | 57.8 | 68,680 | 44,443 |
| 39 | Owatonna | 216,700 | 73.7 | 78,295 | 26,400 |
| 40 | Duluth | 209,800 | 60.6 | 63,545 | 86,772 |
| 41 | St. Cloud | 189,600 | 48.2 | 58,910 | 68,910 |
| 42 | Winona | 176,600 | 57.8 | 52,500 | 26,083 |
| 43 | Austin | 139,100 | 68.3 | 61,667 | 26,156 |
Travel Cards Are Getting Too Good To Ignore (sponsored)
Credit card companies are pulling out all the stops, with the issuers are offering insane travel rewards and perks.
We’re talking huge sign-up bonuses, points on every purchase, and benefits like lounge access, travel credits, and free hotel nights. For travelers, these rewards can add up to thousands of dollars in flights, upgrades, and luxury experiences every year.
It’s like getting paid to travel — and it’s available to qualified borrowers who know where to look.
We’ve rounded up some of the best travel credit cards on the market. Click here to see the list. Don’t miss these offers — they won’t be this good forever.
Thank you for reading! Have some feedback for us?
Contact the 24/7 Wall St. editorial team.

