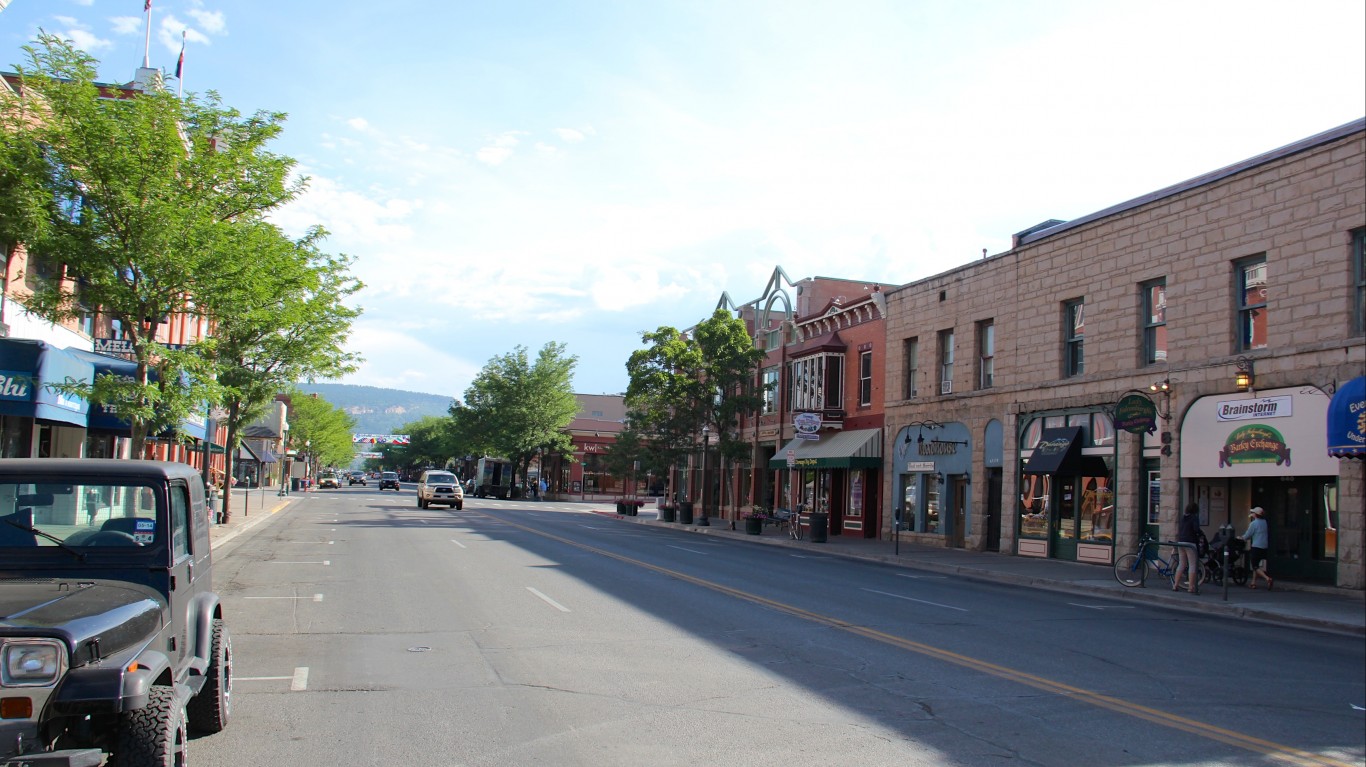
Home prices are at an all-time high in the United States. After rising year-over-year for 11 consecutive months, the median sale price of existing homes hit a record-breaking $419,300 in May 2024, according to a new report from the National Association of Realtors.
High prices are largely attributable to a lack of inventory, as high mortgage rates are keeping many would-be buyers and sellers out of the market. In September 2022, for the first time in nearly a decade and a half, the average interest on a 30-year fixed-rate mortgage topped 6% — and it has remained above that threshold ever since. According to Freddie Mac, the average mortgage rate stood at 6.9% as of mid-June.
With home prices steadily rising and mortgage rates at historic highs, homeownership is no longer affordable for a growing share of the population. A recent report from the Joint Center for Housing Studies of Harvard University found that only one-in-seven renters can afford to buy a typical first home. (Here is a look at how big a house $200,000 can get you in every state.)
Notably, however, housing prices are subject to a number of factors that can be isolated from broader market forces — and location is one of them. Even as many parts of the country are reporting a surge in list prices, there are also many American cities bucking the trend. In these places, home prices are substantially lower now than they were a year ago.
Using metro area-level data from Realtor.com, 24/7 Wall St. identified the U.S. housing markets where home prices are actually falling. Metro areas are ranked on the percent change in median listing prices between May 2023 and May 2024. Only cities with at least 100 listings in May of this year and last were considered. Cities with data outside of the typical margin of error were excluded from analysis.
In each of the 29 U.S. metro areas on this list, home prices have fallen by at least 7% year-over-year. These cities are spread across the Midwest, the South, and the West. Only one is in the Northeast.
Just as an increasingly short supply of homes on the market is driving up prices nationwide, falling prices in these cities are likely linked to growing inventory. In 25 of the 29 metro areas on this list, the total number of listed homes is up year-over-year by anywhere from about 5% to nearly 140%.
Even though these housing markets are more affordable now than were a year ago, many of them are still prohibitively expensive for prospective buyers on a budget. In seven of these cities, the median list price exceeded $500,000 in May 2024 — including two where most homes are listed for over $1 million. (Here is a look at the cities where most people cannot afford a new home.)
Why It Matters
Widely seen as a cornerstone of the American dream, homeownership has also historically been a reliable means of building wealth. However, rising home values and borrowing costs have priced large segments of the population out of the market in recent years. The state of the housing market is not only impacting individuals and families, but also the broader economy. Residential investment accounts for as much as 5% of U.S. gross domestic product, and since mid-2020, the volume of new home sales in the U.S. has fallen by 39%.
29. Watertown, SD
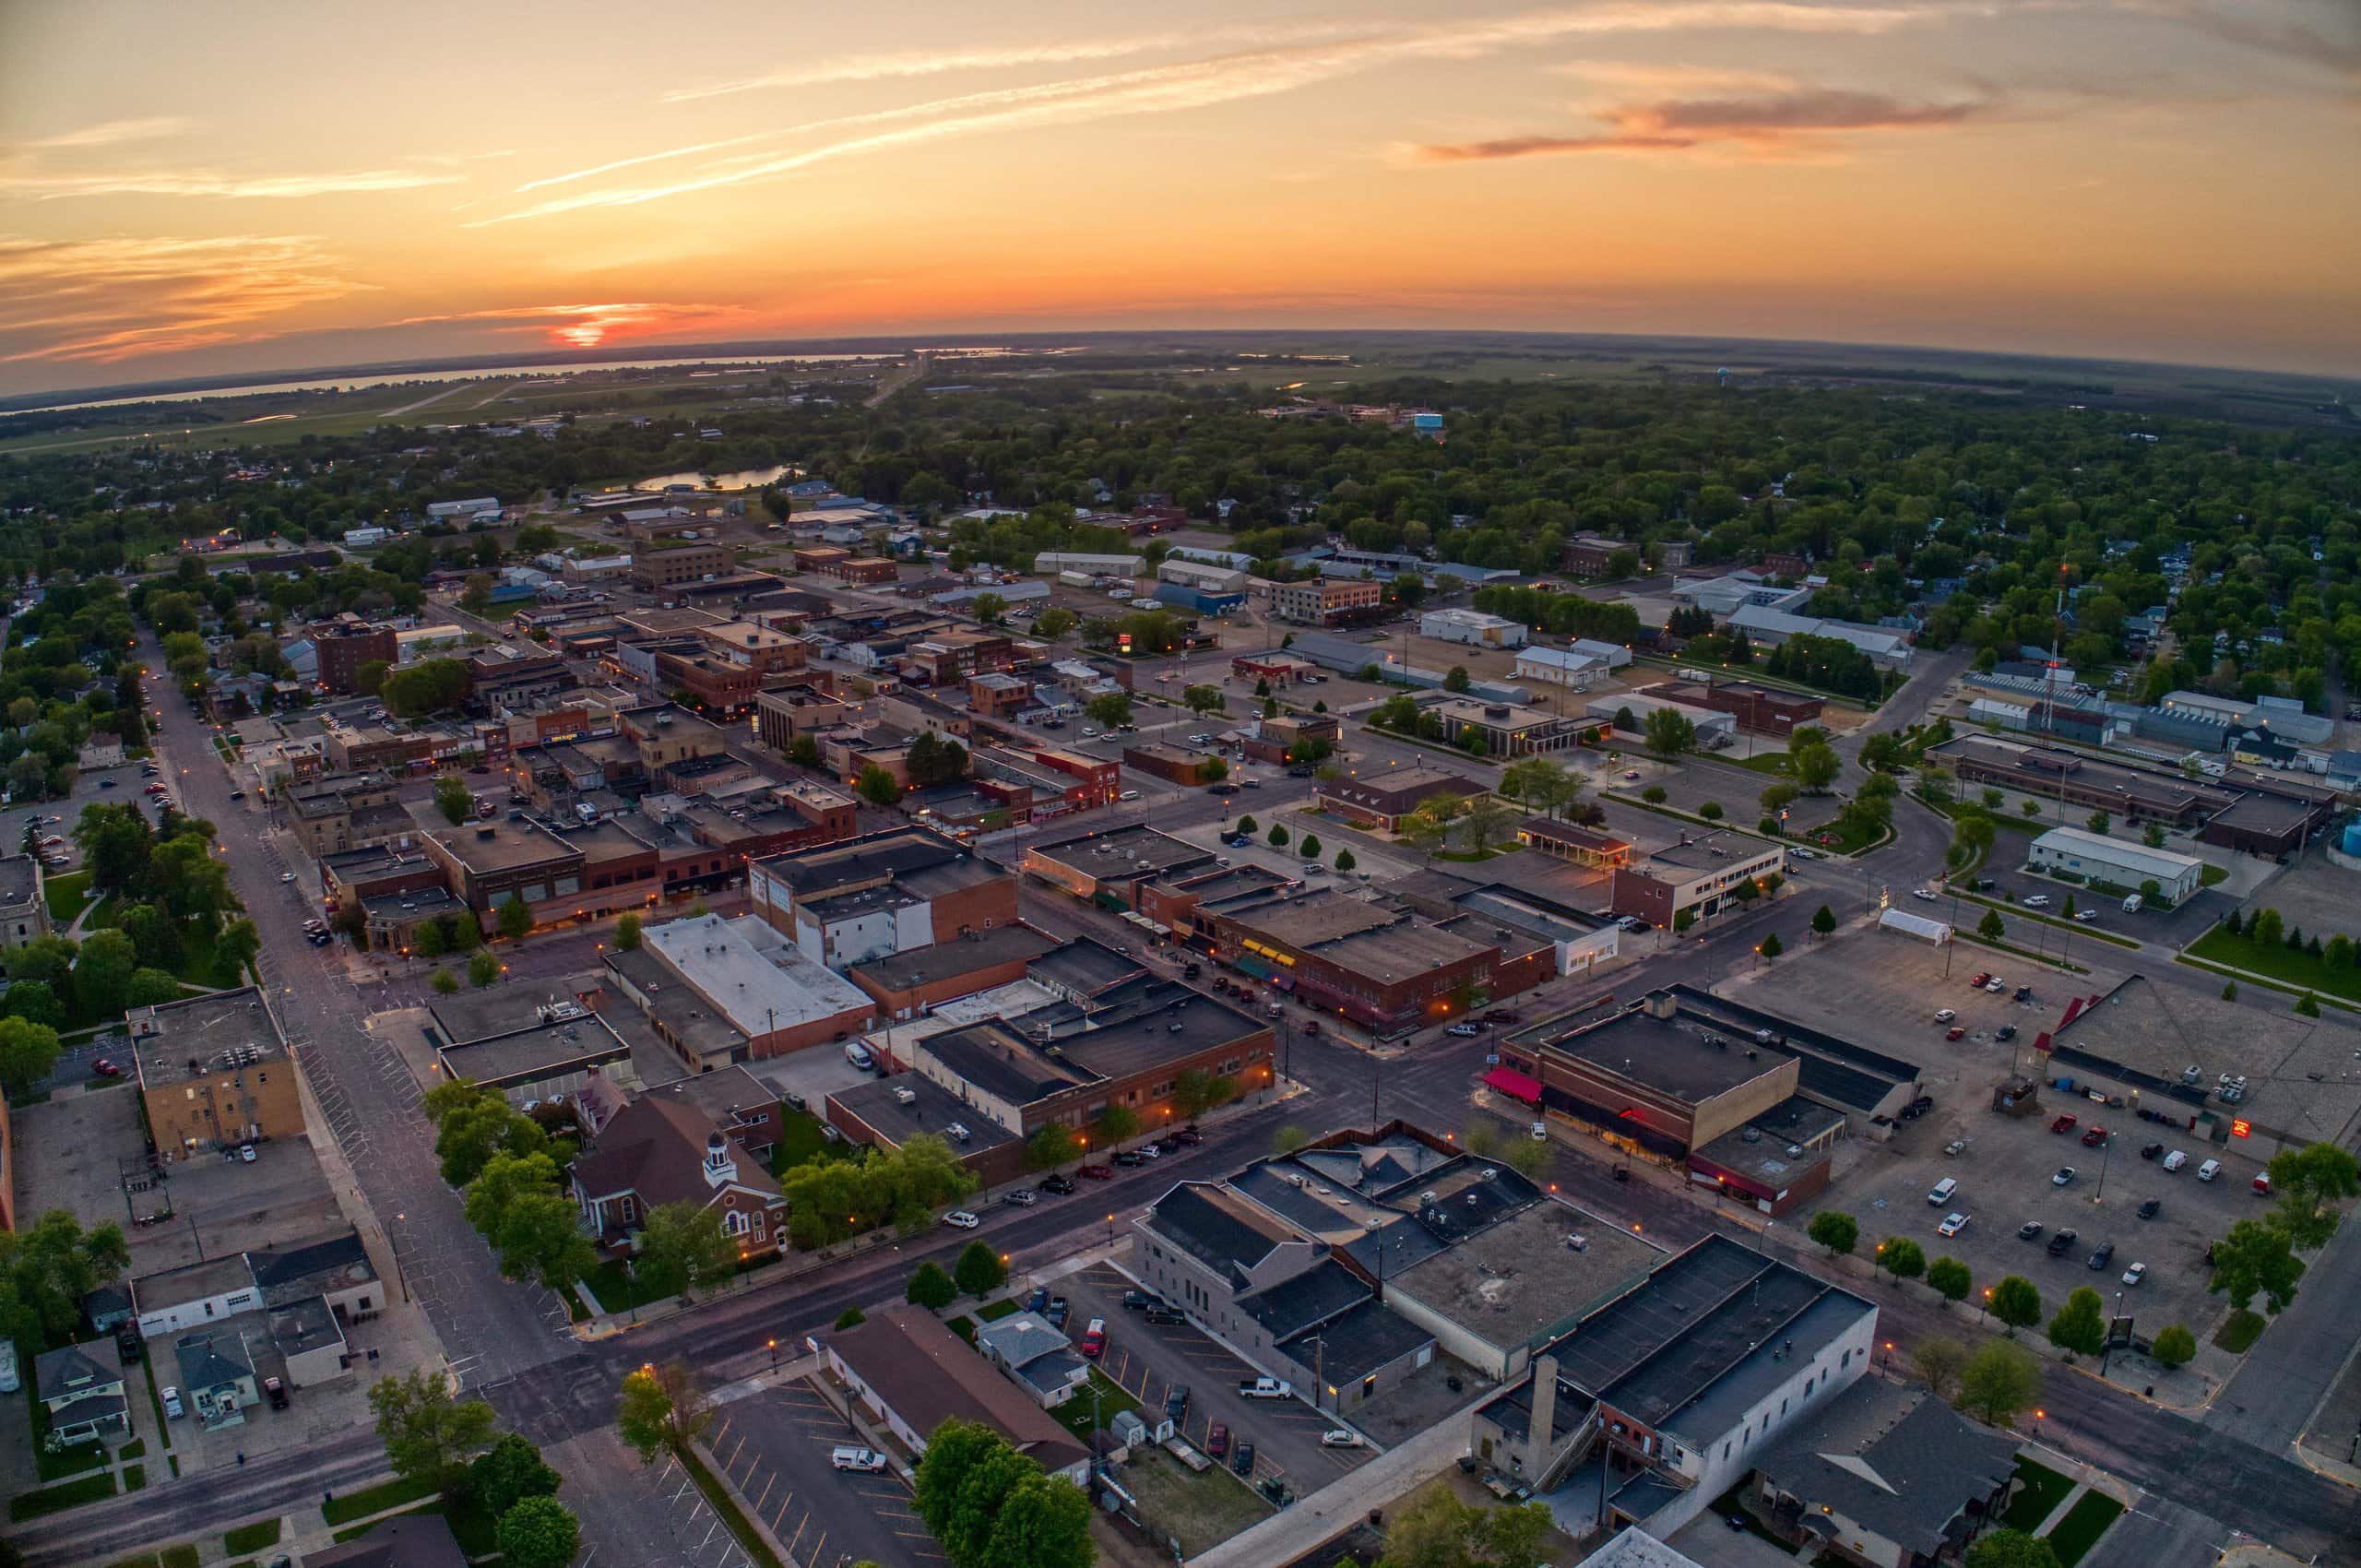
- Year-over-year change in median list price: -7.1% (-$28,225)
- Median list price in May 2024: $371,000 ($240 per square foot)
- Size of a typical listed home in May 2024: 1,467 square feet
- Number of listed homes in May 2024: 113
28. Victoria, TX

- Year-over-year change in median list price: -7.2% (-$23,700)
- Median list price in May 2024: $304,950 ($159 per square foot)
- Size of a typical listed home in May 2024: 1,938 square feet
- Number of listed homes in May 2024: 279 (-0.2% YoY)
27. Cape Girardeau, MO-IL
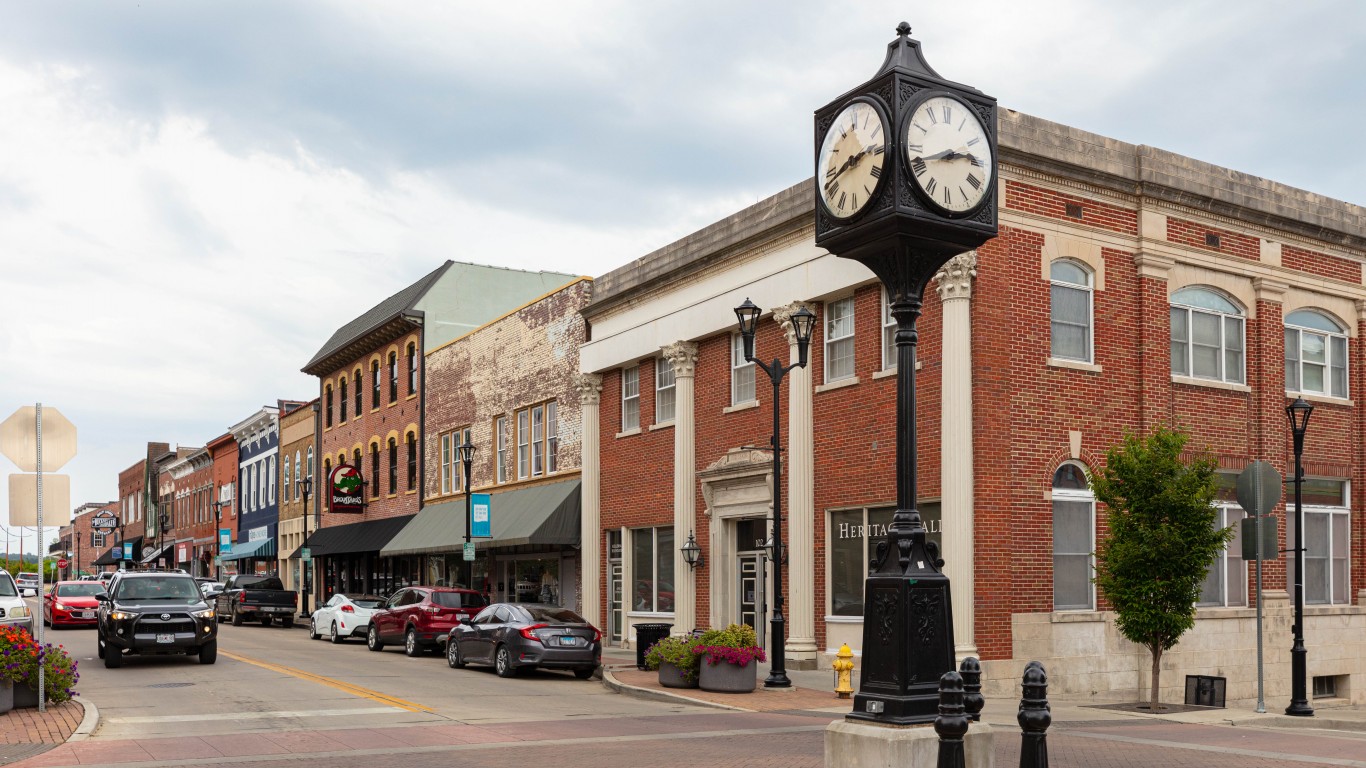
- Year-over-year change in median list price: -7.3% (-$21,225)
- Median list price in May 2024: $268,450 ($129 per square foot)
- Size of a typical listed home in May 2024: 1,916 square feet
- Number of listed homes in May 2024: 313 (+5.9% YoY)
26. Durango, CO
- Year-over-year change in median list price: -7.4% (-$65,453)
- Median list price in May 2024: $825,000 ($467 per square foot)
- Size of a typical listed home in May 2024: 2,028 square feet
- Number of listed homes in May 2024: 367 (+42.9% YoY)
25. Tullahoma-Manchester, TN
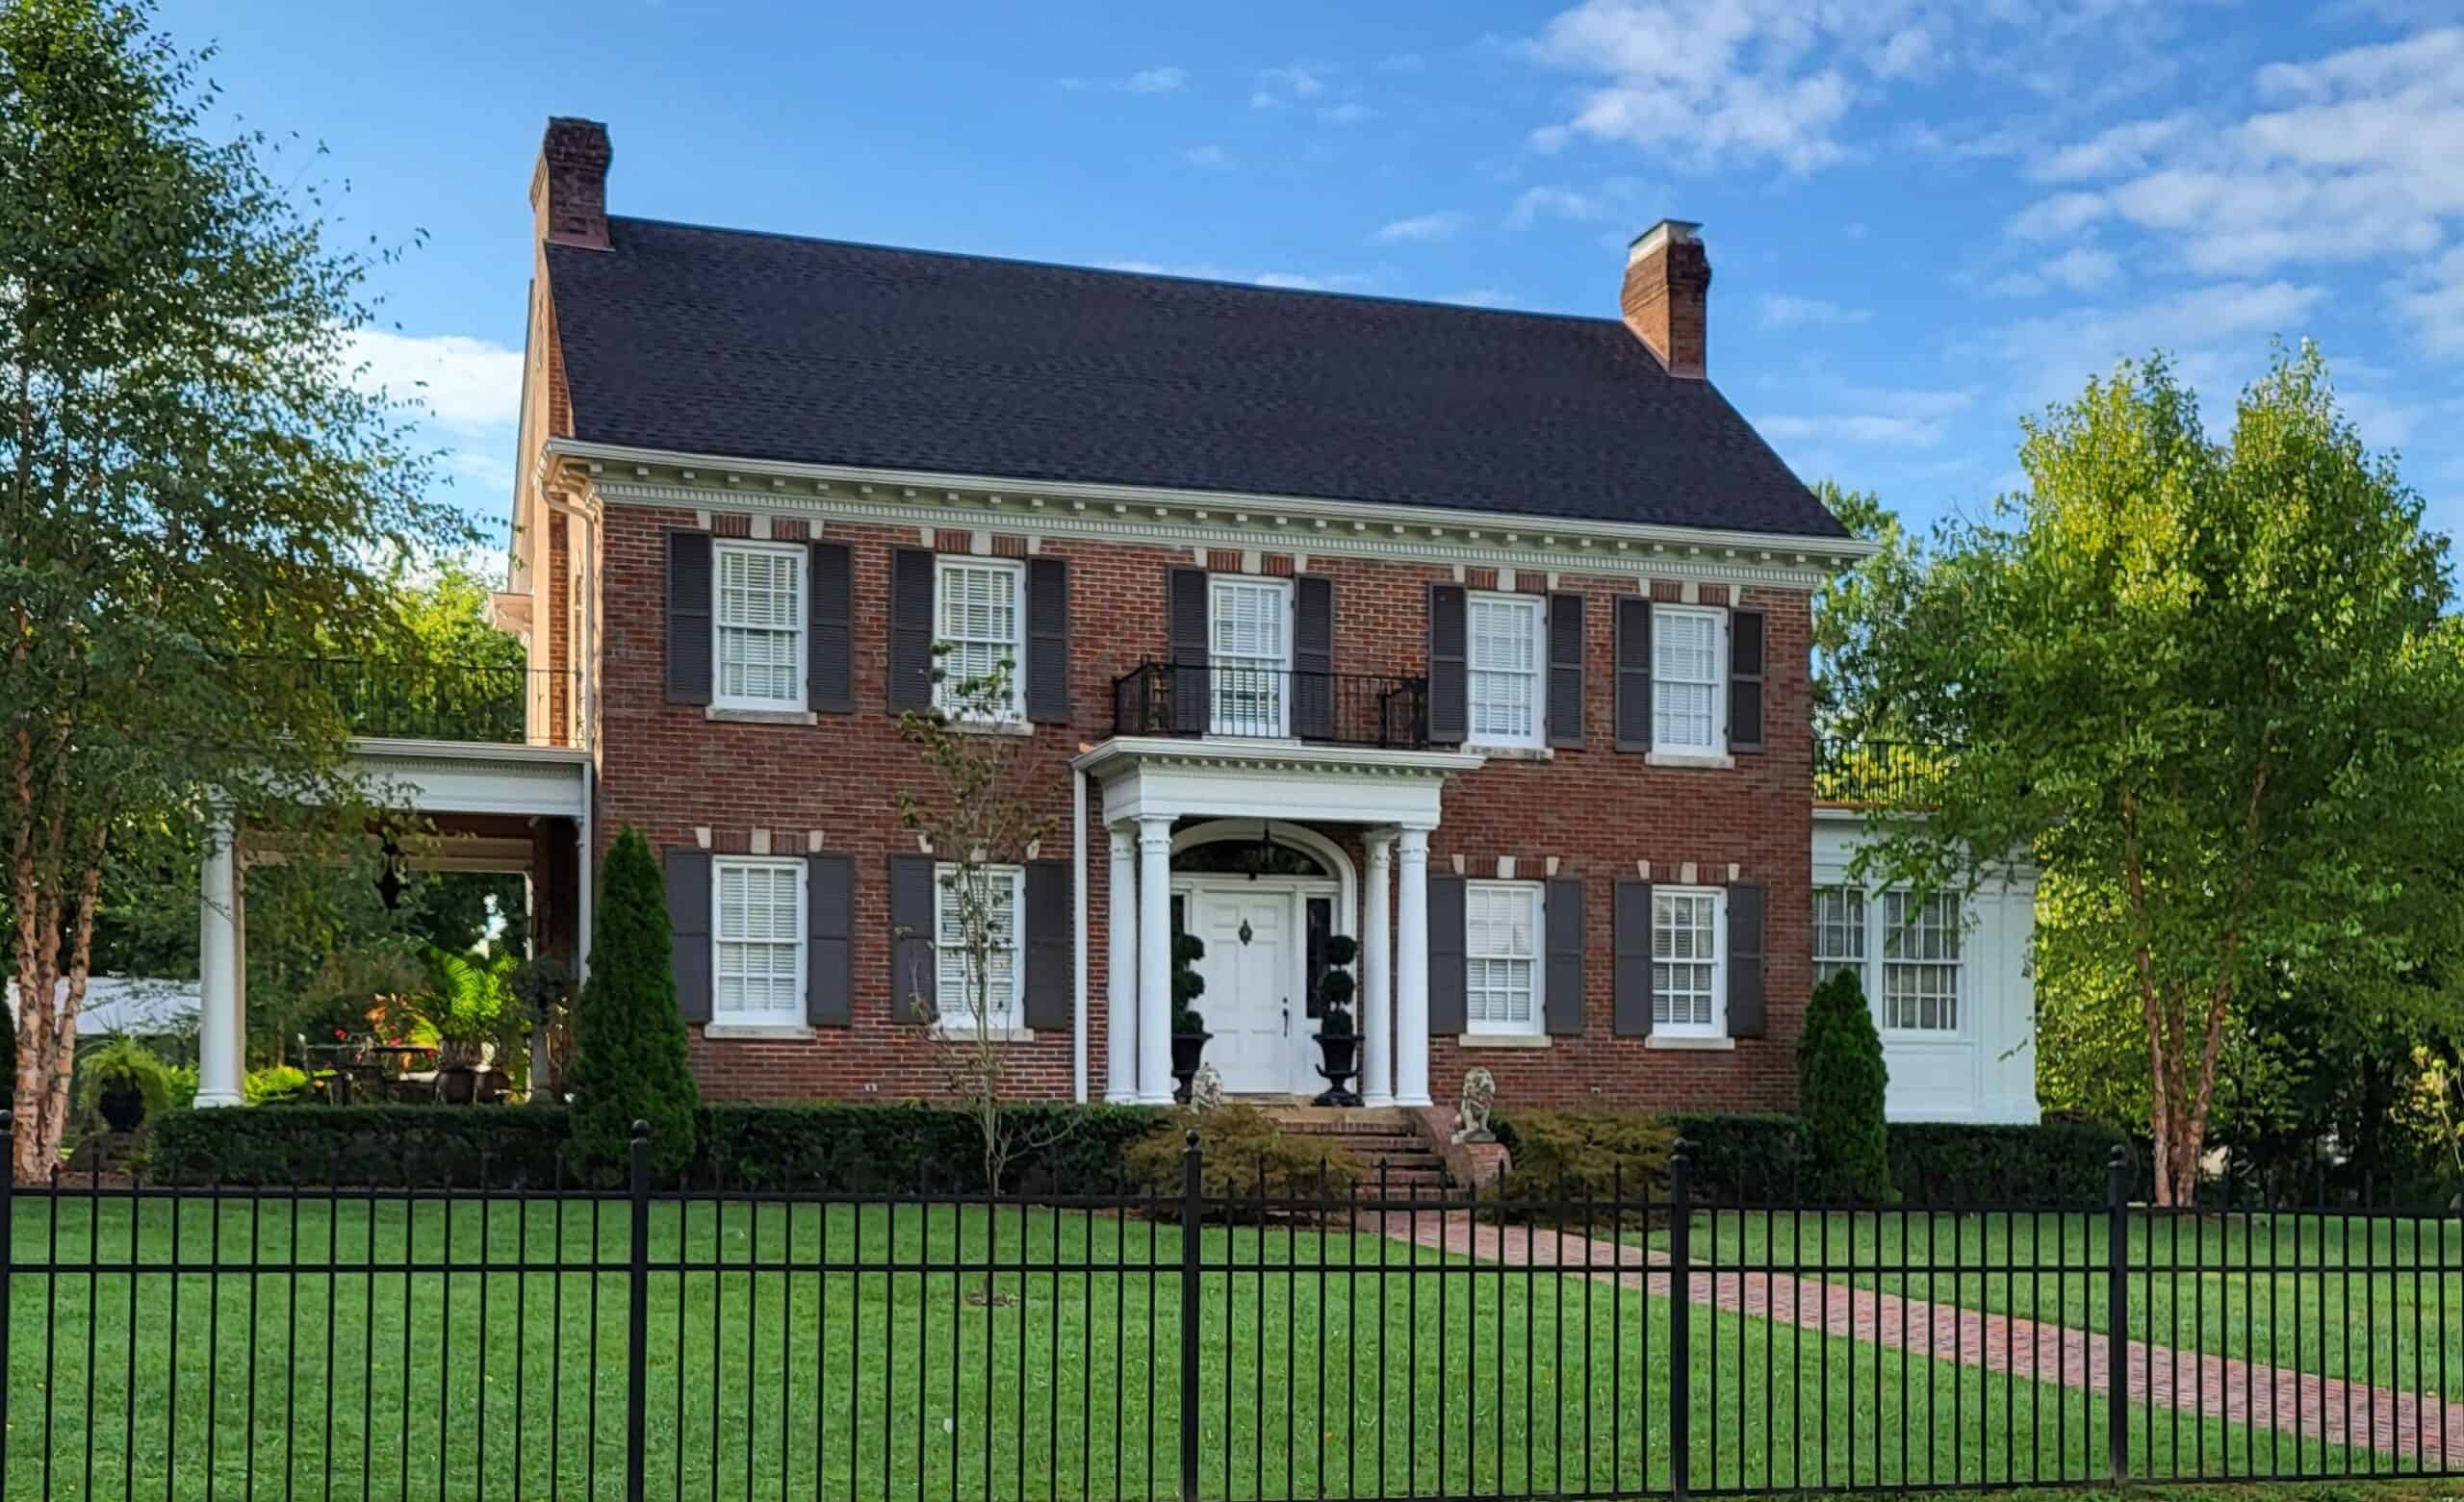
- Year-over-year change in median list price: -7.4% (-$35,475)
- Median list price in May 2024: $444,425 ($214 per square foot)
- Size of a typical listed home in May 2024: 2,068 square feet
- Number of listed homes in May 2024: 559 (+14.9% YoY)
24. South Bend-Mishawaka, IN-MI
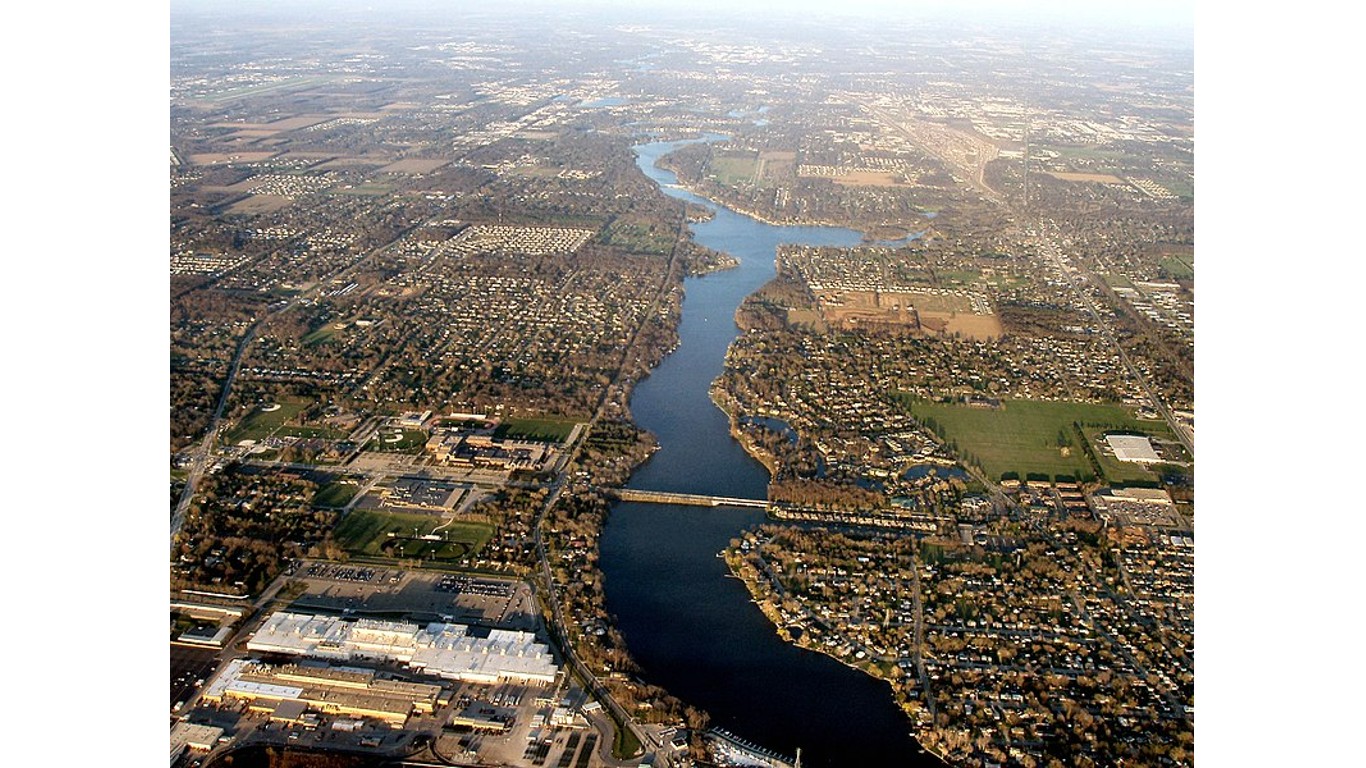
- Year-over-year change in median list price: -7.4% (-$23,950)
- Median list price in May 2024: $299,500 ($157 per square foot)
- Size of a typical listed home in May 2024: 1,733 square feet
- Number of listed homes in May 2024: 1,025 (+95.7% YoY)
23. Fort Morgan, CO
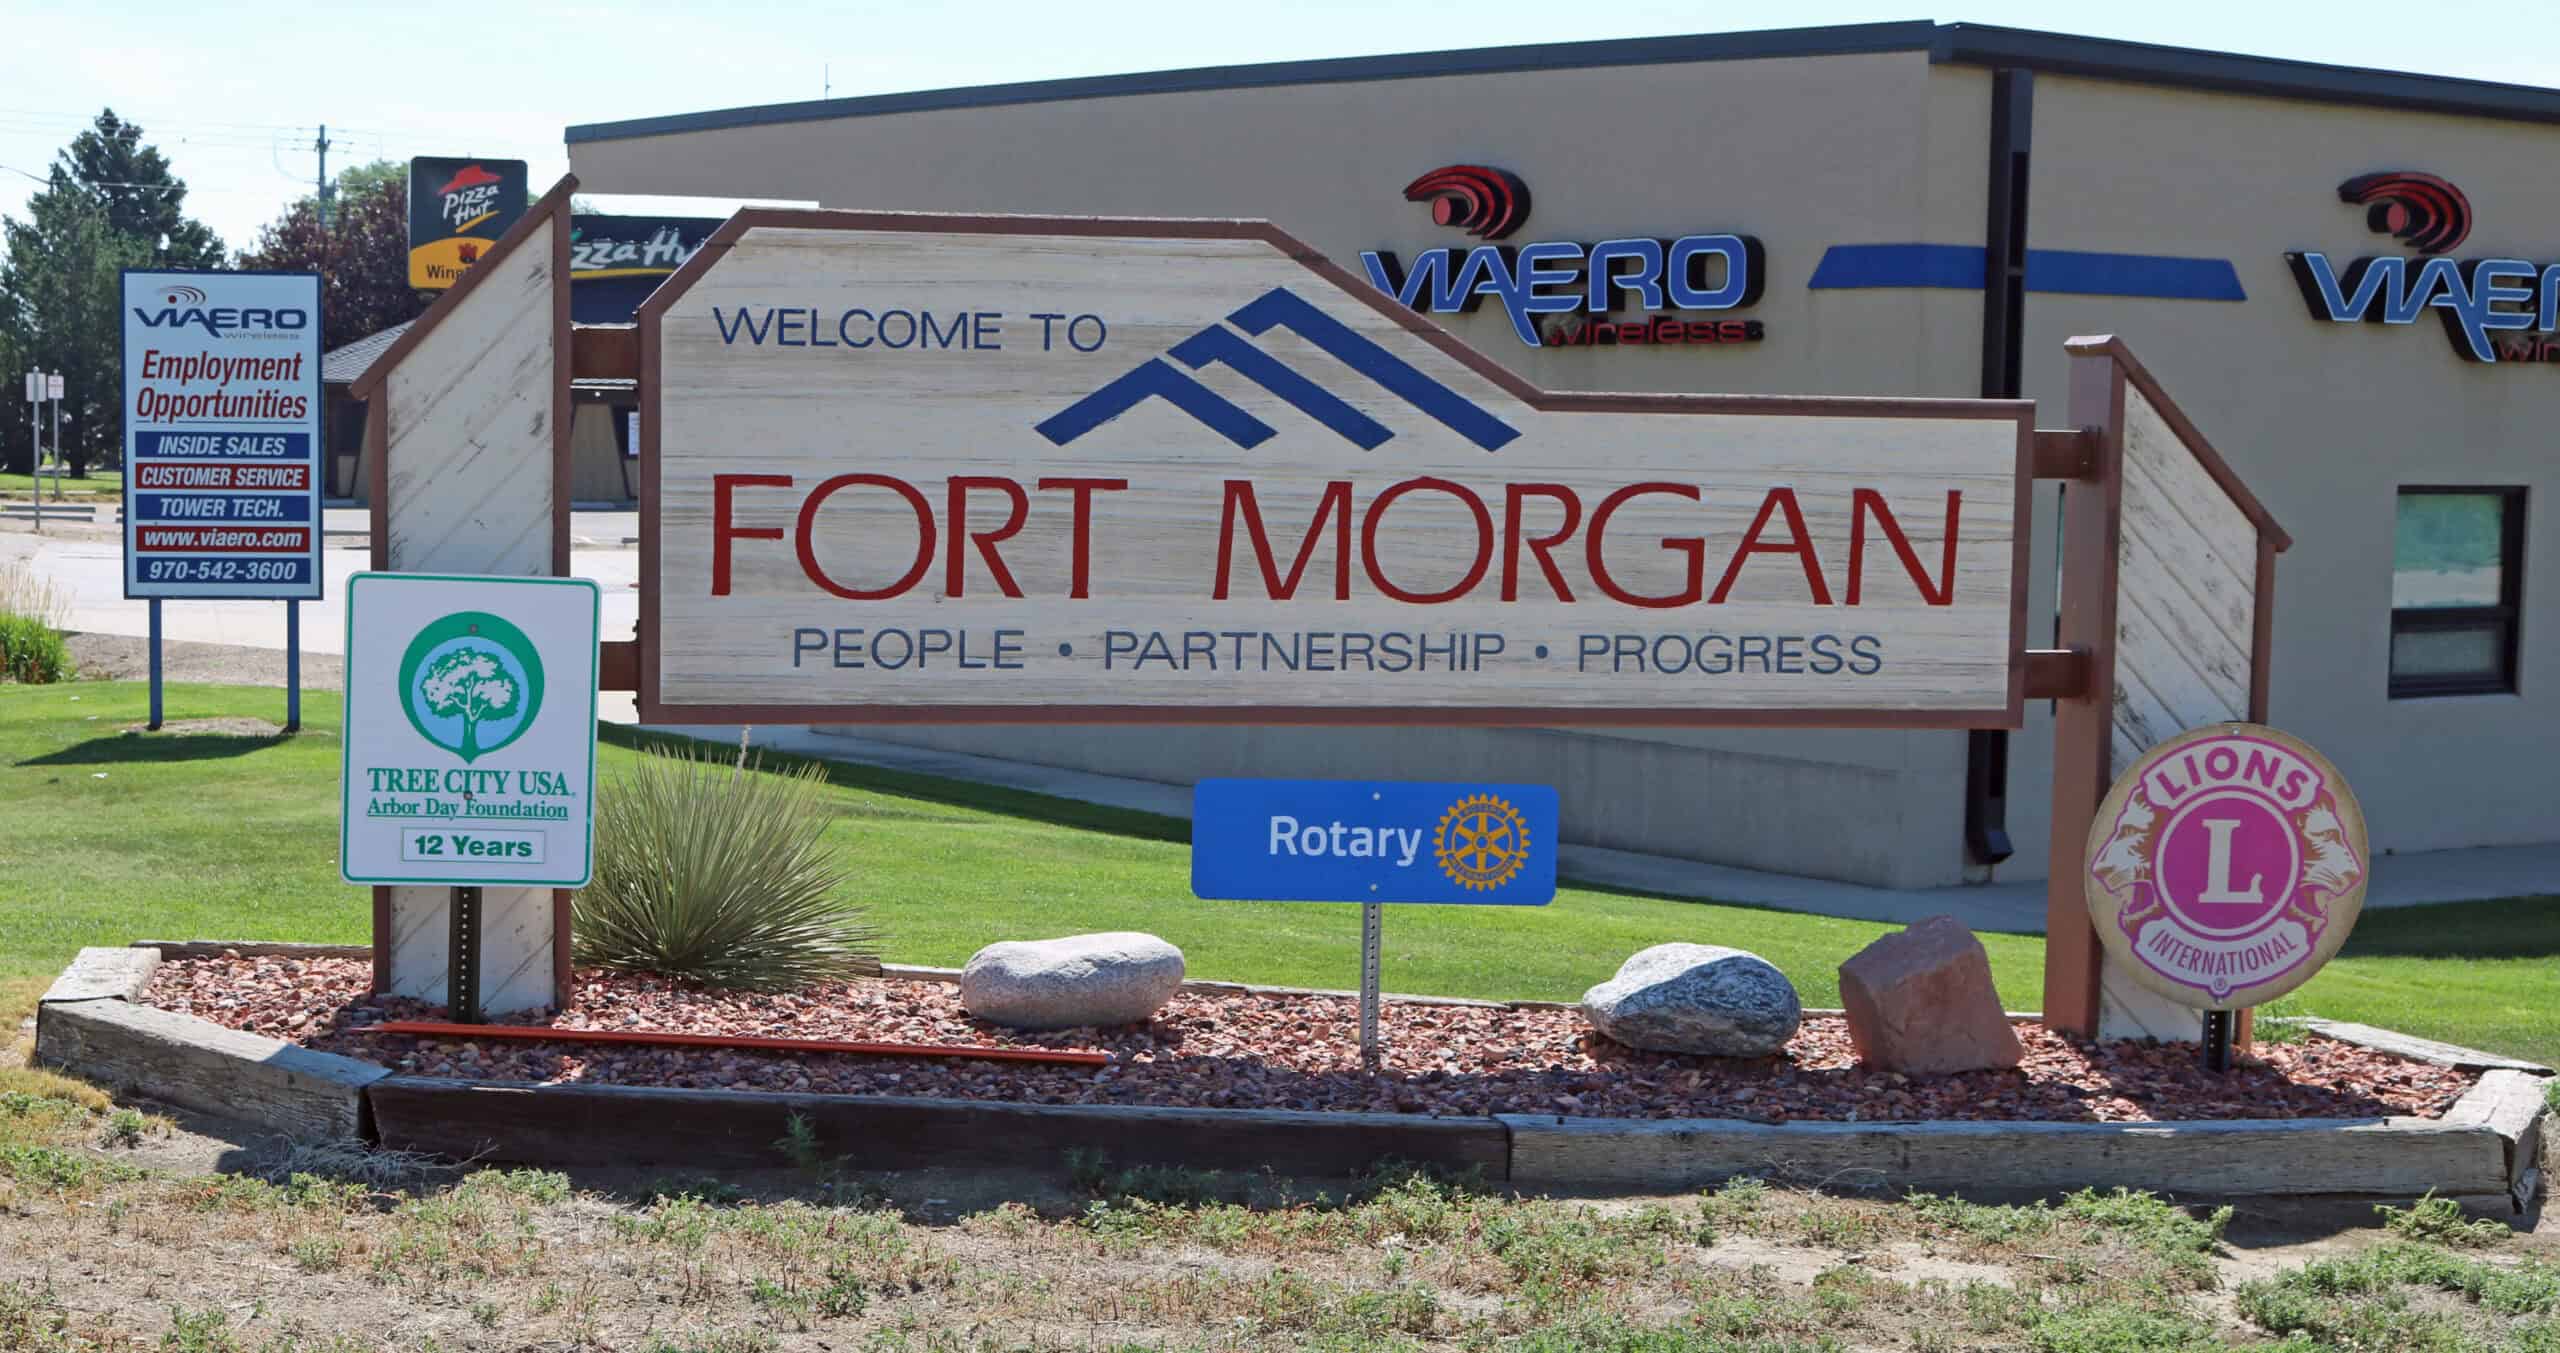
- Year-over-year change in median list price: -7.5% (-$30,500)
- Median list price in May 2024: $378,000 ($180 per square foot)
- Size of a typical listed home in May 2024: 2,249 square feet
- Number of listed homes in May 2024: 126 (-8.7% YoY)
22. Evansville, IN-KY
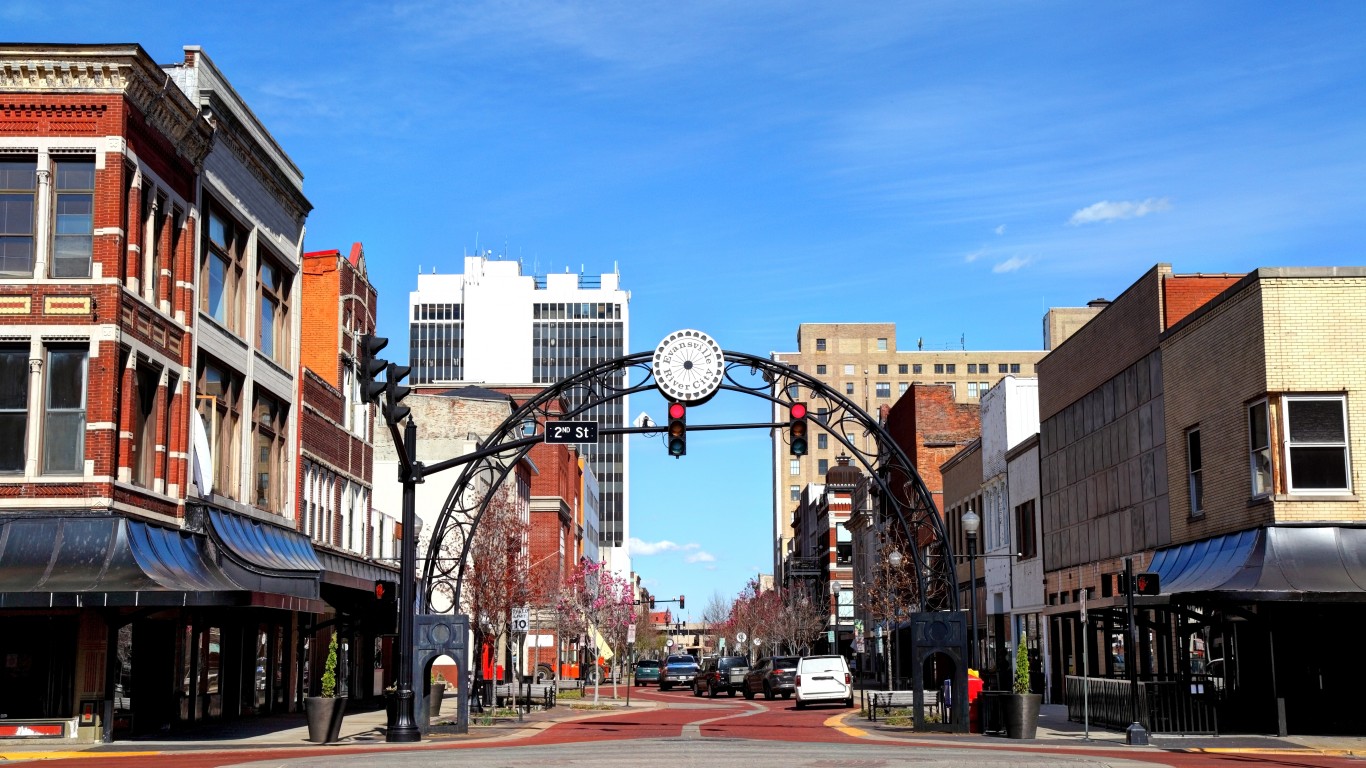
- Year-over-year change in median list price: -7.7% (-$21,200)
- Median list price in May 2024: $253,750 ($133 per square foot)
- Size of a typical listed home in May 2024: 1,881 square feet
- Number of listed homes in May 2024: 894 (+139.2% YoY)
21. Billings, MT
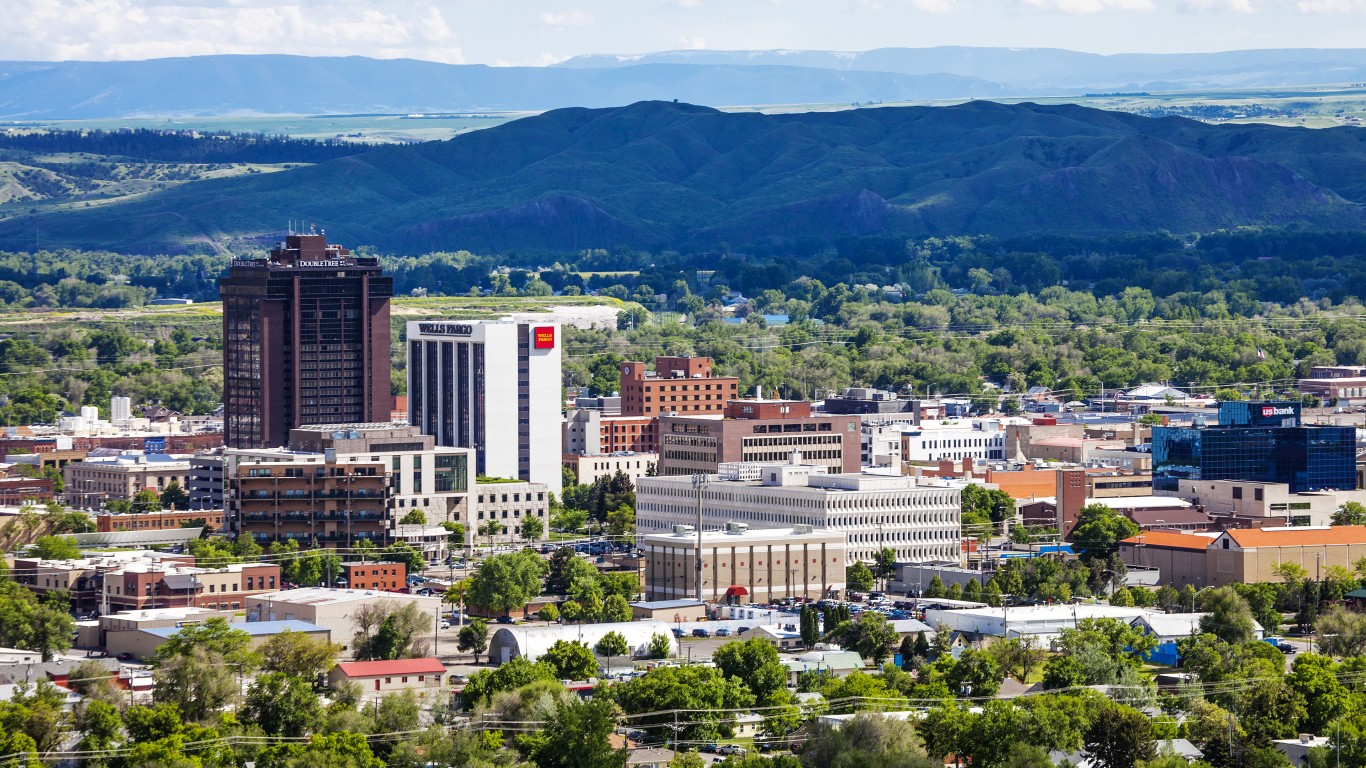
- Year-over-year change in median list price: -7.8% (-$42,550)
- Median list price in May 2024: $503,675 ($223 per square foot)
- Size of a typical listed home in May 2024: 2,309 square feet
- Number of listed homes in May 2024: 842 (+12.9% YoY)
20. Jonesboro, AR

- Year-over-year change in median list price: -7.8% (-$20,350)
- Median list price in May 2024: $239,450 ($141 per square foot)
- Size of a typical listed home in May 2024: 1,751 square feet
- Number of listed homes in May 2024: 643 (+32.3% YoY)
19. Ruidoso, NM

- Year-over-year change in median list price: -7.9% (-$43,750)
- Median list price in May 2024: $508,250 ($269 per square foot)
- Size of a typical listed home in May 2024: 2,004 square feet
- Number of listed homes in May 2024: 268 (+17.6% YoY)
18. Starkville, MS
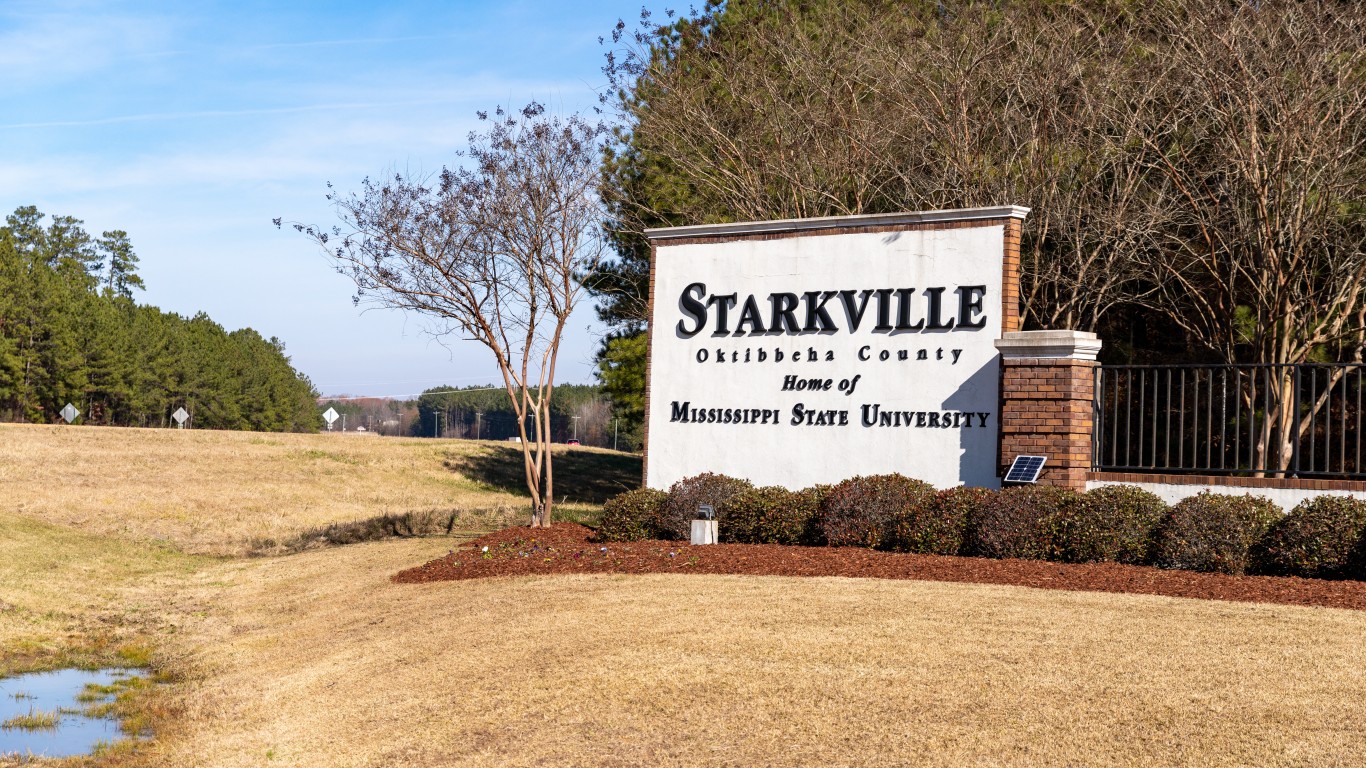
- Year-over-year change in median list price: -8.0% (-$32,775)
- Median list price in May 2024: $375,000 ($208 per square foot)
- Size of a typical listed home in May 2024: 1,814 square feet
- Number of listed homes in May 2024: 217 (+50.9% YoY)
17. Charleston, WV

- Year-over-year change in median list price: -8.2% (-$13,698)
- Median list price in May 2024: $153,250 ($103 per square foot)
- Size of a typical listed home in May 2024: 1,623 square feet
- Number of listed homes in May 2024: 647 (+21.5% YoY)
16. Pocatello, ID

- Year-over-year change in median list price: -8.3% (-$38,475)
- Median list price in May 2024: $423,750 ($182 per square foot)
- Size of a typical listed home in May 2024: 2,398 square feet
- Number of listed homes in May 2024: 397 (+15.9% YoY)
15. Gainesville, FL
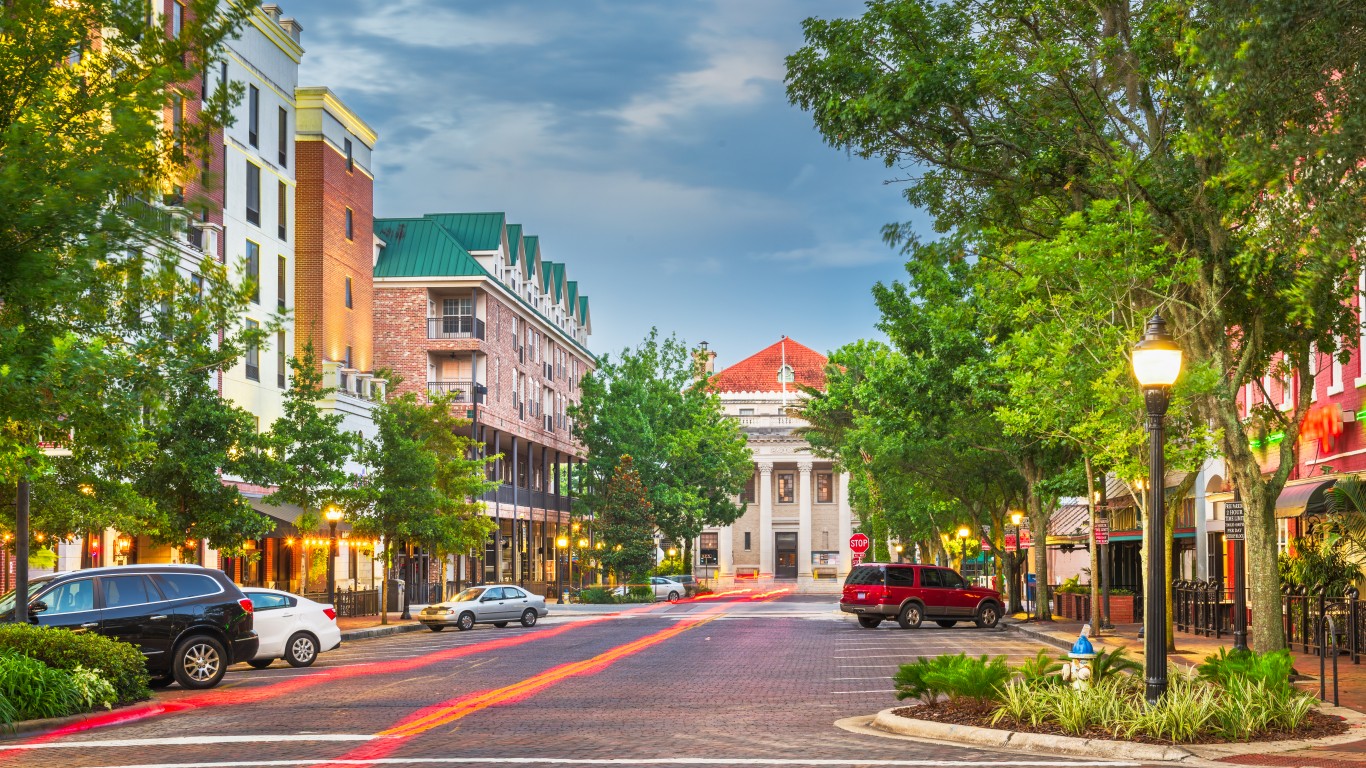
- Year-over-year change in median list price: -8.5% (-$33,700)
- Median list price in May 2024: $362,300 ($215 per square foot)
- Size of a typical listed home in May 2024: 1,665 square feet
- Number of listed homes in May 2024: 1,699 (+38.9% YoY)
14. Bedford, IN
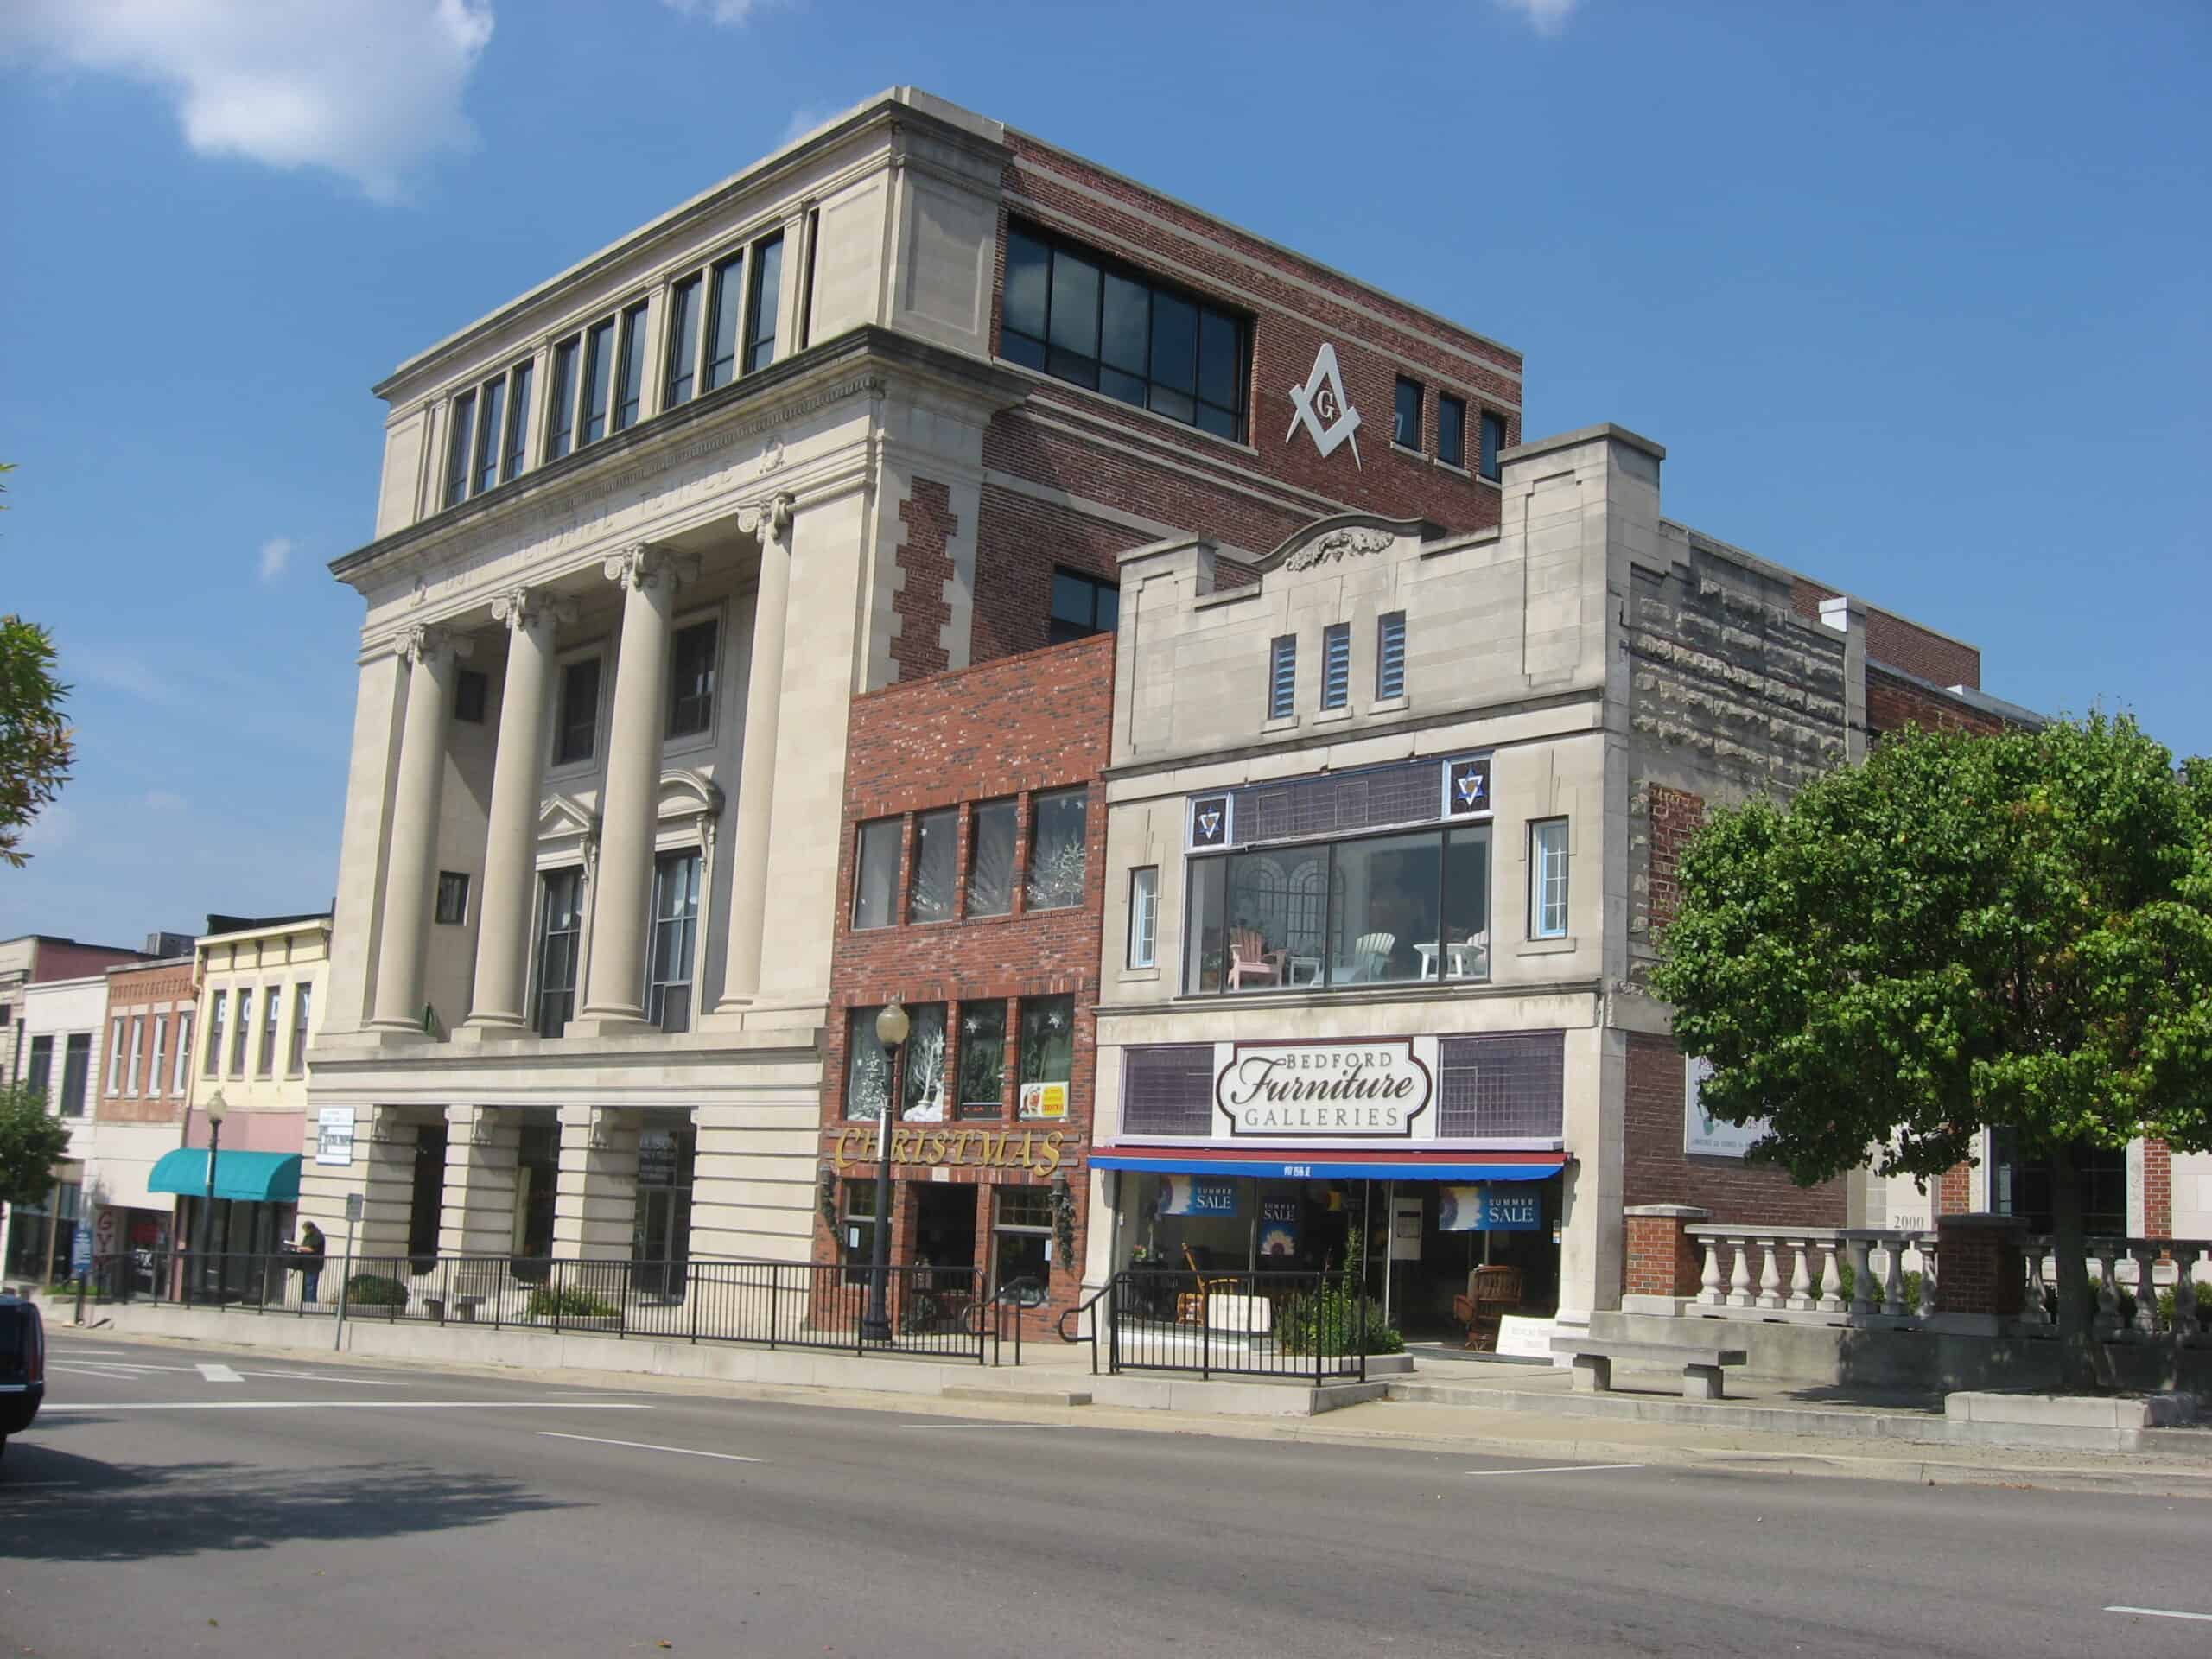
- Year-over-year change in median list price: -8.6% (-$20,000)
- Median list price in May 2024: $212,400 ($141 per square foot)
- Size of a typical listed home in May 2024: 1,525 square feet
- Number of listed homes in May 2024: 175 (+35.3% YoY)
13. Winfield, KS
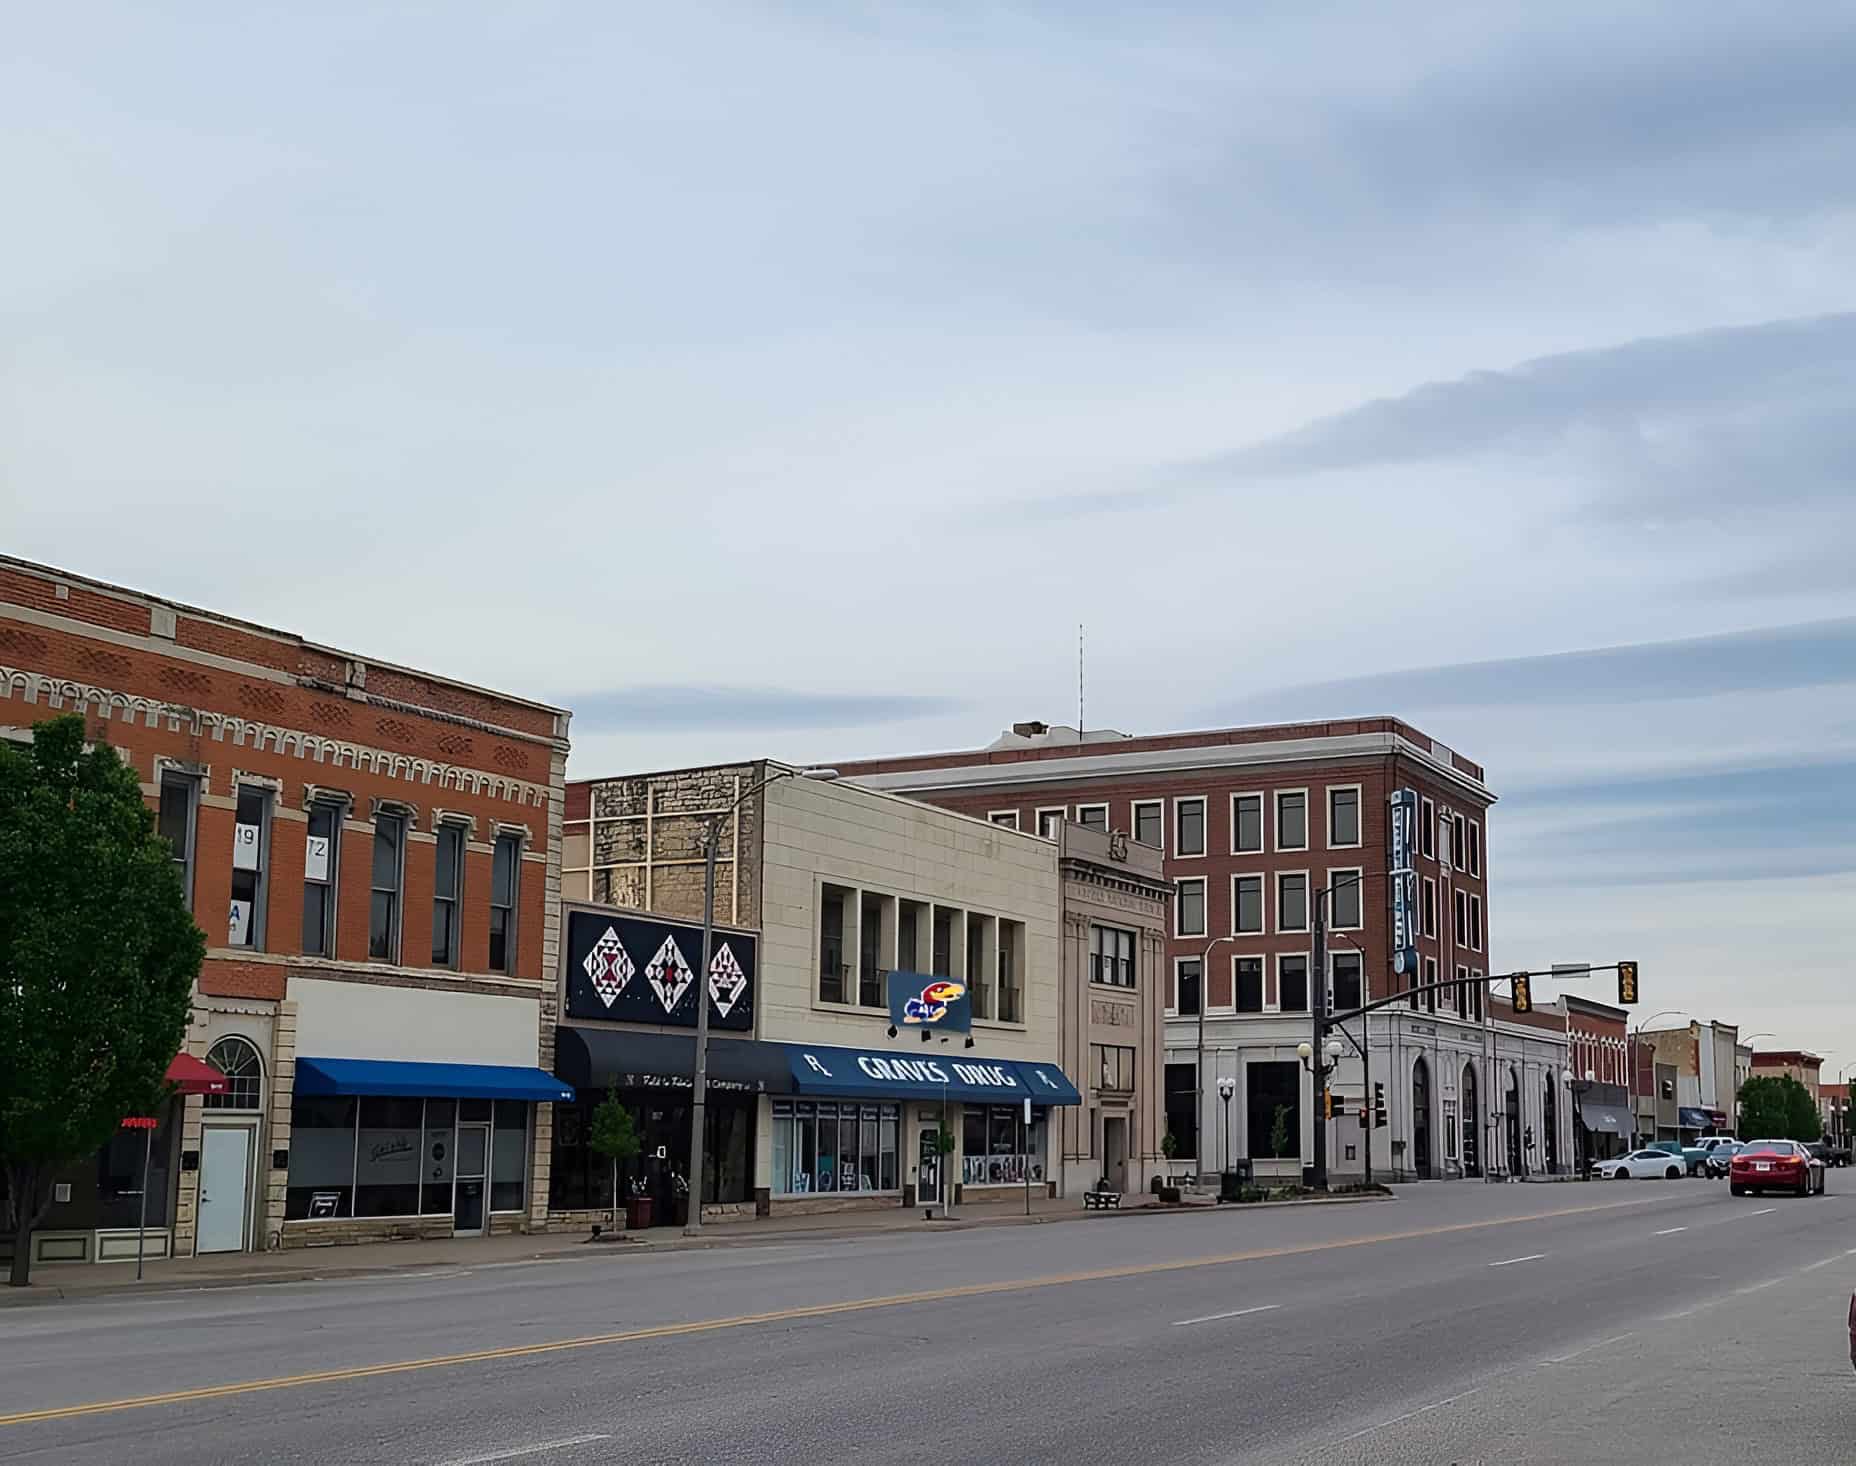
- Year-over-year change in median list price: -8.8% (-$11,375)
- Median list price in May 2024: $118,575 ($79 per square foot)
- Size of a typical listed home in May 2024: 1,651 square feet
- Number of listed homes in May 2024: 139 (+5.3% YoY)
12. North Port-Sarasota-Bradenton, FL
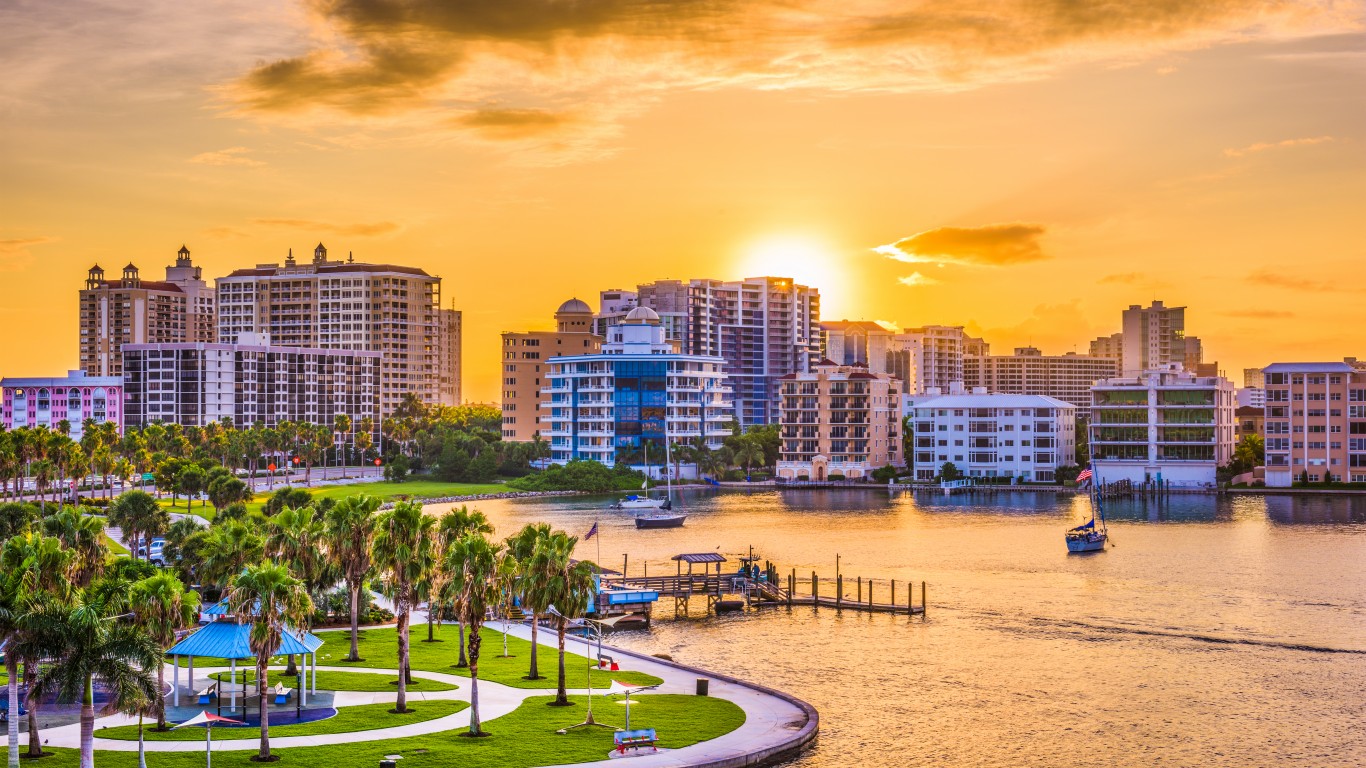
- Year-over-year change in median list price: -9.1% (-$50,000)
- Median list price in May 2024: $499,900 ($292 per square foot)
- Size of a typical listed home in May 2024: 1,721 square feet
- Number of listed homes in May 2024: 11,574 (+35.7% YoY)
11. Big Rapids, MI
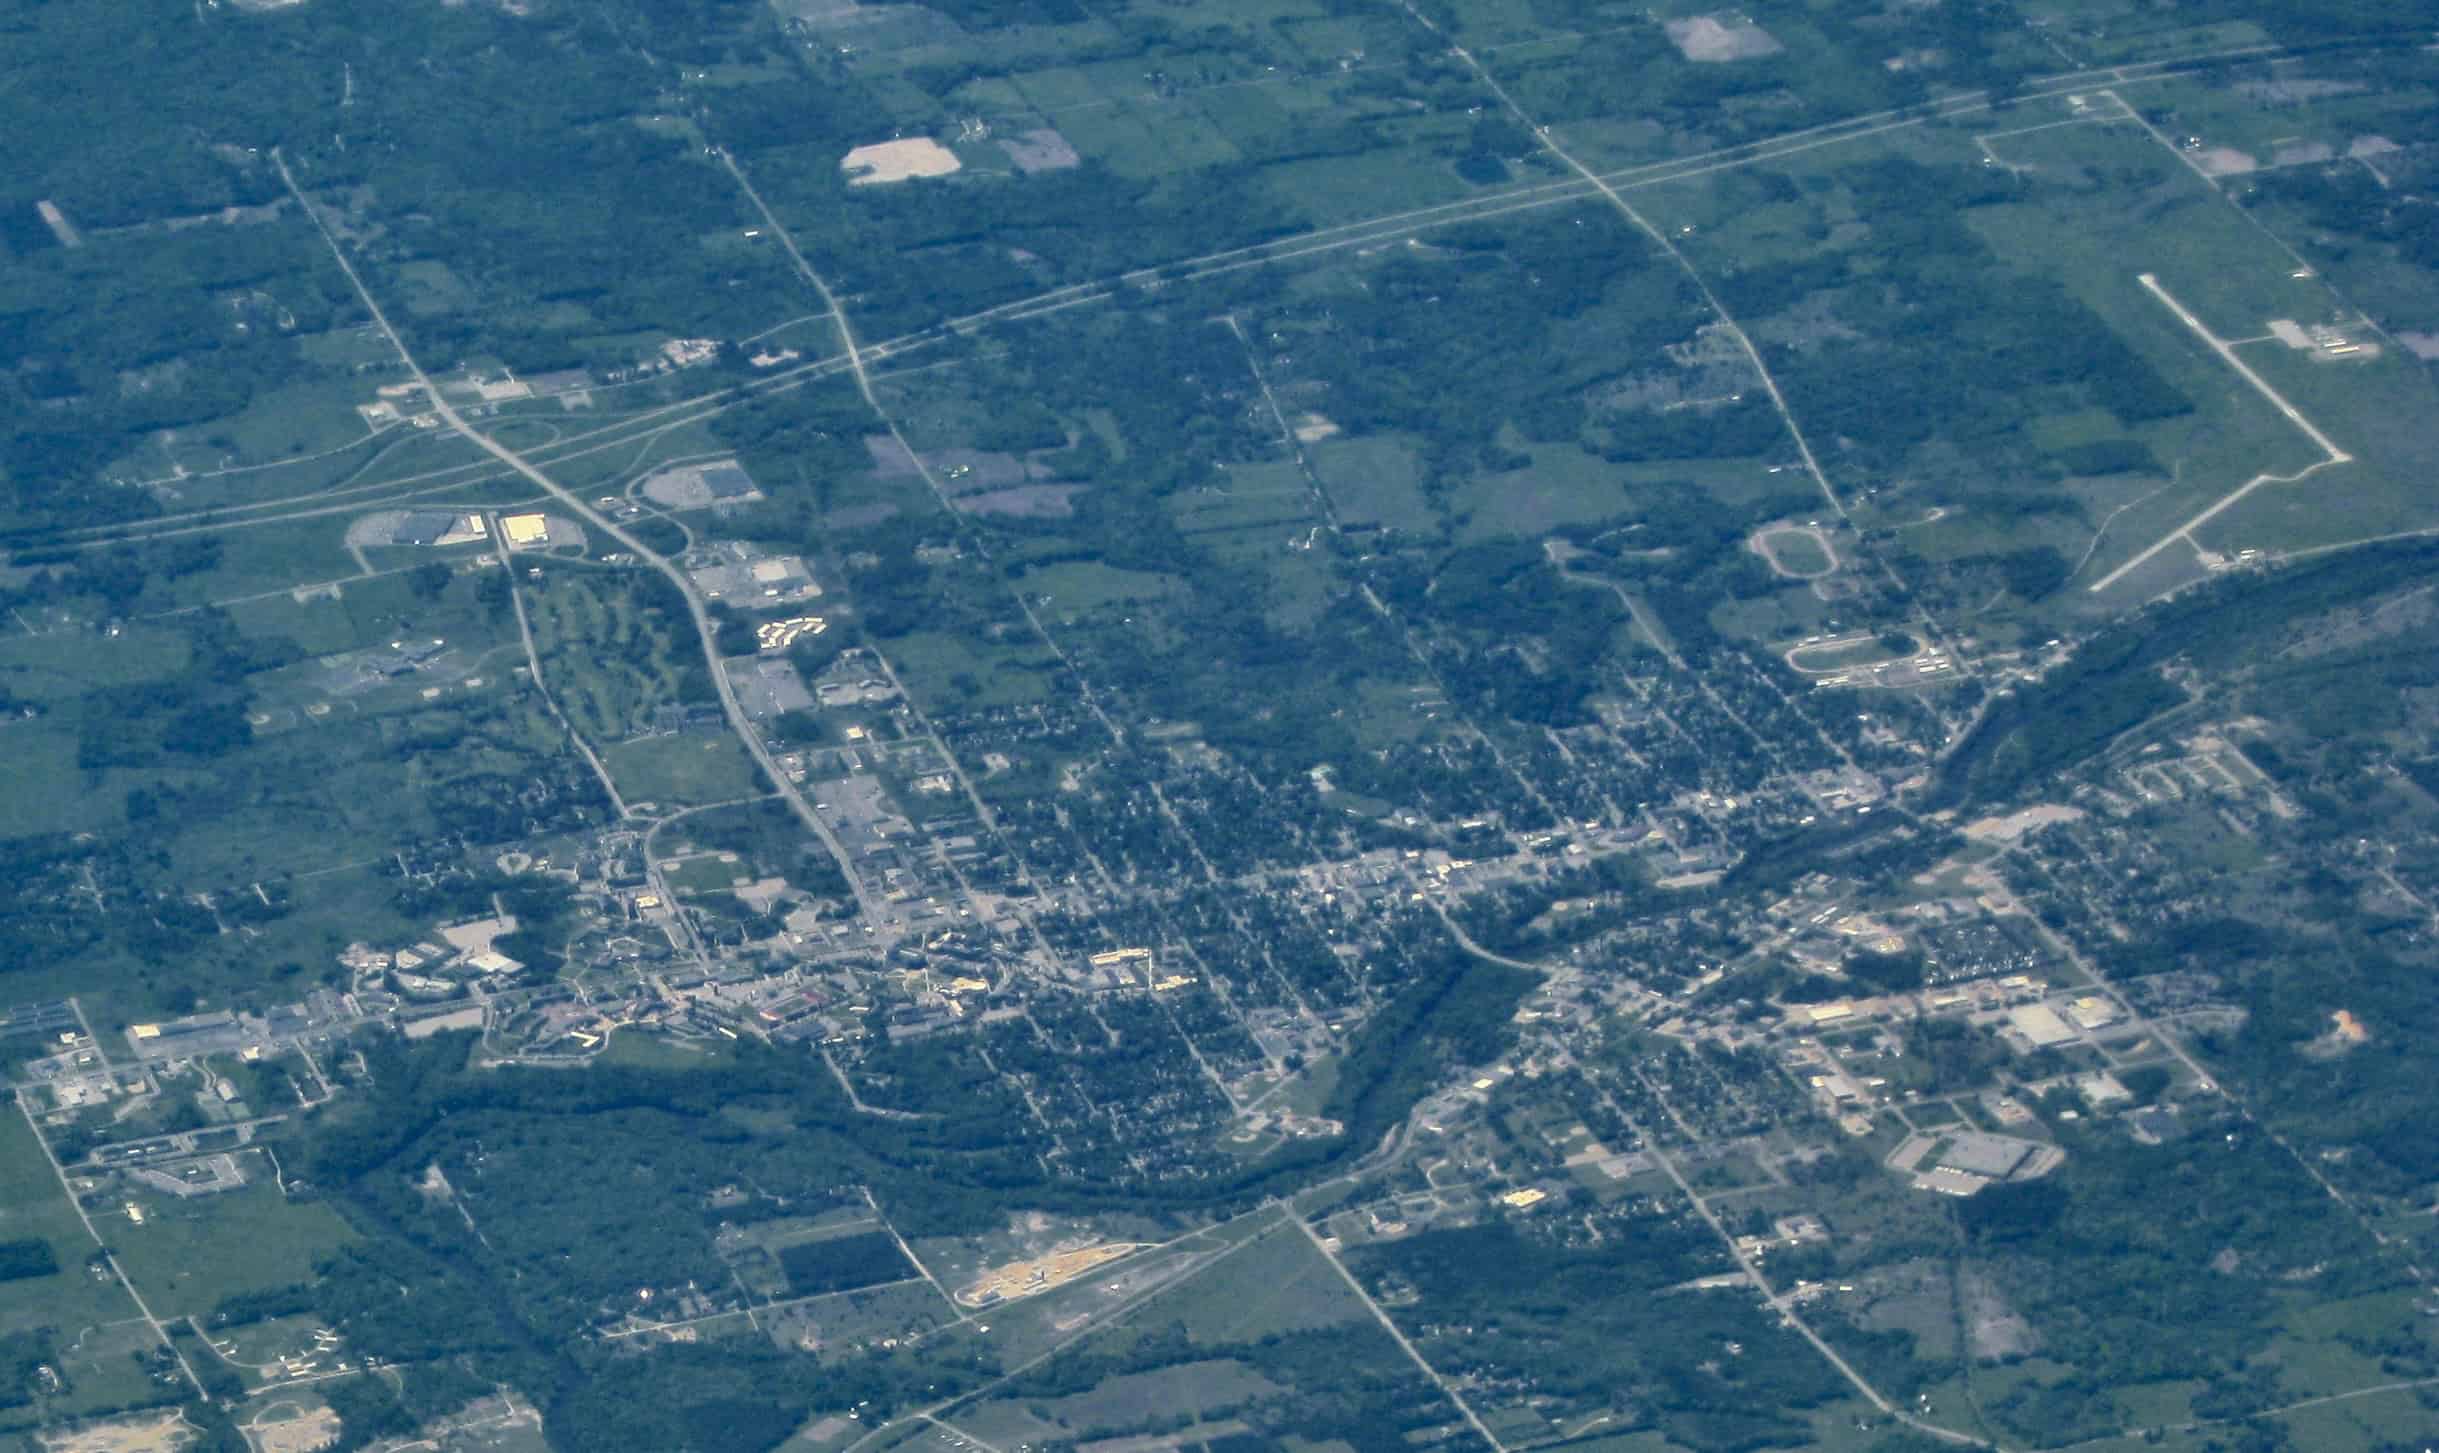
- Year-over-year change in median list price: -9.2% (-$29,999)
- Median list price in May 2024: $295,000 ($177 per square foot)
- Size of a typical listed home in May 2024: 1,797 square feet
- Number of listed homes in May 2024: 200 (+39.9% YoY)
10. Santa Cruz-Watsonville, CA

- Year-over-year change in median list price: -9.2% (-$132,250)
- Median list price in May 2024: $1,299,750 ($807 per square foot)
- Size of a typical listed home in May 2024: 1,619 square feet
- Number of listed homes in May 2024: 480 (+22.6% YoY)
9. Indiana, PA

- Year-over-year change in median list price: -9.3% (-$15,036)
- Median list price in May 2024: $147,164 ($93 per square foot)
- Size of a typical listed home in May 2024: 1,646 square feet
- Number of listed homes in May 2024: 169 (+13.0% YoY)
8. Key West, FL
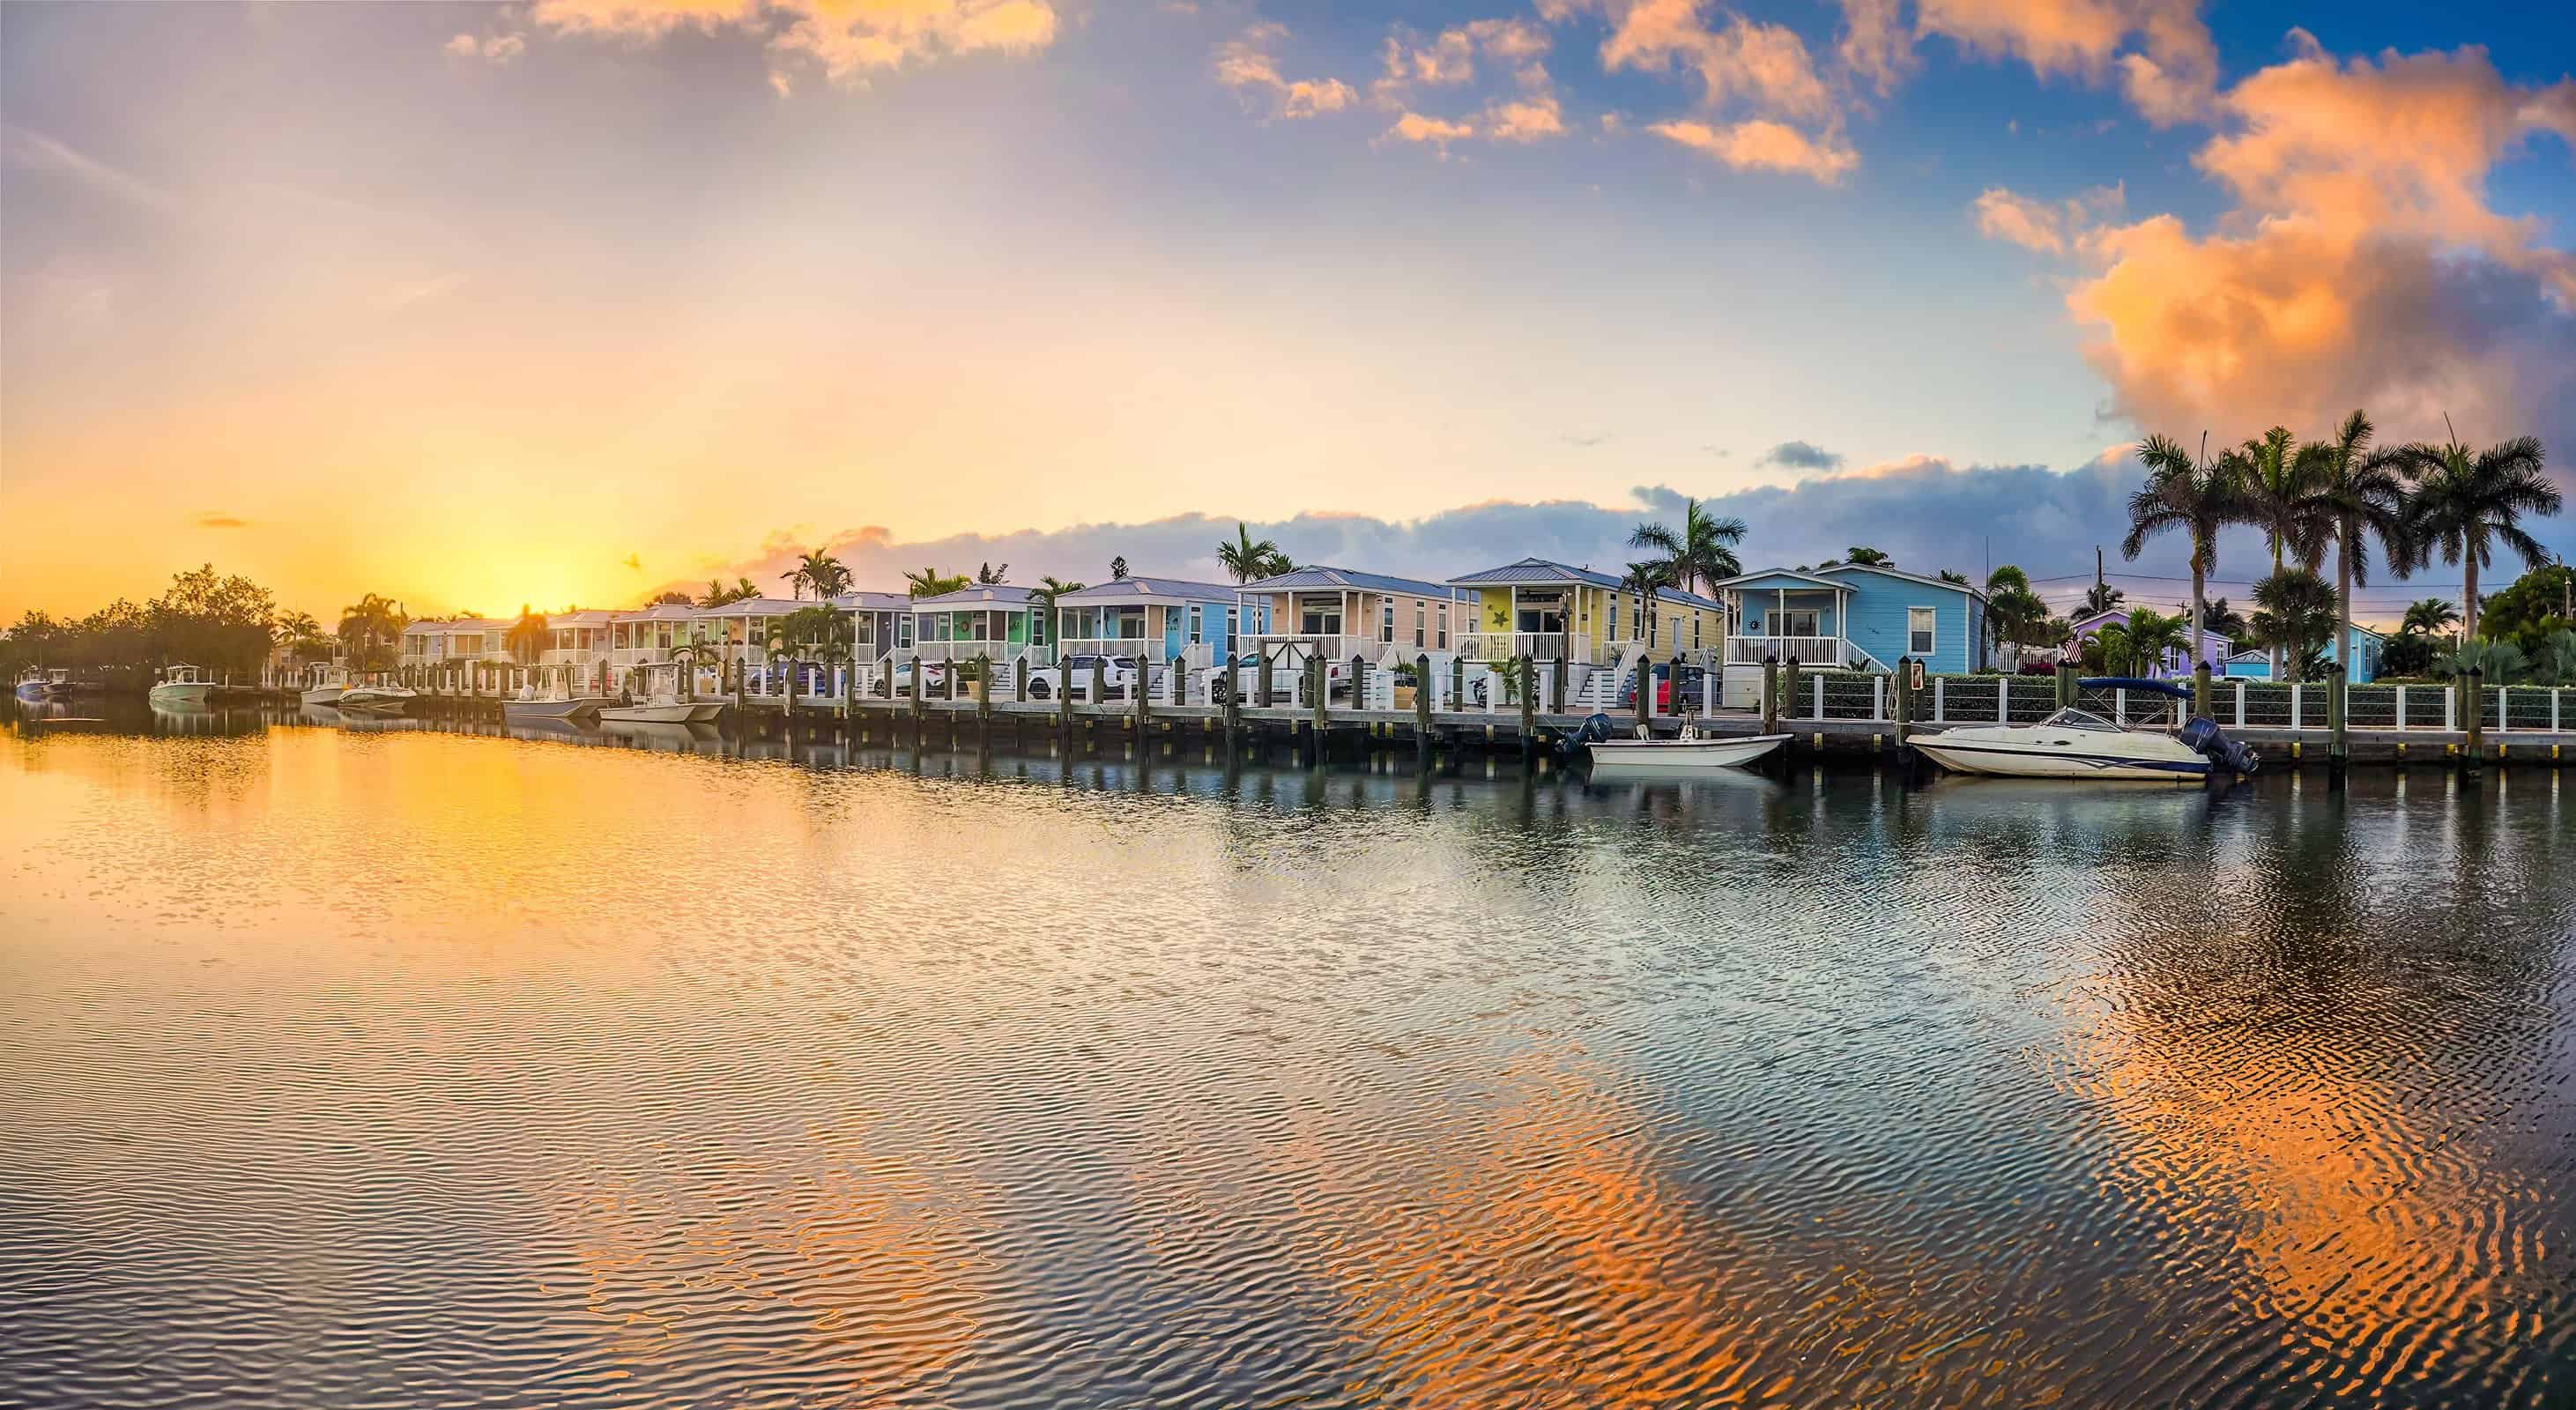
- Year-over-year change in median list price: -9.3% (-$139,250)
- Median list price in May 2024: $1,357,000 ($937 per square foot)
- Size of a typical listed home in May 2024: 1,545 square feet
- Number of listed homes in May 2024: 1,513 (+41.9% YoY)
7. Missoula, MT

- Year-over-year change in median list price: -9.3% (-$74,475)
- Median list price in May 2024: $725,000 ($381 per square foot)
- Size of a typical listed home in May 2024: 2,066 square feet
- Number of listed homes in May 2024: 444 (+4.7% YoY)
6. San Angelo, TX
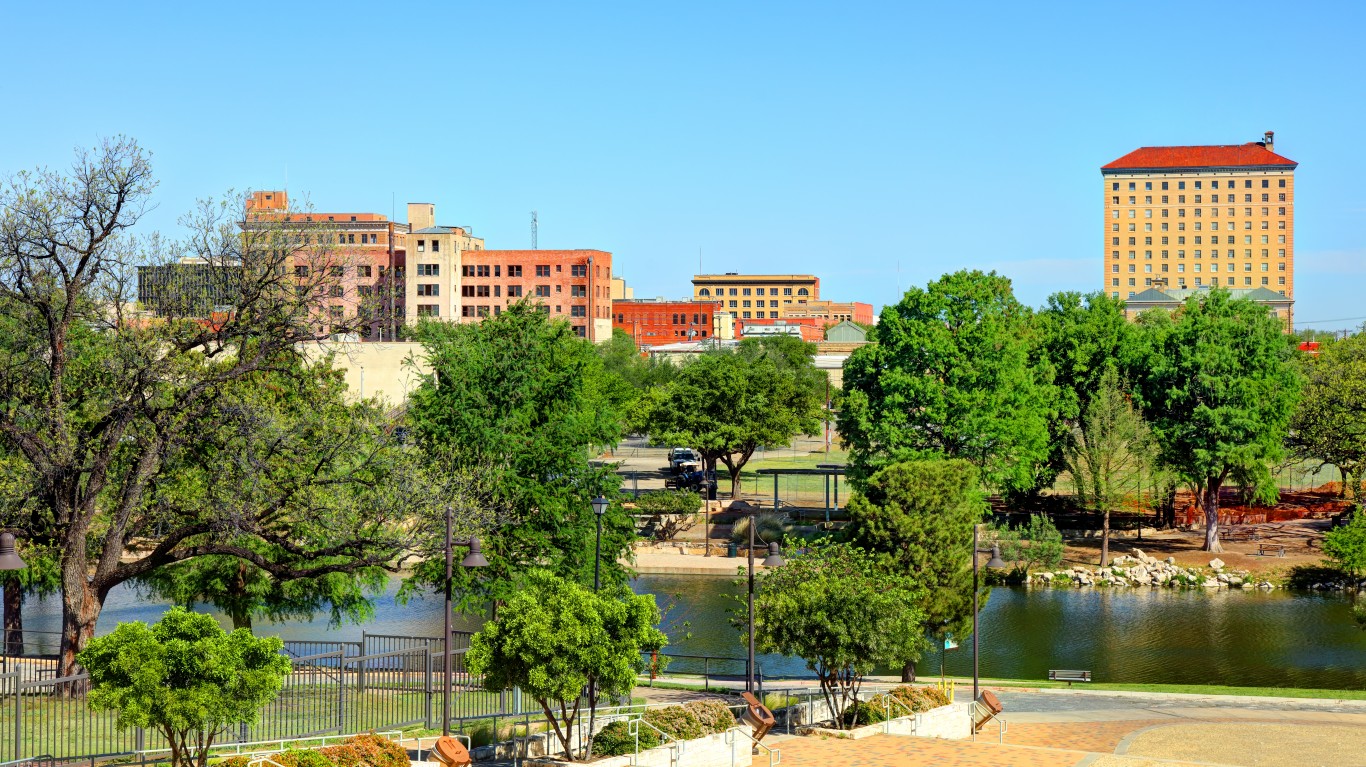
- Year-over-year change in median list price: -9.6% (-$32,000)
- Median list price in May 2024: $299,900 ($164 per square foot)
- Size of a typical listed home in May 2024: 1,796 square feet
- Number of listed homes in May 2024: 513 (-3.6% YoY)
5. Crestview-Fort Walton Beach-Destin, FL
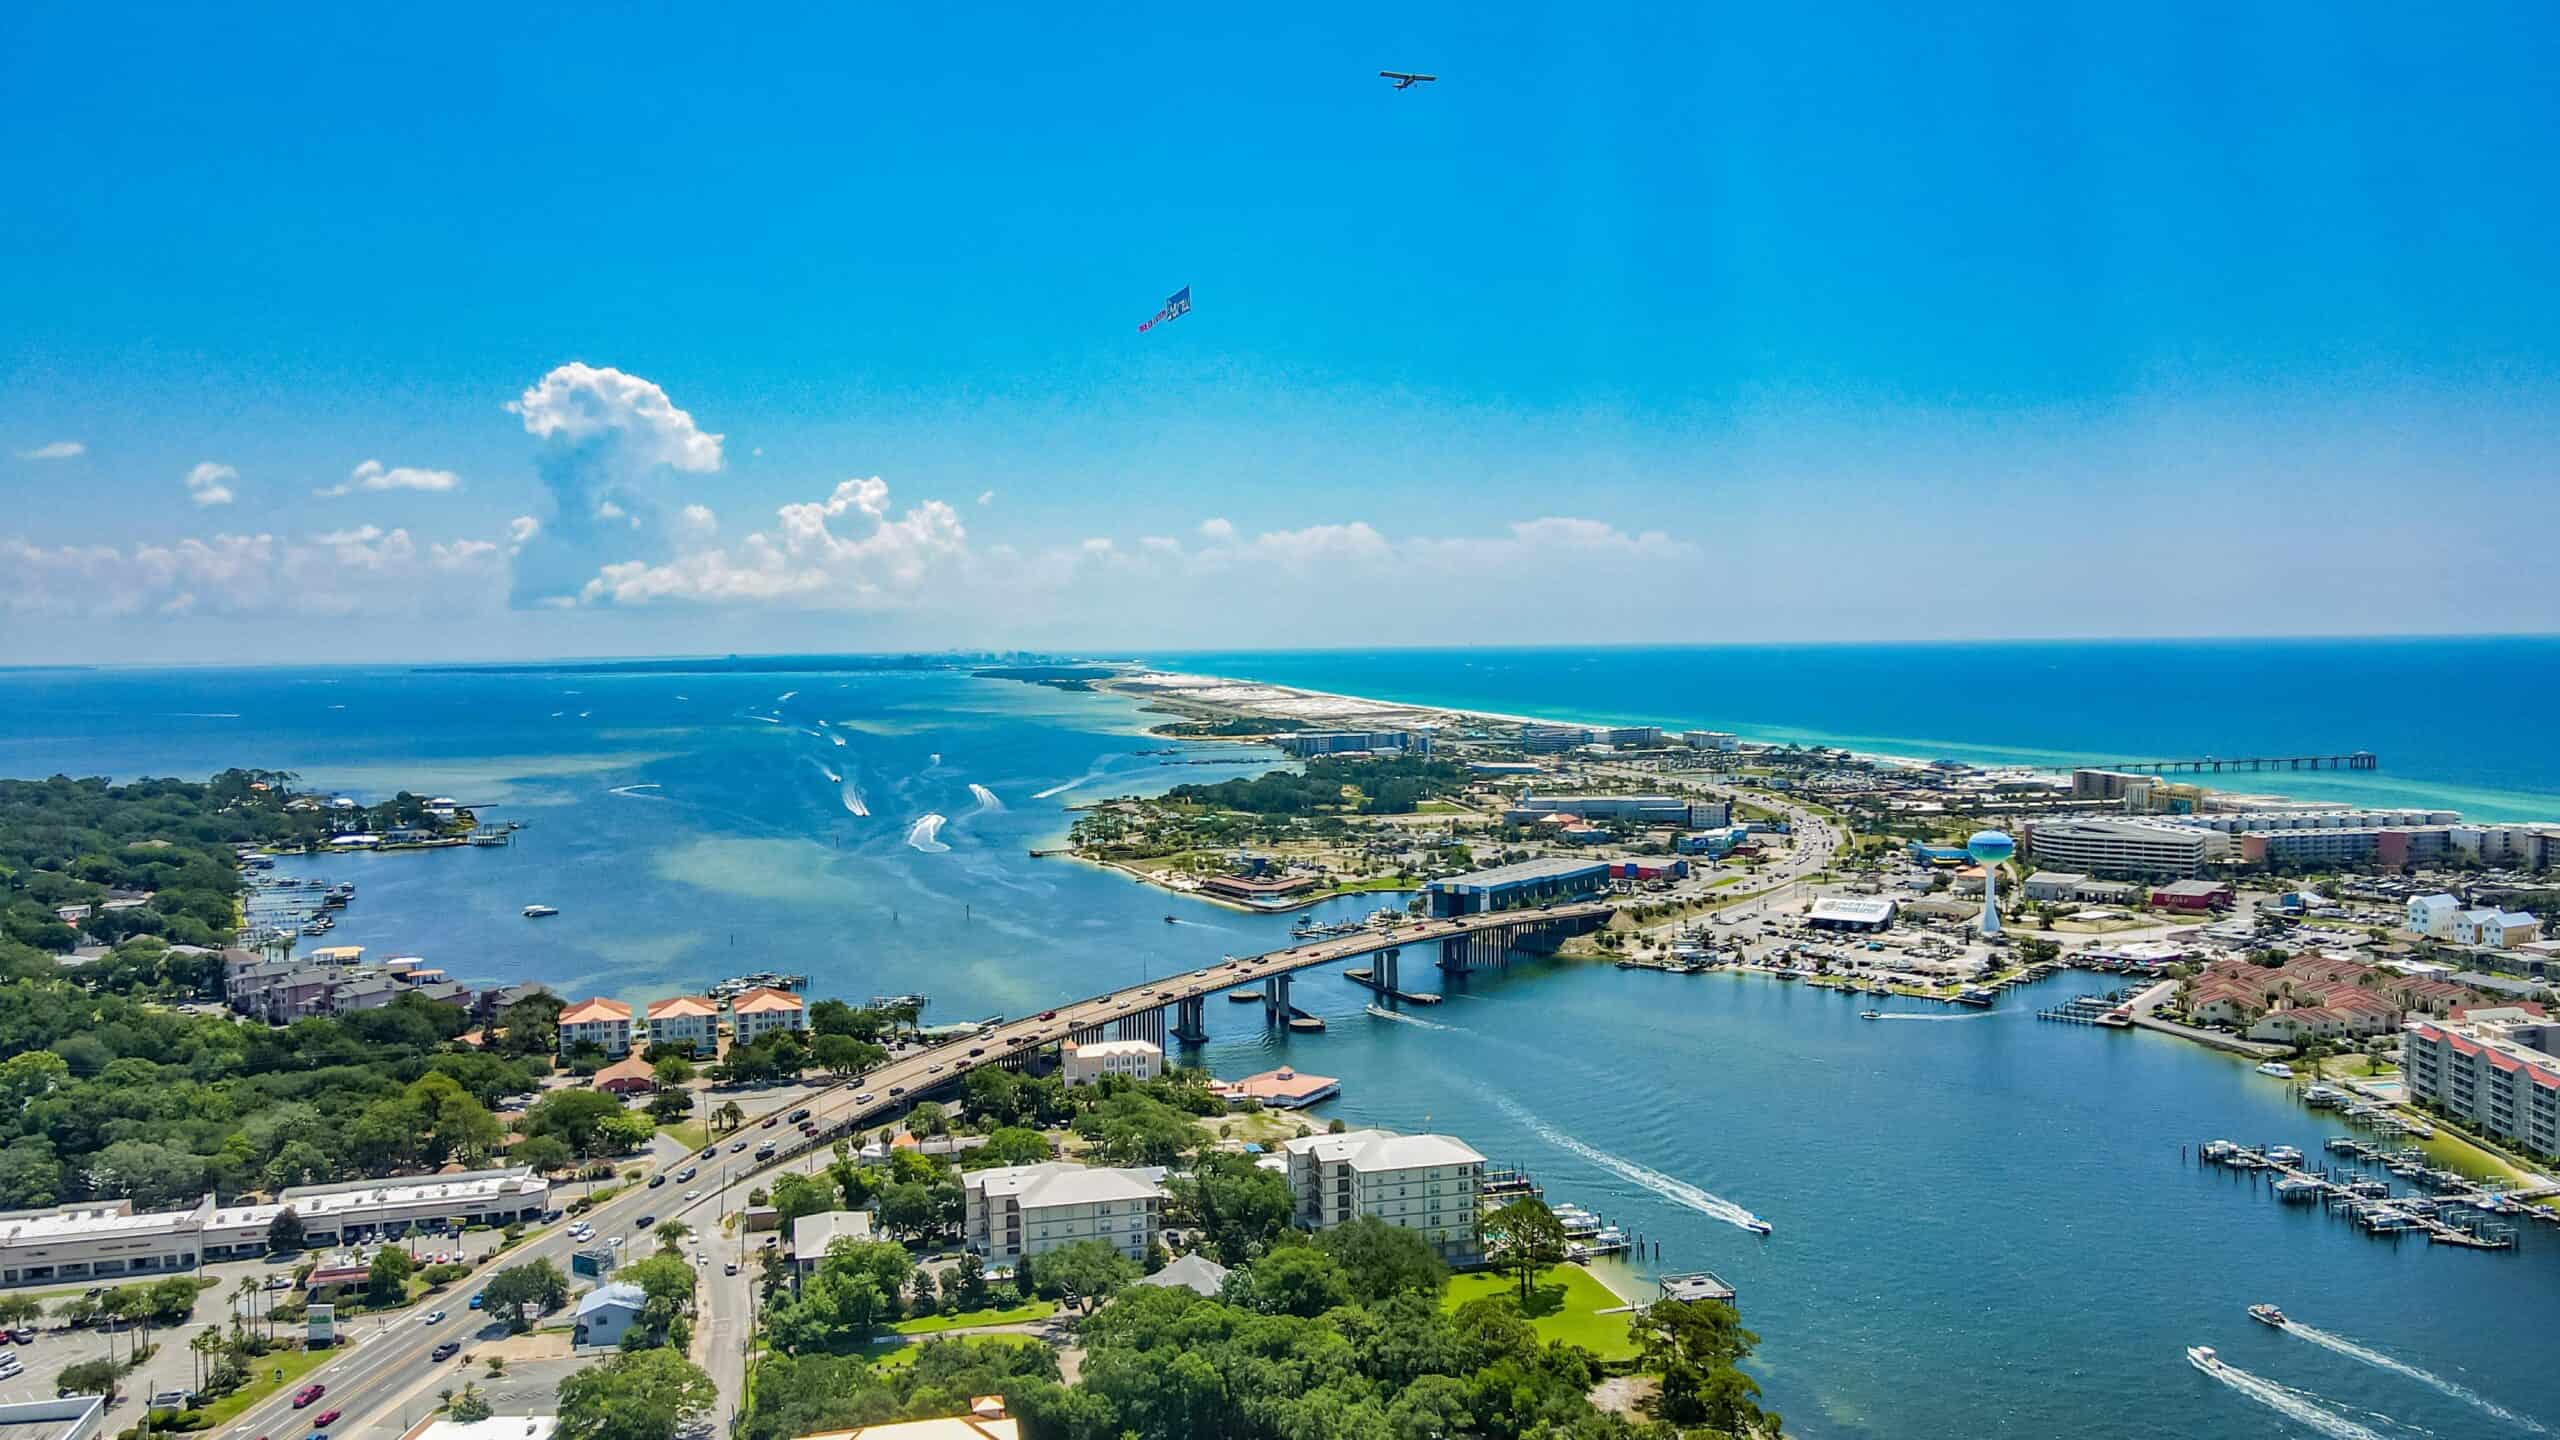
- Year-over-year change in median list price: -9.7% (-$70,000)
- Median list price in May 2024: $649,450 ($480 per square foot)
- Size of a typical listed home in May 2024: 1,824 square feet
- Number of listed homes in May 2024: 5,405 (+37.3% YoY)
4. Niles, MI
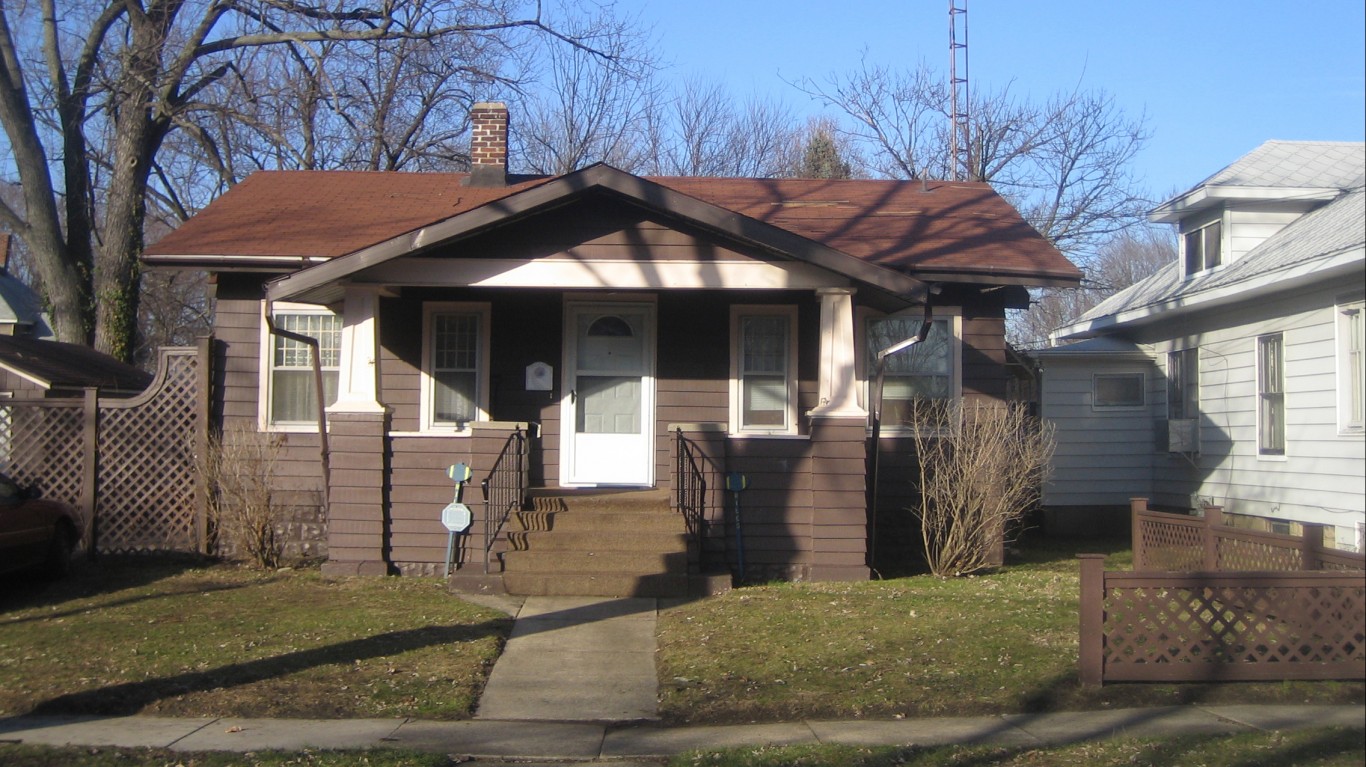
- Year-over-year change in median list price: -9.8% (-$41,050)
- Median list price in May 2024: $377,450 ($202 per square foot)
- Size of a typical listed home in May 2024: 1,930 square feet
- Number of listed homes in May 2024: 579 (+7.4% YoY)
3. Traverse City, MI
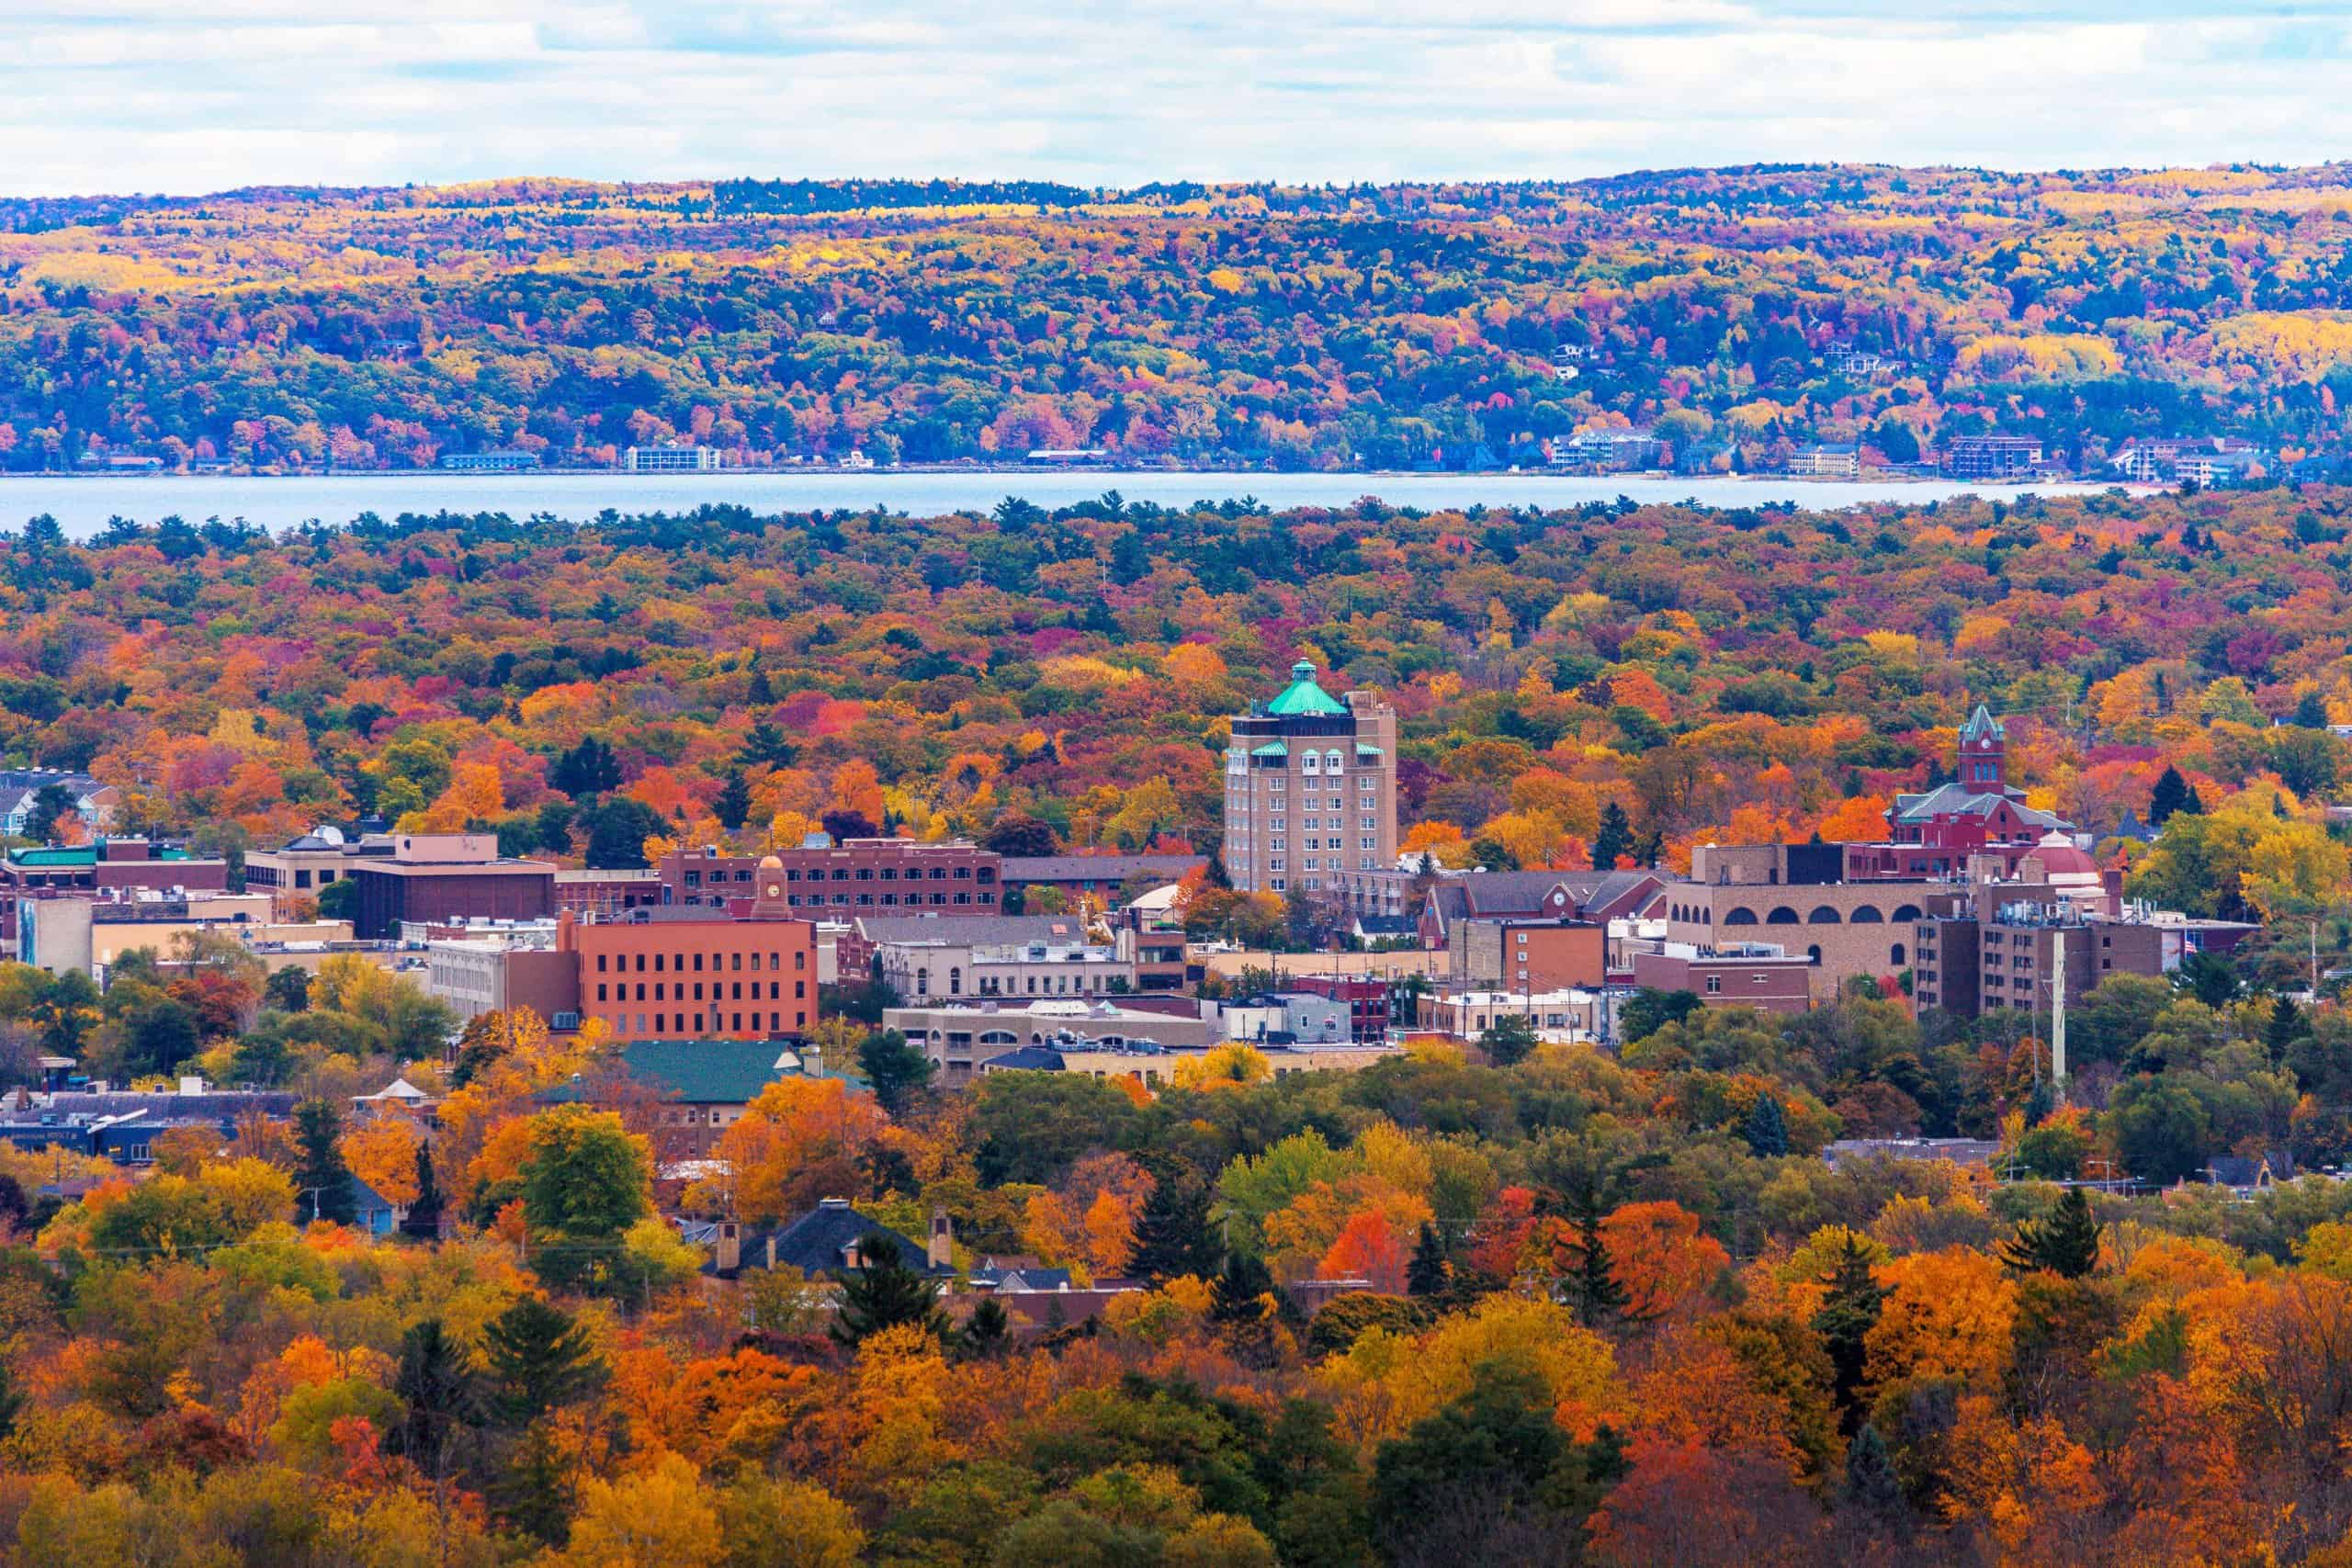
- Year-over-year change in median list price: -9.9% (-$52,800)
- Median list price in May 2024: $481,200 ($325 per square foot)
- Size of a typical listed home in May 2024: 1,550 square feet
- Number of listed homes in May 2024: 837 (+34.1% YoY)
2. West Plains, MO
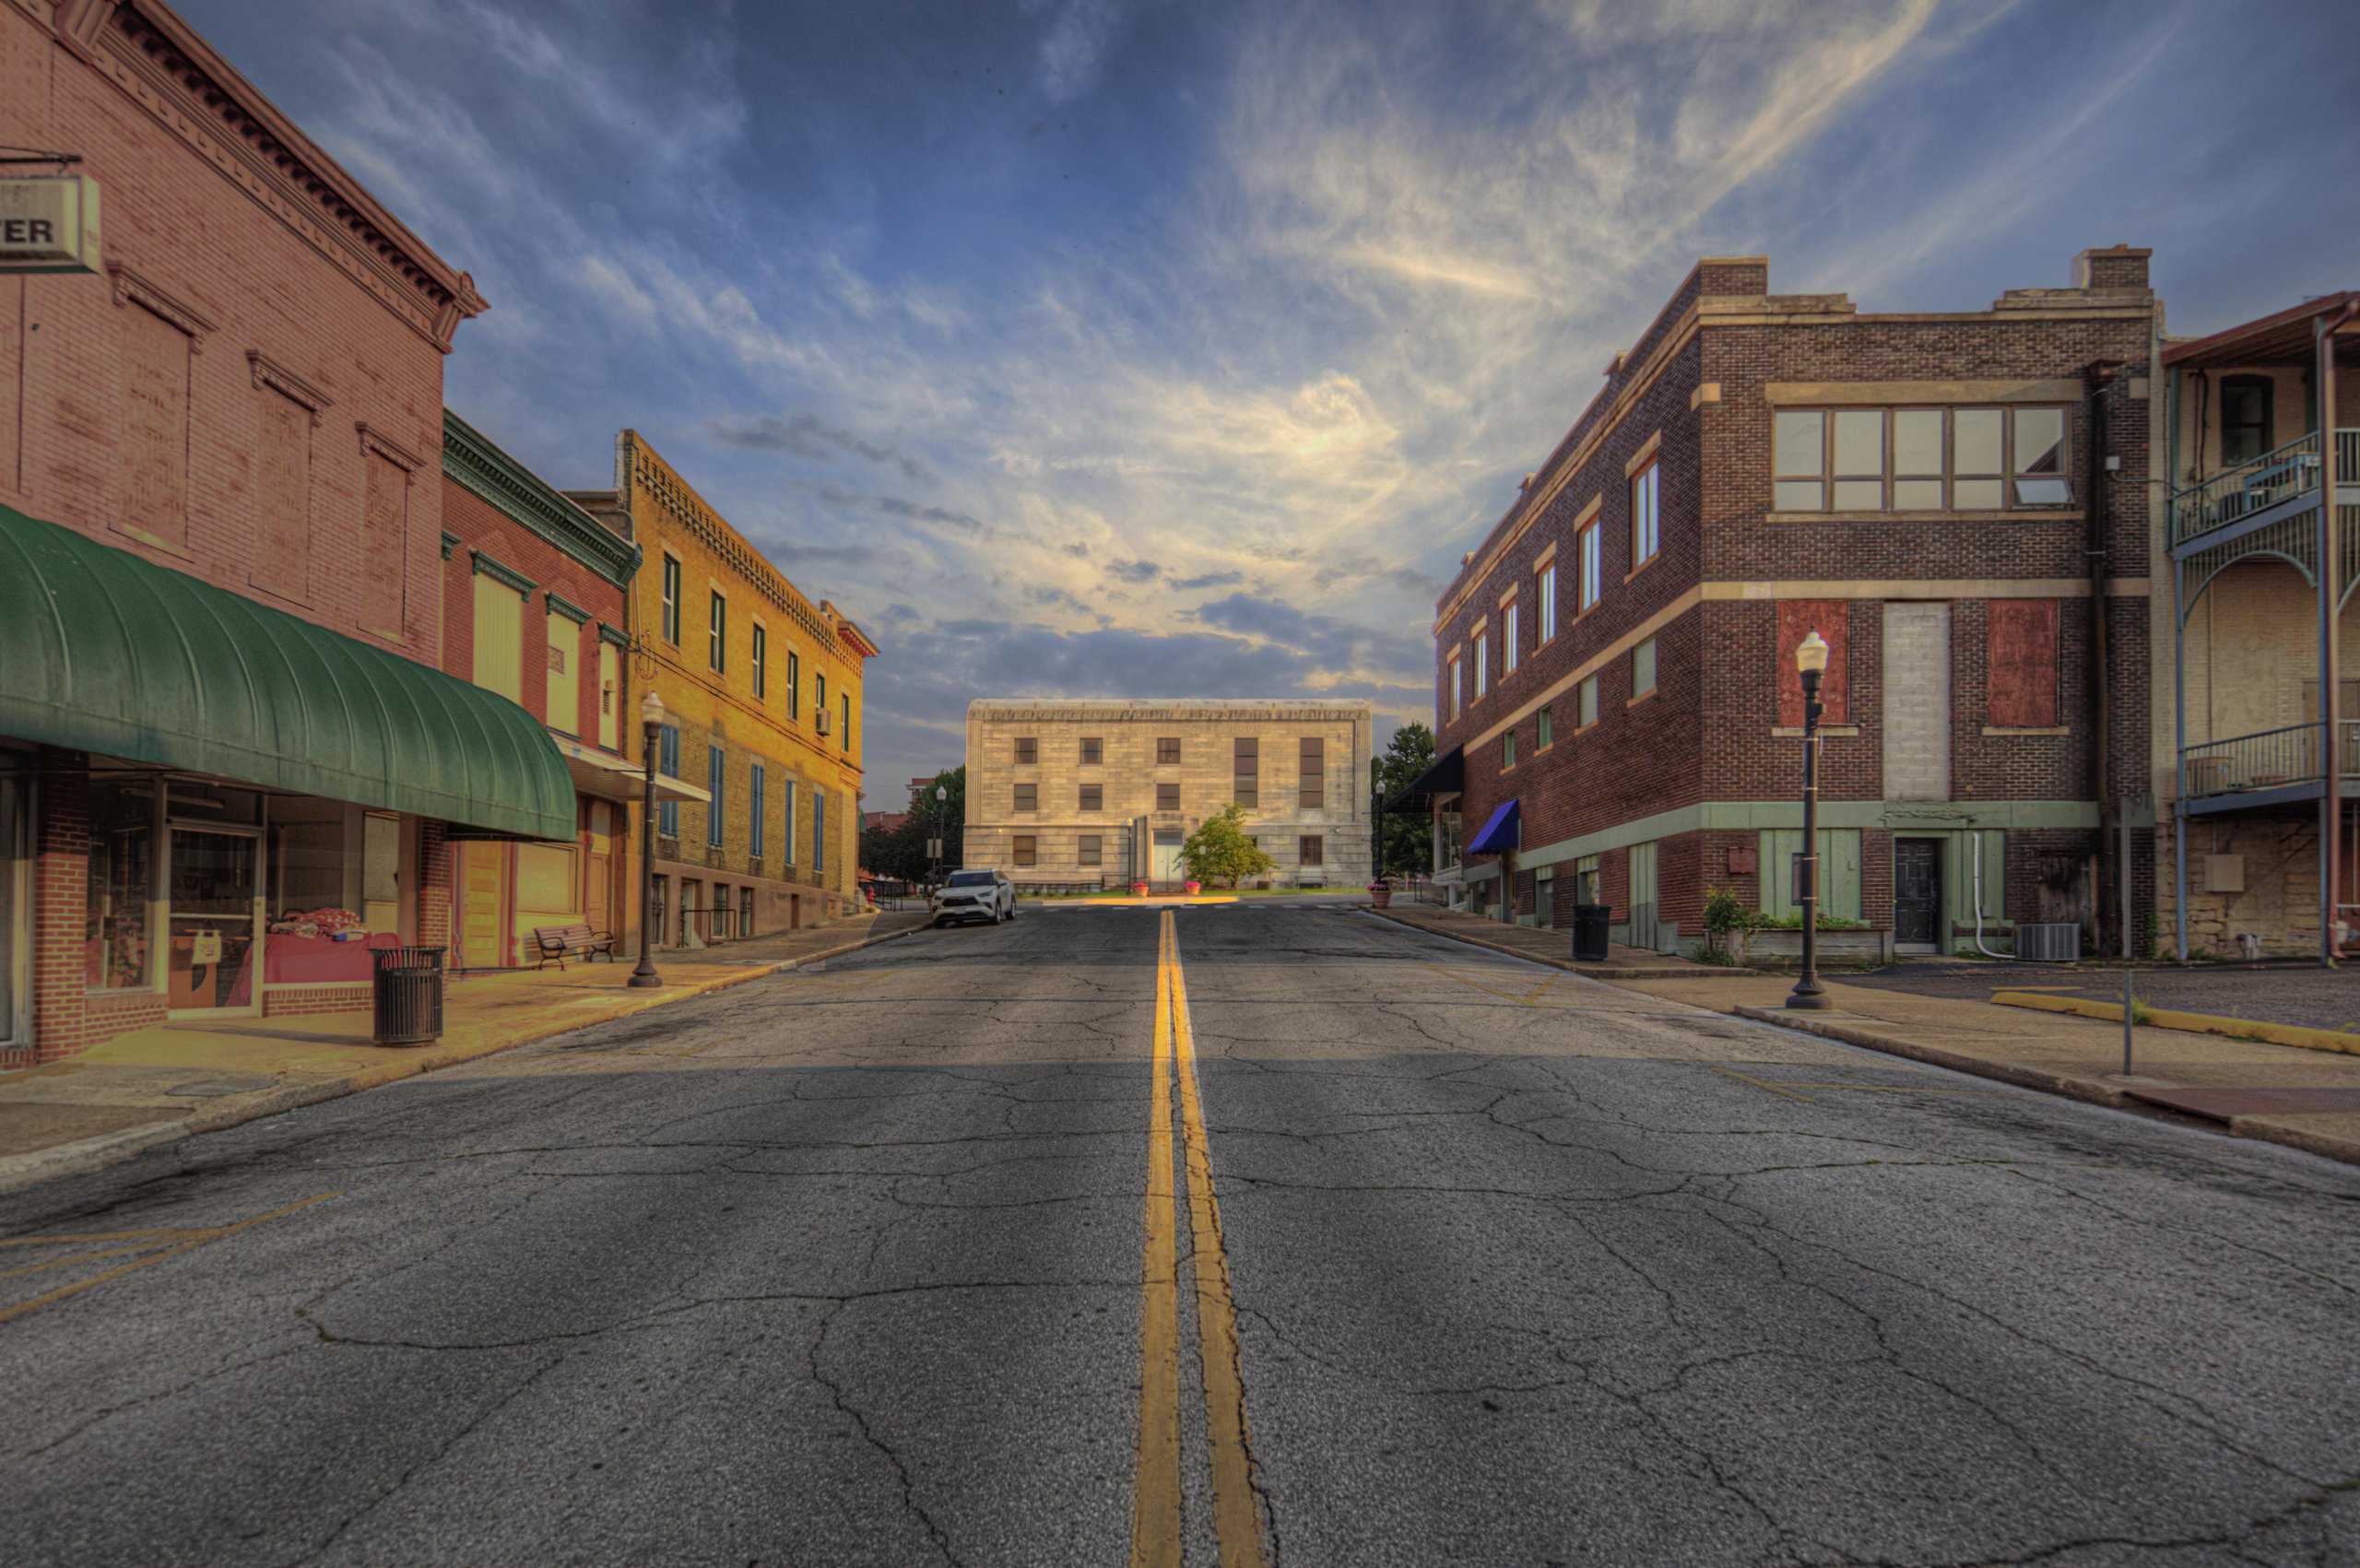
- Year-over-year change in median list price: -9.9% (-$27,550)
- Median list price in May 2024: $249,900 ($138 per square foot)
- Size of a typical listed home in May 2024: 1,828 square feet
- Number of listed homes in May 2024: 237 (+28.5% YoY)
1. Johnson City, TN
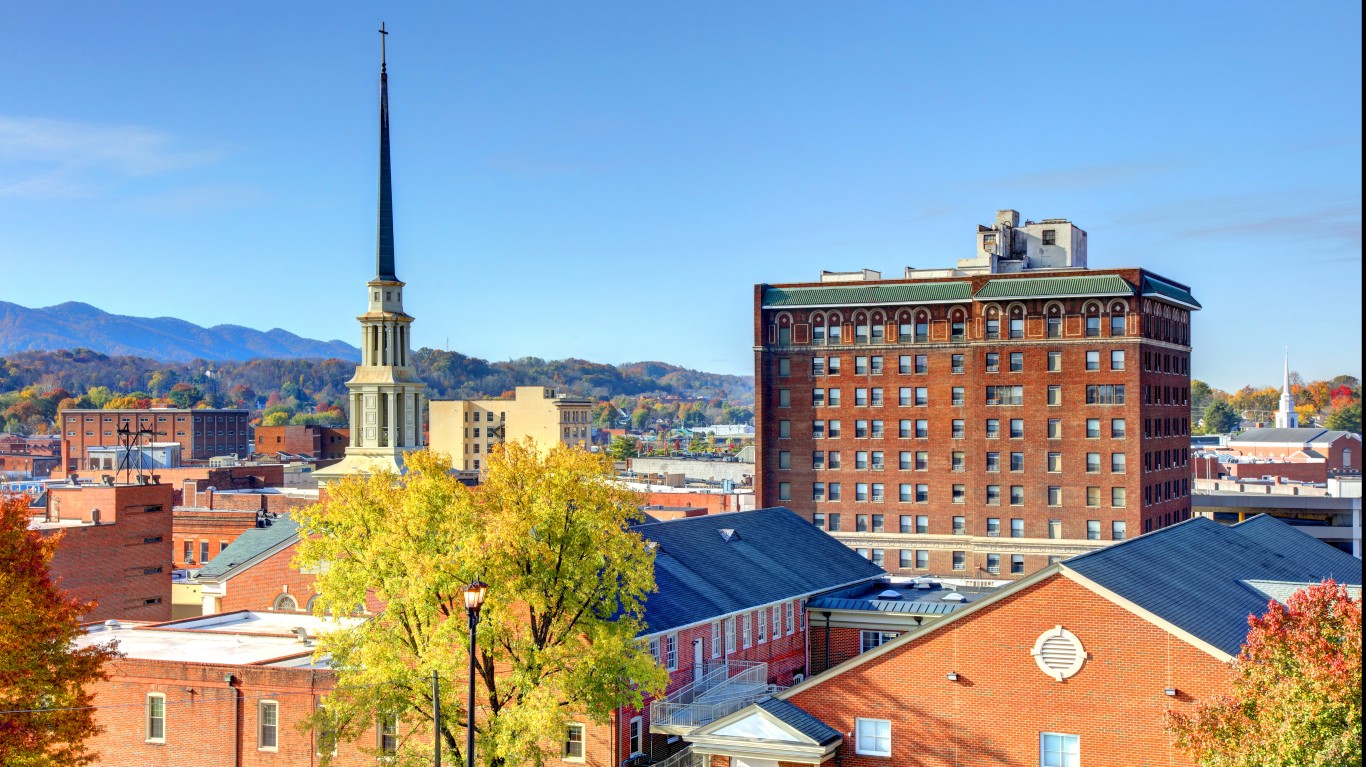
- Year-over-year change in median list price: -10.0% (-$42,950)
- Median list price in May 2024: $386,950 ($201 per square foot)
- Size of a typical listed home in May 2024: 1,841 square feet
- Number of listed homes in May 2024: 721 (+47.3% YoY)
Are You Ahead, or Behind on Retirement?
If you’re one of the over 4 Million Americans set to retire this year, you may want to pay attention. Many people have worked their whole lives preparing to retire without ever knowing the answer to the most important question: am I ahead, or behind on my goals?
Don’t make the same mistake. It’s an easy question to answer. A quick conversation with a financial advisor can help you unpack your savings, spending, and goals for your money. With Zoe Financial’s free matching tool, you can connect with trusted financial advisors in minutes.
Why wait? Click here to get started today!
Thank you for reading! Have some feedback for us?
Contact the 24/7 Wall St. editorial team.
