24/7 Wall St. Insights
- Homelessness is not a new issue in America, with documents dating back to the 1640s
- From 2018 to 2023, homelessness increased by 18.1%
- Also: Discover the next Nvidia
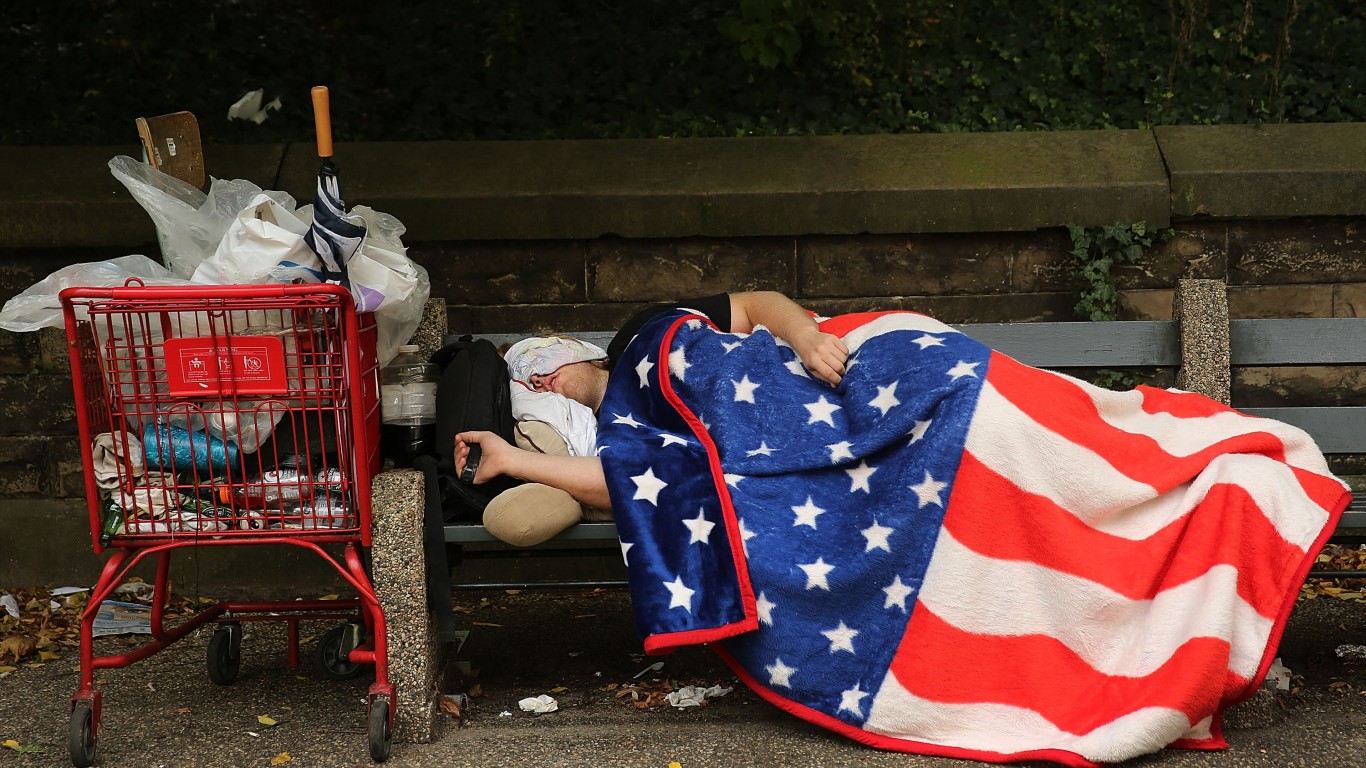
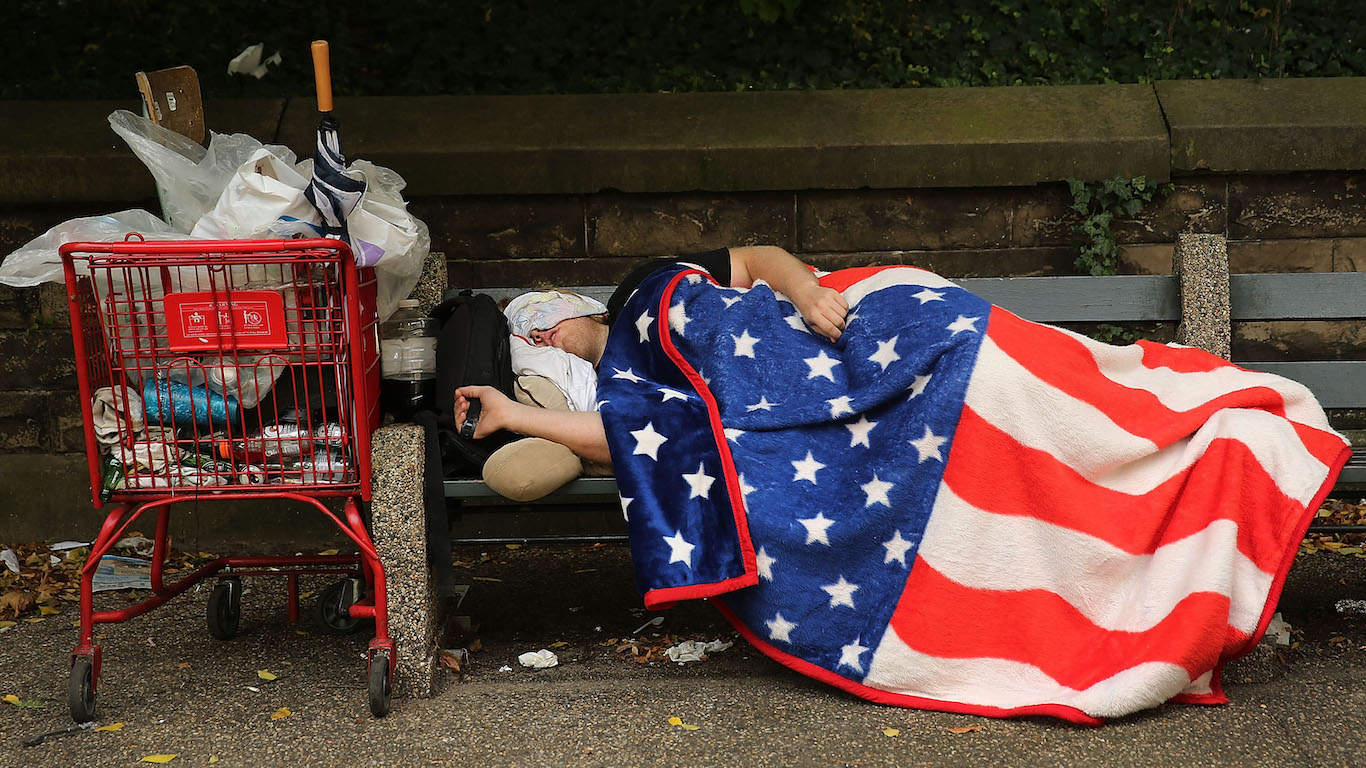
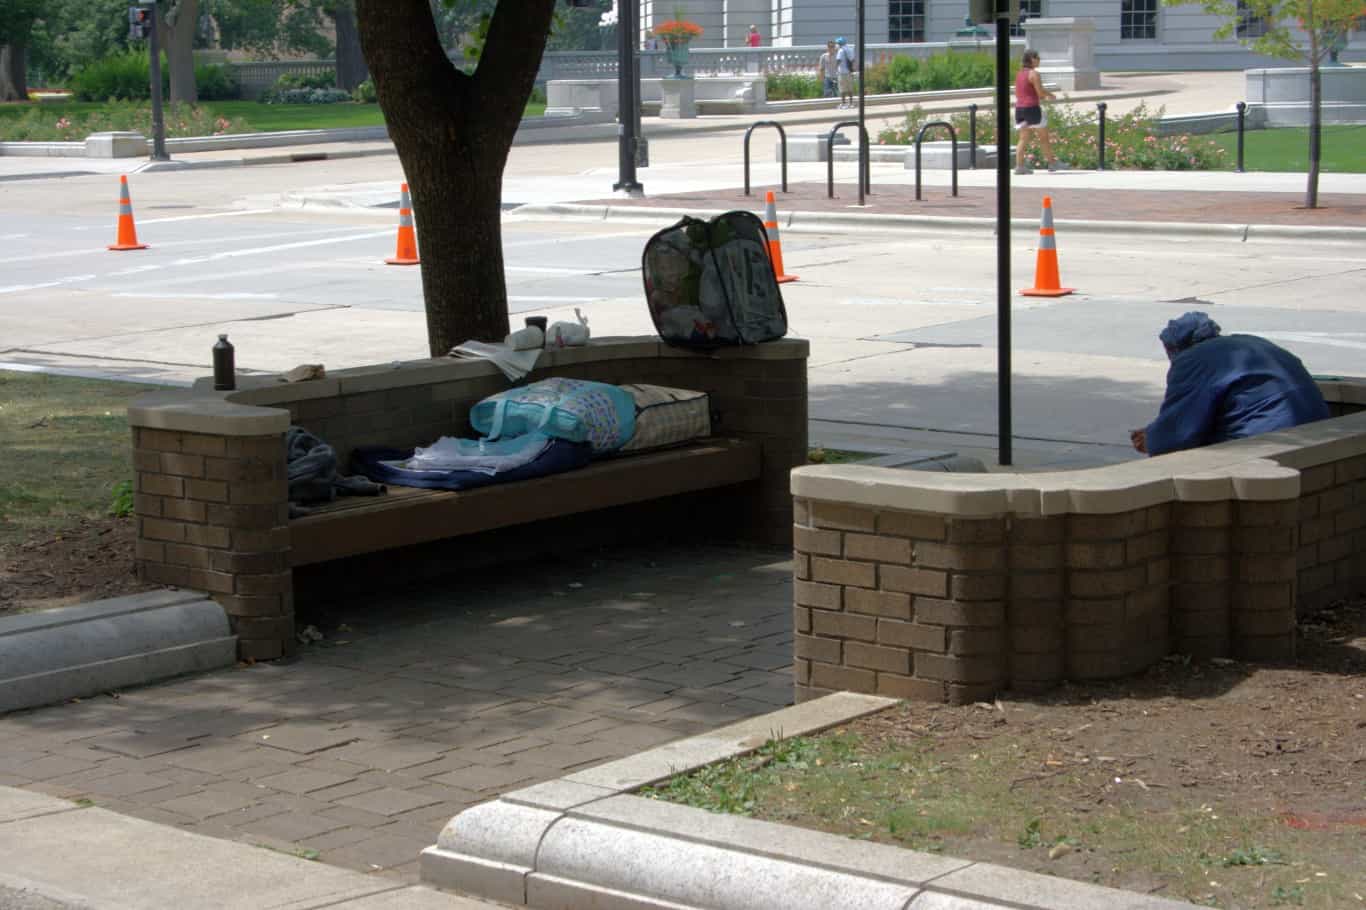
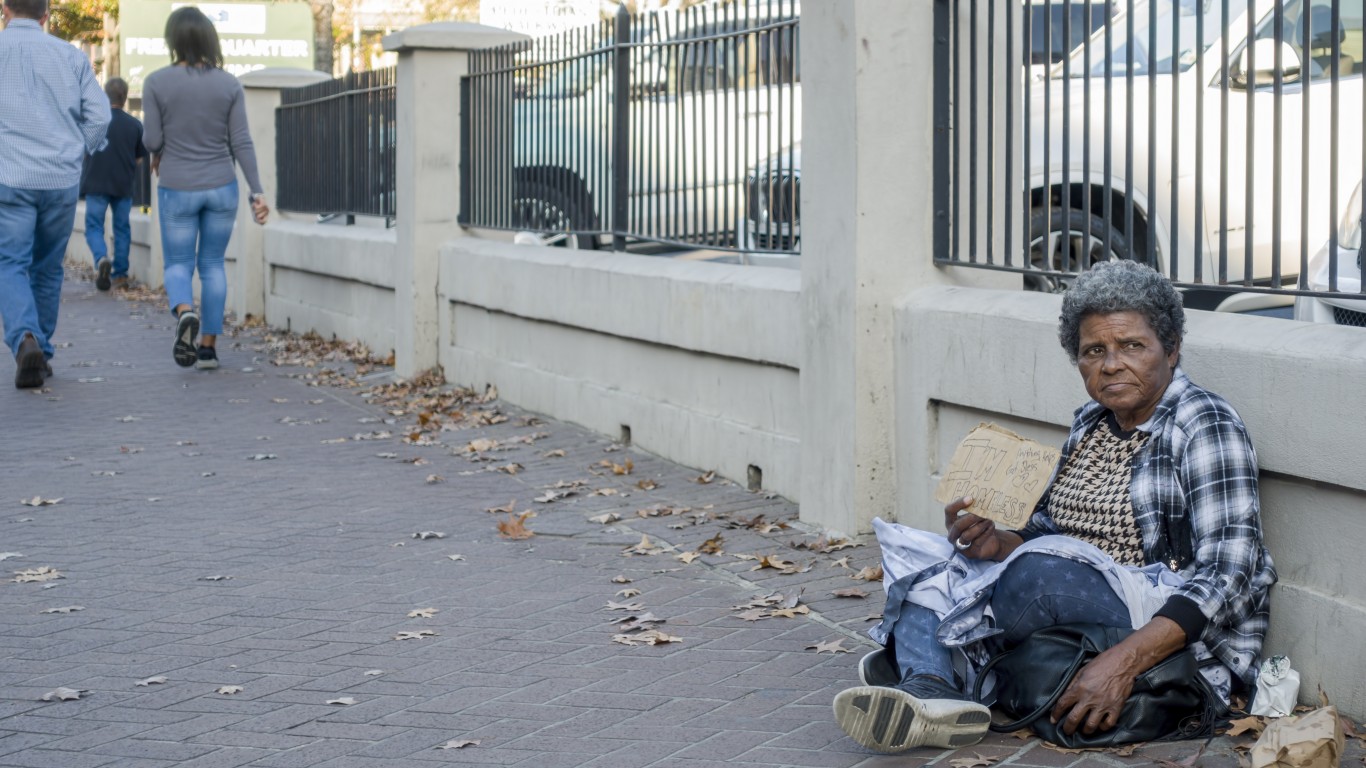
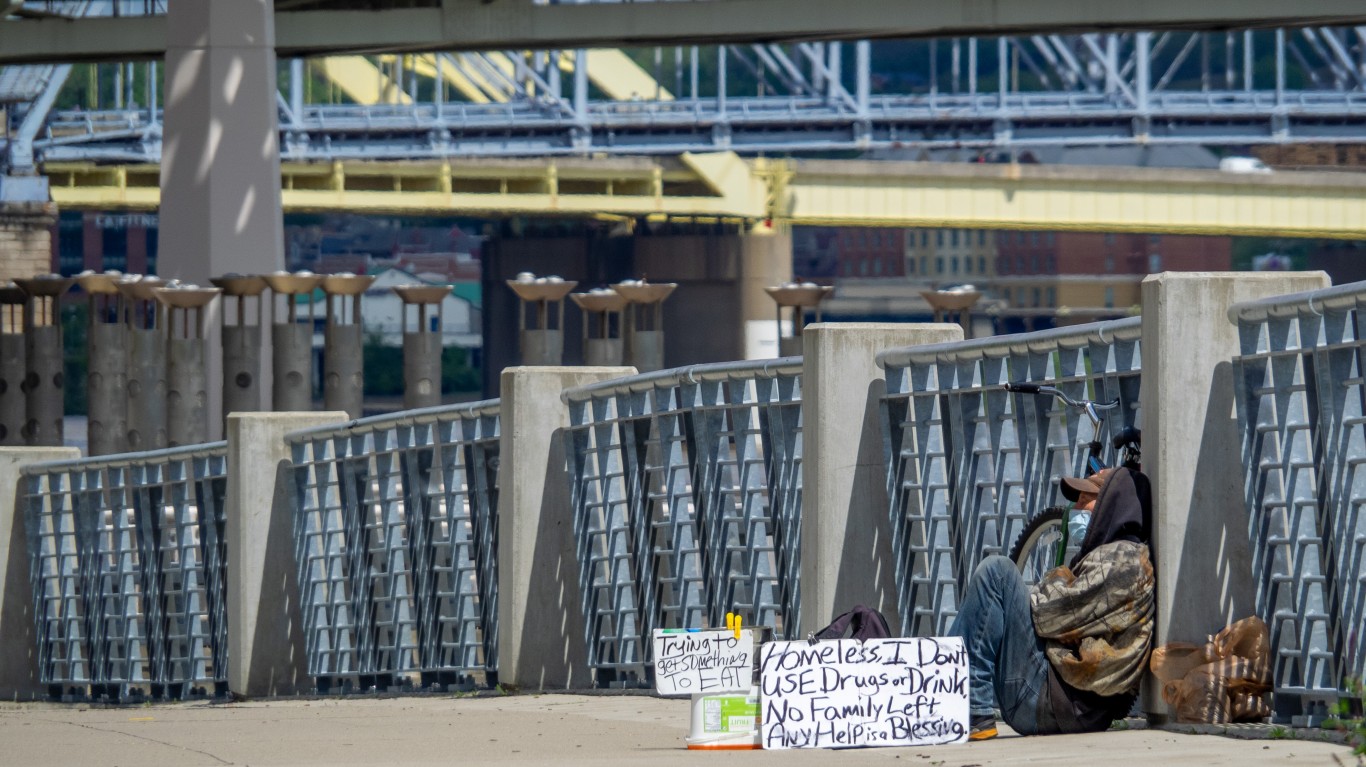
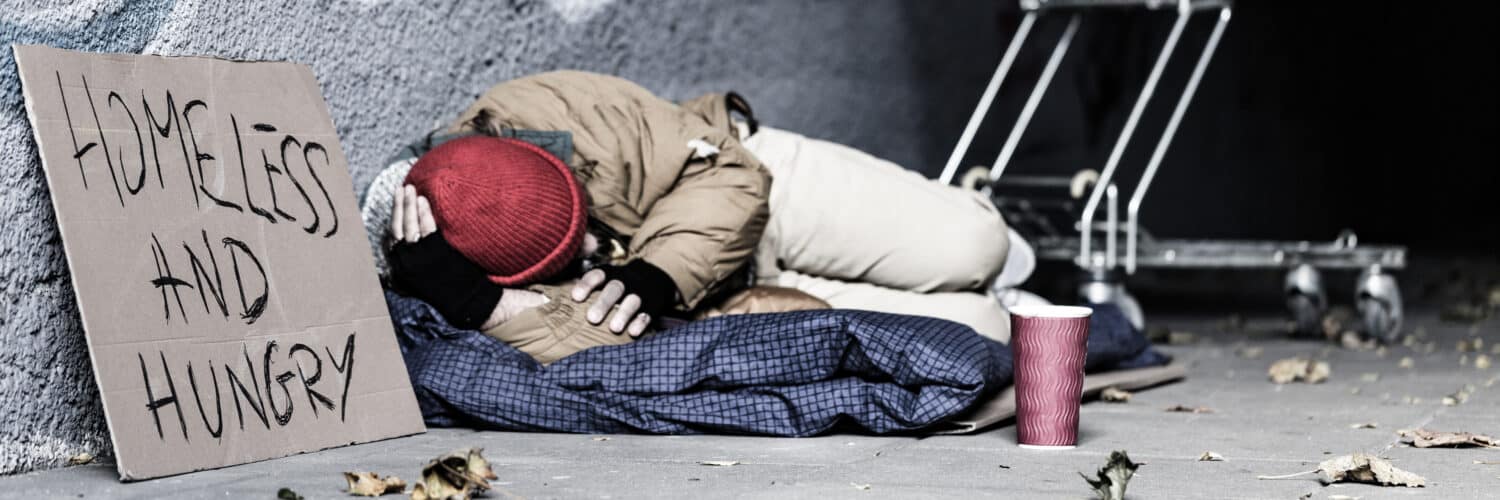
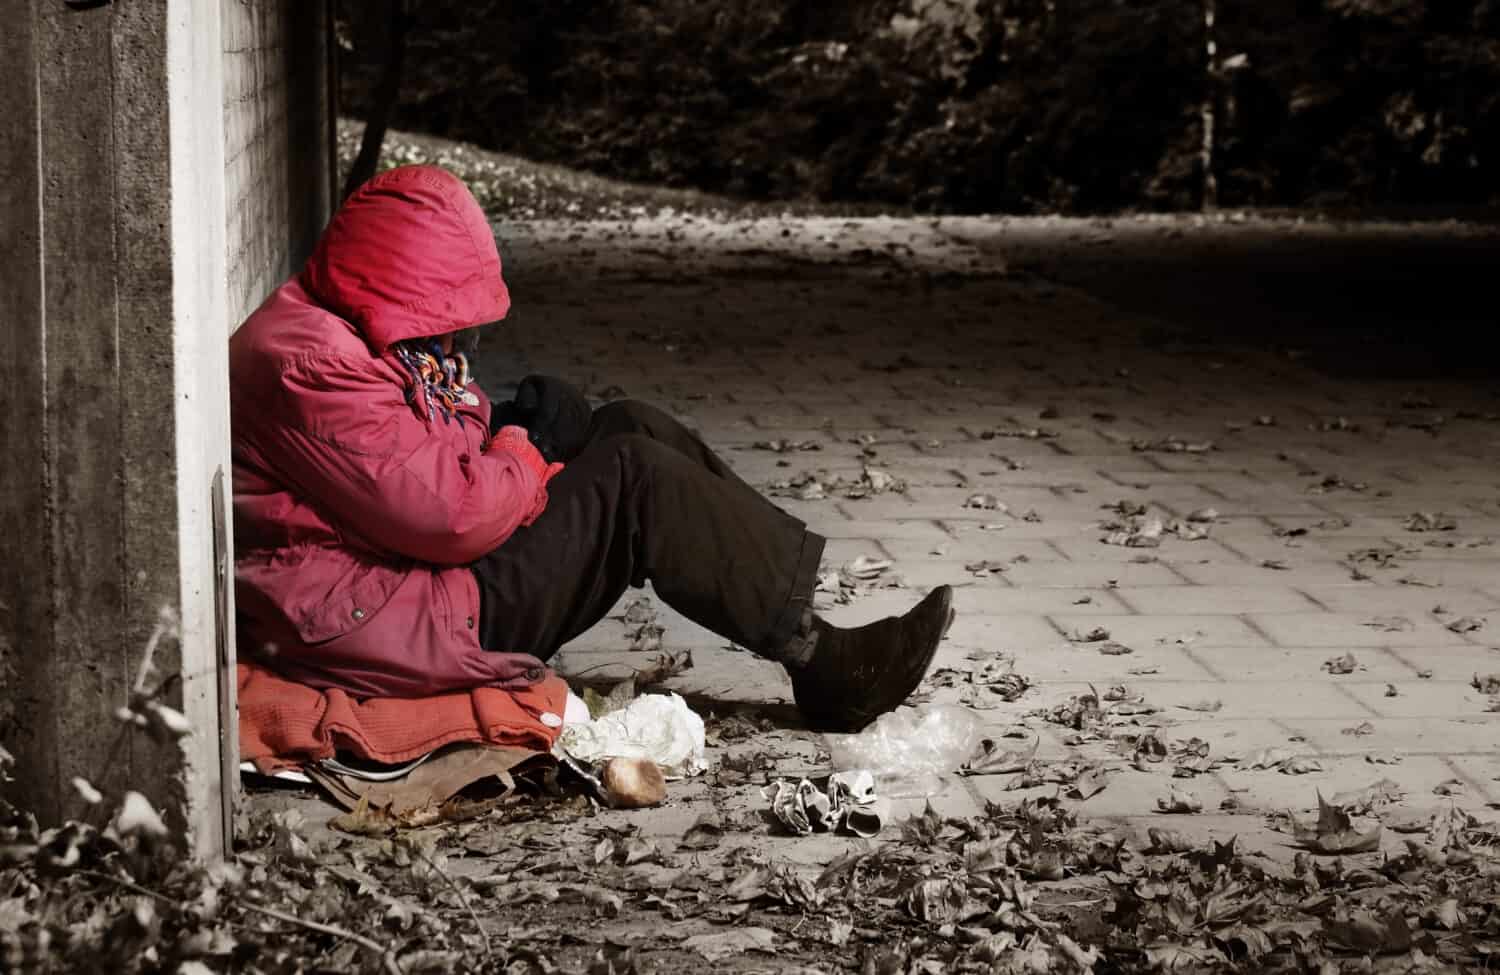
Most U.S. citizens are fortunate enough to have a home, complete with electricity and running water. However, this isn’t the case for everyone. According to the 2023 HUD Annual Homeless Assessment Report, more than 650,000 people were living on the streets in January of the same year. This is a 12% increase from 2022.
However, homelessness is not a new issue in America. Documented cases of people living without a home date back to the 1640s. The first large-scale response to homelessness from the federal government occurred alongside the Great Depression. In 1934, the Federal Transient Service helped 400,000 people with shelter and meals.
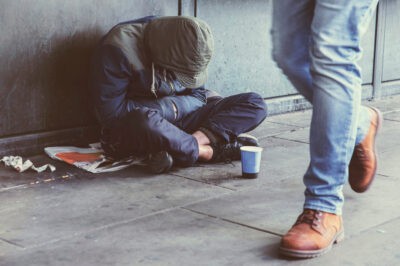
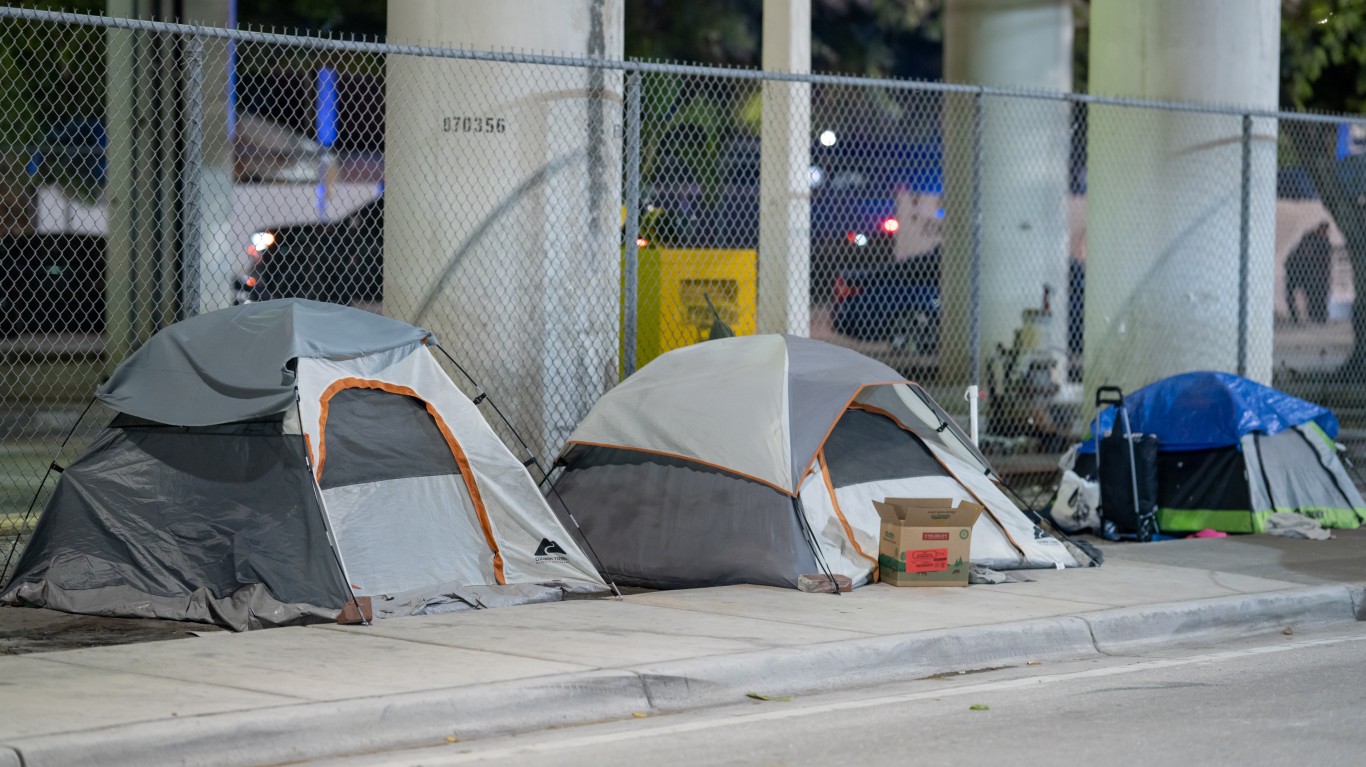
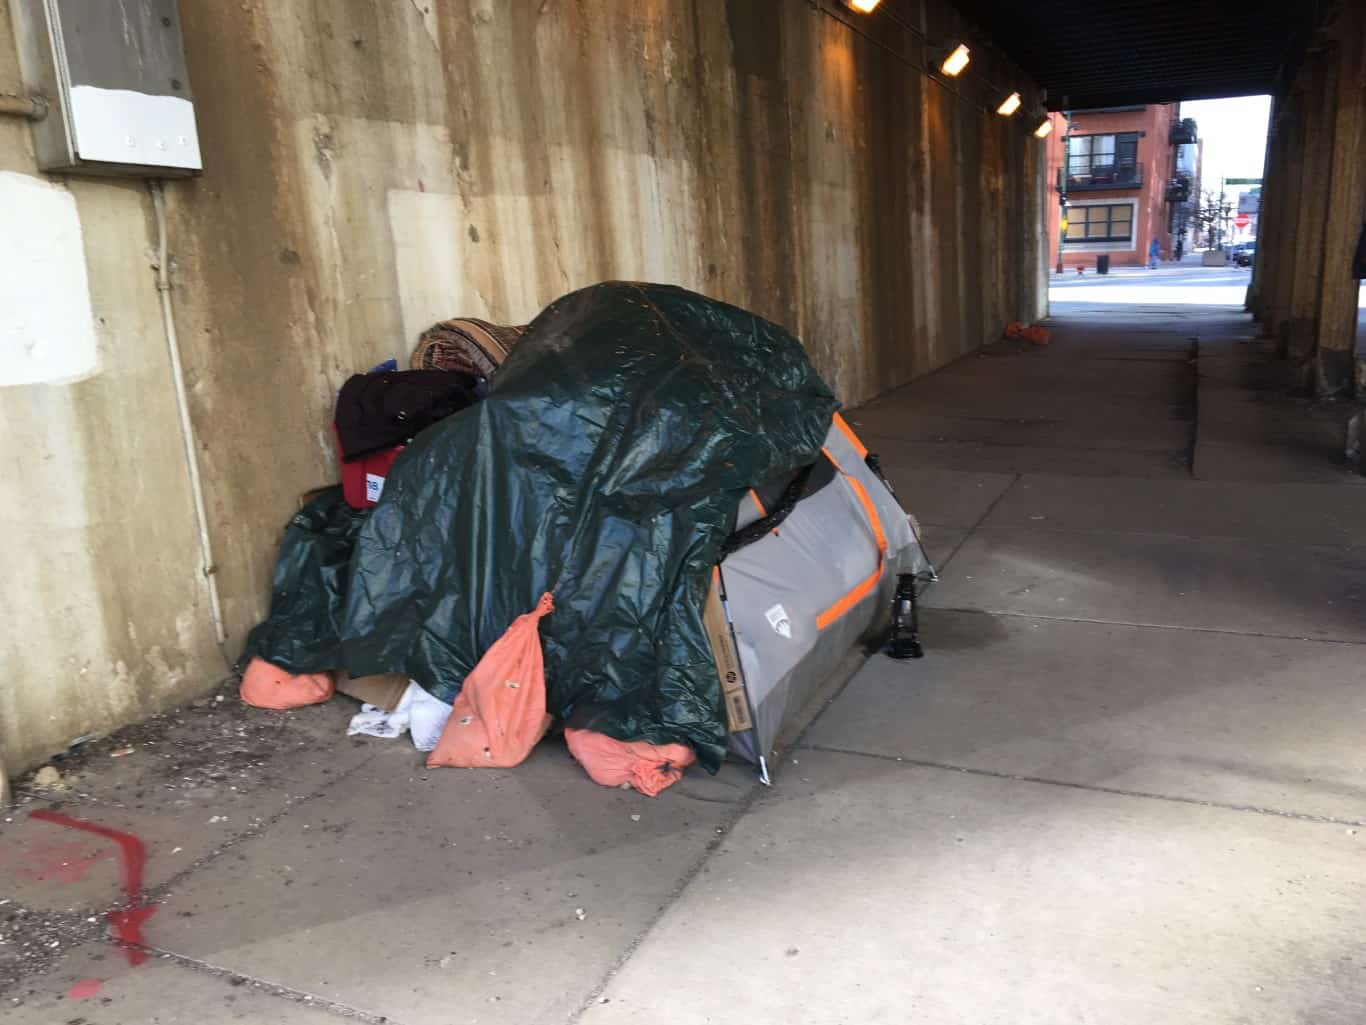
Since 2017, homelessness has been on the rise. One 2018 decision barred authorities from enforcing local ordinances that prohibit camping on public property, due to the 9th U.S. Circuit Court of Appeals ruling it was unconstitutional to punish homelessness. Among the people experiencing homelessness in 2023, 60% were staying in sheltered locations, while 40% were unsheltered.
To find the states where homelessness improved and worsened the most, 24/7 Wall St. reviewed point-in-time homelessness data from the HUD. States and the District of Columbia are ranked by the percent change in homelessness over the five-year period — 2018 to 2023. All homelessness data is from the HUD. State population totals are from the Census Bureau Vintage 2023 and from the 2018 American Community Survey. Median household income data are also from the respective annual ACSs.
Compared to 2018, when 552,830 people were experiencing homelessness nationwide, homelessness increased by 18.1% by 2023. Looking at individual states, homelessness declined in just 12 states as well as in D.C. In the rest, homelessness worsened, growing by more than the national average in 18 states, and by more than 50% in six states.
While the previously mentioned court ruling affected mostly Western states, the three states where homelessness worsened the most over the five-year period are in the Northeast.
Why We Are Talking About This
When it comes to the problem of homelessness, any potential solutions are far from simple. With mass numbers of people are the streets, many ethical questions arise. Despite the challenges, one city managed to address the issue successfully. Through the Housing First program, Houston adjusted its entire approach to get people into housing as quickly as possible. By prioritizing permanent housing over temporary shelter, Houston officials were able to cut the city’s homeless population by more than half. The following states could learn from Houston’s success.
51. District of Columbia
- Change in homelessness, 2018-2023: -28.7% (-1,982 people in total)
- Total homelessness, 2023: 4,922 — or 72.5 per 10,000 people (the highest)
- Total homelessness, 2018: 6,904 — or 98.3 per 10,000 people (the highest)
- Median household income growth: 22.6% — 25th highest (2017: $82,372; 2022: $101,027)
- Change in state population: -3.3% (2018: 702,455; 2023: 678,972)
50. Mississippi
- Change in homelessness, 2018-2023: -27.4% (-370 people in total)
- Total homelessness, 2023: 982 — or 3.3 per 10,000 people (the lowest)
- Total homelessness, 2018: 1,352 — or 4.5 per 10,000 people (the lowest)
- Median household income growth: 21.1% — 17th lowest (2017: $43,529; 2022: $52,719)
- Change in state population: -1.6% (2018: 2,986,530; 2023: 2,939,690)
49. Connecticut
- Change in homelessness, 2018-2023: -24.2% (-961 people in total)
- Total homelessness, 2023: 3,015 — or 8.3 per 10,000 people (9th lowest)
- Total homelessness, 2018: 3,976 — or 11.1 per 10,000 people (24th highest)
- Median household income growth: 19.2% — 8th lowest (2017: $74,168; 2022: $88,429)
- Change in state population: +1.2% (2018: 3,572,665; 2023: 3,617,176)
48. Maryland
- Change in homelessness, 2018-2023: -17.9% (-1,279 people in total)
- Total homelessness, 2023: 5,865 — or 9.5 per 10,000 people (17th lowest)
- Total homelessness, 2018: 7,144 — or 11.8 per 10,000 people (20th highest)
- Median household income growth: 17.6% — 4th lowest (2017: $80,776; 2022: $94,991)
- Change in state population: +2.3% (2018: 6,042,718; 2023: 6,180,253)
47. Wyoming

- Change in homelessness, 2018-2023: -16.7% (-107 people in total)
- Total homelessness, 2023: 532 — or 9.1 per 10,000 people (16th lowest)
- Total homelessness, 2018: 639 — or 11.1 per 10,000 people (25th highest)
- Median household income growth: 15.9% — the lowest (2017: $60,434; 2022: $70,042)
- Change in state population: +1.1% (2018: 577,737; 2023: 584,057)
46. Pennsylvania
- Change in homelessness, 2018-2023: -7.1% — (-956 people in total)
- Total homelessness, 2023: 12,556 — or 9.7 per 10,000 people (20th lowest)
- Total homelessness, 2018: 13,512 — or 10.6 per 10,000 people (25th lowest)
- Median household income growth: 21.3% — 18th lowest (2017: $59,195; 2022: $71,798)
- Change in state population: +1.2% (2018: 12,807,060; 2023: 12,961,683)
45. Hawaii
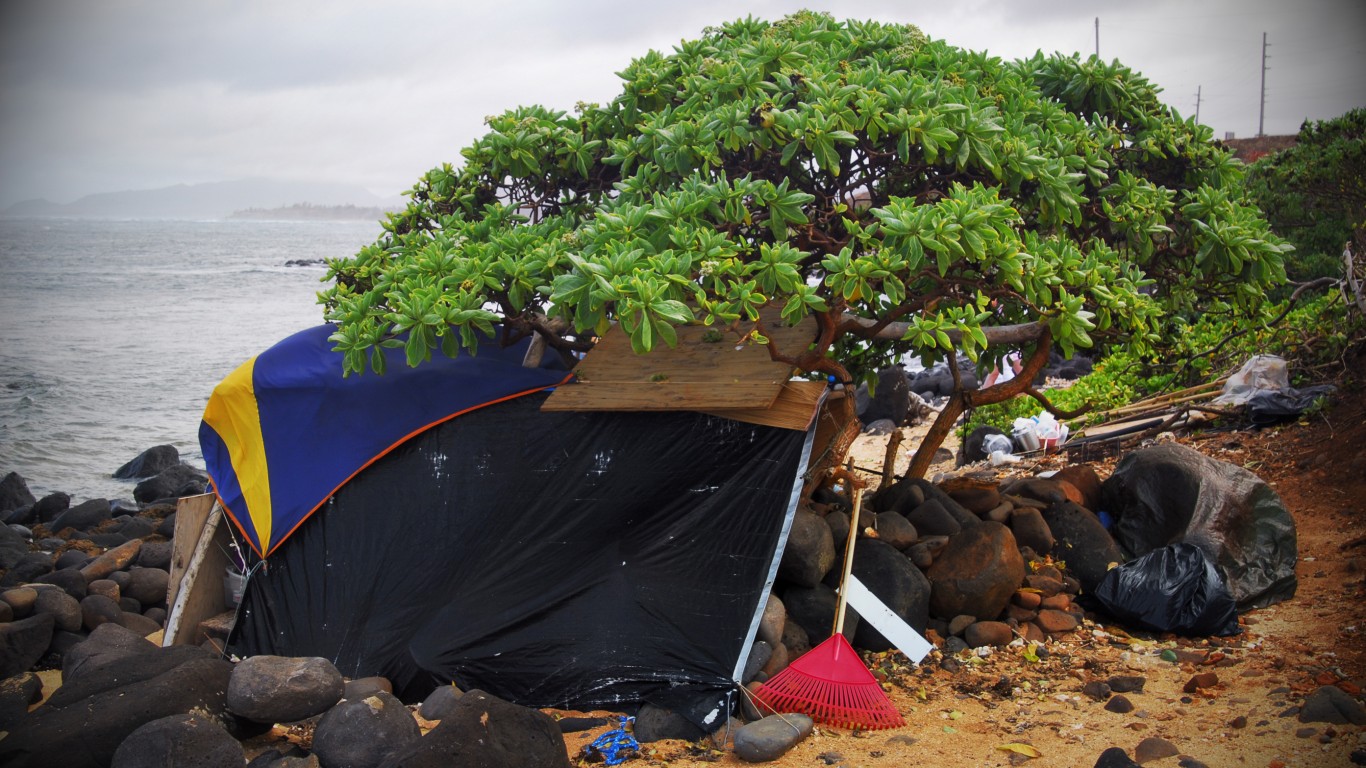
- Change in homelessness, 2018-2023: -4.7% (-307 people in total)
- Total homelessness, 2023: 6,223 — or 43.4 per 10,000 people (6th highest)
- Total homelessness, 2018: 6,530 — or 46.0 per 10,000 people (3rd highest)
- Median household income growth: 18.9% — 6th lowest (2017: $77,765; 2022: $92,458)
- Change in state population: +1.0% (2018: 1,420,491; 2023: 1,435,138)
44. Massachusetts
- Change in homelessness, 2018-2023: -4.6% — (-927 people in total)
- Total homelessness, 2023: 19,141 — or 27.3 per 10,000 people (10th highest)
- Total homelessness, 2018: 20,068 — or 29.1 per 10,000 people (7th highest)
- Median household income growth: 22.1% — 23rd lowest (2017: $77,385; 2022: $94,488)
- Change in state population: +1.4% (2018: 6,902,149; 2023: 7,001,399)
43. Arkansas
- Change in homelessness, 2018-2023: -3.8% (-103 people in total)
- Total homelessness, 2023: 2,609 — or 8.5 per 10,000 people (10th lowest)
- Total homelessness, 2018: 2,712 — or 9.0 per 10,000 people (18th lowest)
- Median household income growth: 20.8% — 15th lowest (2017: $45,869; 2022: $55,432)
- Change in state population: +1.8% (2018: 3,013,825; 2023: 3,067,732)
42. Alabama
- Change in homelessness, 2018-2023: -3.8% (-130 people in total)
- Total homelessness, 2023: 3,304 — or 6.5 per 10,000 people (2nd lowest)
- Total homelessness, 2018: 3,434 — or 7.0 per 10,000 people (5th lowest)
- Median household income growth: 24.0% — 20th highest (2017: $48,123; 2022: $59,674)
- Change in state population: +4.5% (2018: 4,887,871; 2023: 5,108,468)
41. Iowa

- Change in homelessness, 2018-2023: -3.5% (-96 people in total)
- Total homelessness, 2023: 2,653 — or 8.3 per 10,000 people (8th lowest)
- Total homelessness, 2018: 2,749 — or 8.7 per 10,000 people (14th lowest)
- Median household income growth: 18.8% — 5th lowest (2017: $58,570; 2022: $69,588)
- Change in state population: +1.6% (2018: 3,156,145; 2023: 3,207,004)
40. Wisconsin
- Change in homelessness, 2018-2023: -0.9% (-46 people in total)
- Total homelessness, 2023: 4,861 — or 8.2 per 10,000 people (7th lowest)
- Total homelessness, 2018: 4,907 — or 8.4 per 10,000 people (13th lowest)
- Median household income growth: 19.7% — 9th lowest (2017: $59,305; 2022: $70,996)
- Change in state population: +1.7% (2018: 5,813,568; 2023: 5,910,955)
39. Florida
- Change in homelessness, 2018-2023: -0.9% (-274 people in total)
- Total homelessness, 2023: 30,756 — or 13.6 per 10,000 people (20th highest)
- Total homelessness, 2018: 31,030 — or 14.6 per 10,000 people (13th highest)
- Median household income growth: 31.8% — 3rd highest (2017: $52,594; 2022: $69,303)
- Change in state population: +6.2% (2018: 21,299,325; 2023: 22,610,726)
38. Nebraska
- Change in homelessness, 2018-2023: +1.7% (+41 people in total)
- Total homelessness, 2023: 2,462 — or 12.4 per 10,000 people (22nd highest)
- Total homelessness, 2018: 2,421 — or 12.5 per 10,000 people (18th highest)
- Median household income growth: 16.1% — 2nd lowest (2017: $59,970; 2022: $69,597)
- Change in state population: +2.5% (2018: 1,929,268; 2023: 1,978,379)
37. South Carolina
- Change in homelessness, 2018-2023: +3.1% (+120 people in total)
- Total homelessness, 2023: 4,053 — or 7.5 per 10,000 people (4th lowest)
- Total homelessness, 2018: 3,933 — or 7.7 per 10,000 people (8th lowest)
- Median household income growth: 26.8% — 15th highest (2017: $50,570; 2022: $64,115)
- Change in state population: +5.7% (2018: 5,084,127; 2023: 5,373,555)
36. Louisiana
- Change in homelessness, 2018-2023: +3.6% (+110 people in total)
- Total homelessness, 2023: 3,169 — or 6.9 per 10,000 people (3rd lowest)
- Total homelessness, 2018: 3,059 — or 6.6 per 10,000 people (2nd lowest)
- Median household income growth: 20.1% — 11th lowest (2017: $46,145; 2022: $55,416)
- Change in state population: -1.9% (2018: 4,659,978; 2023: 4,573,749)
35. North Carolina

- Change in homelessness, 2018-2023: +5.2% (+486 people in total)
- Total homelessness, 2023: 9,754 — or 9.0 per 10,000 people (15th lowest)
- Total homelessness, 2018: 9,268 — or 8.9 per 10,000 people (17th lowest)
- Median household income growth: 27.9% — 11th highest (2017: $52,752; 2022: $67,481)
- Change in state population: +4.4% (2018: 10,383,620; 2023: 10,835,491)
34. Michigan
- Change in homelessness, 2018-2023: +7.7% (+646 people in total)
- Total homelessness, 2023: 8,997 — or 9.0 per 10,000 people (12th lowest)
- Total homelessness, 2018: 8,351 — or 8.4 per 10,000 people (12th lowest)
- Median household income growth: 22.0% — 21st lowest (2017: $54,909; 2022: $66,986)
- Change in state population: +0.4% (2018: 9,995,915; 2023: 10,037,261)
33. Texas
- Change in homelessness, 2018-2023: +8.2% (+2,067 people in total)
- Total homelessness, 2023: 27,377 — or 9.0 per 10,000 people (14th lowest)
- Total homelessness, 2018: 25,310 — or 8.8 per 10,000 people (16th lowest)
- Median household income growth: 22.1% — 22nd lowest (2017: $59,206; 2022: $72,284)
- Change in state population: +6.3% (2018: 28,701,845; 2023: 30,503,301)
32. New Jersey
- Change in homelessness, 2018-2023: +9.2% (+866 people in total)
- Total homelessness, 2023: 10,264 — or 11.0 per 10,000 people (25th lowest)
- Total homelessness, 2018: 9,398 — or 10.5 per 10,000 people (24th lowest)
- Median household income growth: 20.3% — 12th lowest (2017: $80,088; 2022: $96,346)
- Change in state population: +4.3% (2018: 8,908,520; 2023: 9,290,841)
31. South Dakota

- Change in homelessness, 2018-2023: +10.6% (+123 people in total)
- Total homelessness, 2023: 1,282 — or 13.9 per 10,000 people (19th highest)
- Total homelessness, 2018: 1,159 — or 13.1 per 10,000 people (16th highest)
- Median household income growth: 23.4% — 22nd highest (2017: $56,521; 2022: $69,728)
- Change in state population: +4.2% (2018: 882,235; 2023: 919,318)
30. Ohio
- Change in homelessness, 2018-2023: +11.1% (+1,137 people in total)
- Total homelessness, 2023: 11,386 — or 9.7 per 10,000 people (19th lowest)
- Total homelessness, 2018: 10,249 — or 8.8 per 10,000 people (15th lowest)
- Median household income growth: 21.7% — 19th lowest (2017: $54,021; 2022: $65,720)
- Change in state population: +0.8% (2018: 11,689,442; 2023: 11,785,935)
29. Illinois
- Change in homelessness, 2018-2023: +12.3% (+1,304 people in total)
- Total homelessness, 2023: 11,947 — or 9.5 per 10,000 people (18th lowest)
- Total homelessness, 2018: 10,643 — or 8.4 per 10,000 people (11th lowest)
- Median household income growth: 21.8% — 20th lowest (2017: $62,992; 2022: $76,708)
- Change in state population: -1.5% (2018: 12,741,080; 2023: 12,549,689)
28. New York
- Change in homelessness, 2018-2023: +12.3% (+11,303 people in total)
- Total homelessness, 2023: 103,200 — or 52.7 per 10,000 people (2nd highest)
- Total homelessness, 2018: 91,897 — or 47.0 per 10,000 people (2nd highest)
- Median household income growth: 22.6% — 25th lowest (2017: $64,894; 2022: $79,557)
- Change in state population: +0.1% (2018: 19,542,209; 2023: 19,571,216)
27. Virginia
- Change in homelessness, 2018-2023: +13.2% (+786 people in total)
- Total homelessness, 2023: 6,761 — or 7.8 per 10,000 people (5th lowest)
- Total homelessness, 2018: 5,975 — or 7.0 per 10,000 people (4th lowest)
- Median household income growth: 20.0% — 10th lowest (2017: $71,535; 2022: $85,873)
- Change in state population: +2.3% (2018: 8,517,685; 2023: 8,715,698)
26. West Virginia

- Change in homelessness, 2018-2023: +13.9% (+173 people in total)
- Total homelessness, 2023: 1,416 — or 8.0 per 10,000 people (6th lowest)
- Total homelessness, 2018: 1,243 — or 6.9 per 10,000 people (3rd lowest)
- Median household income growth: 25.0% — 18th highest (2017: $43,469; 2022: $54,329)
- Change in state population: -2.0% (2018: 1,805,832; 2023: 1,770,071)
25. Missouri
- Change in homelessness, 2018-2023: +14.0% (+825 people in total)
- Total homelessness, 2023: 6,708 — or 10.8 per 10,000 people (24th lowest)
- Total homelessness, 2018: 5,883 — or 9.6 per 10,000 people (21st lowest)
- Median household income growth: 21.0% — 16th lowest (2017: $53,578; 2022: $64,811)
- Change in state population: +1.1% (2018: 6,126,452; 2023: 6,196,156)
24. Idaho
- Change in homelessness, 2018-2023: +14.2% (+286 people in total)
- Total homelessness, 2023: 2,298 — or 11.7 per 10,000 people (24th highest)
- Total homelessness, 2018: 2,012 — or 11.5 per 10,000 people (22nd highest)
- Median household income growth: 39.4% — the highest (2017: $52,225; 2022: $72,785)
- Change in state population: +12.0% (2018: 1,754,208; 2023: 1,964,726)
23. Indiana
- Change in homelessness, 2018-2023: +14.4% (+759 people in total)
- Total homelessness, 2023: 6,017 — or 8.8 per 10,000 people (11th lowest)
- Total homelessness, 2018: 5,258 — or 7.9 per 10,000 people (9th lowest)
- Median household income growth: 23.3% — 23rd highest (2017: $54,181; 2022: $66,785)
- Change in state population: +2.5% (2018: 6,691,878; 2023: 6,862,199)
22. Nevada

- Change in homelessness, 2018-2023: +14.9% (+1,122 people in total)
- Total homelessness, 2023: 8,666 — or 27.1 per 10,000 people (11th highest)
- Total homelessness, 2018: 7,544 — or 24.9 per 10,000 people (9th highest)
- Median household income growth: 24.7% — 19th highest (2017: $58,003; 2022: $72,333)
- Change in state population: +5.3% (2018: 3,034,392; 2023: 3,194,176)
21. Delaware
- Change in homelessness, 2018-2023: +15.1% (+163 people in total)
- Total homelessness, 2023: 1,245 — or 12.1 per 10,000 people (23rd highest)
- Total homelessness, 2018: 1,082 — or 11.2 per 10,000 people (23rd highest)
- Median household income growth: 30.7% — 4th highest (2017: $62,852; 2022: $82,174)
- Change in state population: +6.7% (2018: 967,171; 2023: 1,031,890)
20. Minnesota

- Change in homelessness, 2018-2023: +15.9% (+1,150 people in total)
- Total homelessness, 2023: 8,393 — or 14.6 per 10,000 people (18th highest)
- Total homelessness, 2018: 7,243 — or 12.9 per 10,000 people (17th highest)
- Median household income growth: 20.4% — 13th lowest (2017: $68,388; 2022: $82,338)
- Change in state population: +2.3% (2018: 5,611,179; 2023: 5,737,915)
19. Tennessee
- Change in homelessness, 2018-2023: +16.9% (+1,332 people in total)
- Total homelessness, 2023: 9,215 — or 12.9 per 10,000 people (21st highest)
- Total homelessness, 2018: 7,883 — or 11.6 per 10,000 people (21st highest)
- Median household income growth: 27.1% — 14th highest (2017: $51,340; 2022: $65,254)
- Change in state population: +5.3% (2018: 6,770,010; 2023: 7,126,489)
18. Kansas
- Change in homelessness, 2018-2023: +19.0% (+420 people in total)
- Total homelessness, 2023: 2,636 — or 9.0 per 10,000 people (13th lowest)
- Total homelessness, 2018: 2,216 — or 7.6 per 10,000 people (7th lowest)
- Median household income growth: 22.2% — 24th lowest (2017: $56,422; 2022: $68,925)
- Change in state population: +1.0% (2018: 2,911,510; 2023: 2,940,546)
17. Oklahoma
- Change in homelessness, 2018-2023: +20.1% (+777 people in total)
- Total homelessness, 2023: 4,648 — or 11.5 per 10,000 people (25th highest)
- Total homelessness, 2018: 3,871 — or 9.8 per 10,000 people (22nd lowest)
- Median household income growth: 19.2% — 7th lowest (2017: $50,051; 2022: $59,673)
- Change in state population: +2.8% (2018: 3,943,079; 2023: 4,053,824)
16. Washington
- Change in homelessness, 2018-2023: +25.7% (+5,732 people in total)
- Total homelessness, 2023: 28,036 — or 35.9 per 10,000 people (7th highest)
- Total homelessness, 2018: 22,304 — or 29.6 per 10,000 people (6th highest)
- Median household income growth: 28.6% — 9th highest (2017: $70,979; 2022: $91,306)
- Change in state population: +3.7% (2018: 7,535,591; 2023: 7,812,880)
15. Utah
- Change in homelessness, 2018-2023: +28.2% (+811 people in total)
- Total homelessness, 2023: 3,687 — or 10.8 per 10,000 people (23rd lowest)
- Total homelessness, 2018: 2,876 — or 9.1 per 10,000 people (20th lowest)
- Median household income growth: 30.4% — 5th highest (2017: $68,358; 2022: $89,168)
- Change in state population: +8.1% (2018: 3,161,105; 2023: 3,417,734)
14. Kentucky

- Change in homelessness, 2018-2023: +29.2% (+1,078 people in total)
- Total homelessness, 2023: 4,766 — or 10.5 per 10,000 people (22nd lowest)
- Total homelessness, 2018: 3,688 — or 8.3 per 10,000 people (10th lowest)
- Median household income growth: 22.7% — 24th highest (2017: $48,375; 2022: $59,341)
- Change in state population: +1.3% (2018: 4,468,402; 2023: 4,526,154)
13. Georgia
- Change in homelessness, 2018-2023: +29.4% (+2,795 people in total)
- Total homelessness, 2023: 12,294 — or 11.1 per 10,000 people (26th highest)
- Total homelessness, 2018: 9,499 — or 9.0 per 10,000 people (19th lowest)
- Median household income growth: 29.6% — 6th highest (2017: $56,183; 2022: $72,837)
- Change in state population: +4.8% (2018: 10,519,475; 2023: 11,029,227)
12. Alaska

- Change in homelessness, 2018-2023: +29.7% (+598 people in total)
- Total homelessness, 2023: 2,614 — or 35.6 per 10,000 people (8th highest)
- Total homelessness, 2018: 2,016 — or 27.3 per 10,000 people (8th highest)
- Median household income growth: 20.4% — 14th lowest (2017: $73,181; 2022: $88,121)
- Change in state population: -0.5% (2018: 737,438; 2023: 733,406)
11. Colorado

- Change in homelessness, 2018-2023: +33.0% (+3,582 people in total)
- Total homelessness, 2023: 14,439 — or 24.6 per 10,000 people (12th highest)
- Total homelessness, 2018: 10,857 — or 19.1 per 10,000 people (11th highest)
- Median household income growth: 29.2% — 7th highest (2017: $69,117; 2022: $89,302)
- Change in state population: +3.2% (2018: 5,695,564; 2023: 5,877,610)
10. Oregon
- Change in homelessness, 2018-2023: +39.1% (+5,666 people in total)
- Total homelessness, 2023: 20,142 — or 47.6 per 10,000 people (4th highest)
- Total homelessness, 2018: 14,476 — or 34.5 per 10,000 people (4th highest)
- Median household income growth: 25.7% — 17th highest (2017: $60,212; 2022: $75,657)
- Change in state population: +1.0% (2018: 4,190,713; 2023: 4,233,358)
9. California
- Change in homelessness, 2018-2023: +39.6% (+51,427 people in total)
- Total homelessness, 2023: 181,399 — or 46.6 per 10,000 people (5th highest)
- Total homelessness, 2018: 129,972 — or 32.9 per 10,000 people (5th highest)
- Median household income growth: 27.5% — 13th highest (2017: $71,805; 2022: $91,551)
- Change in state population: -1.5% (2018: 39,557,045; 2023: 38,965,193)
8. Arizona
- Change in homelessness, 2018-2023: +44.3% (+4,372 people in total)
- Total homelessness, 2023: 14,237 — or 19.2 per 10,000 people (14th highest)
- Total homelessness, 2018: 9,865 — or 13.8 per 10,000 people (14th highest)
- Median household income growth: 31.8% — 2nd highest (2017: $56,581; 2022: $74,568)
- Change in state population: +3.6% (2018: 7,171,646; 2023: 7,431,344)
7. North Dakota
- Change in homelessness, 2018-2023: +44.6% (+242 people in total)
- Total homelessness, 2023: 784 — or 10.0 per 10,000 people (21st lowest)
- Total homelessness, 2018: 542 — or 7.1 per 10,000 people (6th lowest)
- Median household income growth: 16.4% — 3rd lowest (2017: $61,843; 2022: $71,970)
- Change in state population: +3.1% (2018: 760,077; 2023: 783,926)
6. New Mexico
- Change in homelessness, 2018-2023: +50.6% (+1,291 people in total)
- Total homelessness, 2023: 3,842 — or 18.2 per 10,000 people (15th highest)
- Total homelessness, 2018: 2,551 — or 12.2 per 10,000 people (19th highest)
- Median household income growth: 27.8% — 12th highest (2017: $46,744; 2022: $59,726)
- Change in state population: +0.9% (2018: 2,095,428; 2023: 2,114,371)
5. Montana

- Change in homelessness, 2018-2023: 55.0% — (+773 people in total)
- Total homelessness, 2023: 2,178 — or 19.2 per 10,000 people (13th highest)
- Total homelessness, 2018: 1,405 — or 13.2 per 10,000 people (15th highest)
- Median household income growth: 26.7% — 16th highest (2017: $53,386; 2022: $67,631)
- Change in state population: +6.6% (2018: 1,062,305; 2023: 1,132,812)
4. Rhode Island

- Change in homelessness, 2018-2023: +64.4% (+709 people in total)
- Total homelessness, 2023: 1,810 — or 16.5 per 10,000 people (17th highest)
- Total homelessness, 2018: 1,101 — or 10.4 per 10,000 people (23rd lowest)
- Median household income growth: 28.2% — 10th highest (2017: $63,870; 2022: $81,854)
- Change in state population: +3.7% (2018: 1,057,315; 2023: 1,095,962)
3. New Hampshire
- Change in homelessness, 2018-2023: +68.3% (+991 people in total)
- Total homelessness, 2023: 2,441 — or 17.4 per 10,000 people (16th highest)
- Total homelessness, 2018: 1,450 — or 10.7 per 10,000 people (26th highest)
- Median household income growth: 22.6% — 26th highest (2017: $73,381; 2022: $89,992)
- Change in state population: +3.4% (2018: 1,356,458; 2023: 1,402,054)
2. Maine
- Change in homelessness, 2018-2023: +69.2% (+1,742 people in total)
- Total homelessness, 2023: 4,258 — or 30.5 per 10,000 people (9th highest)
- Total homelessness, 2018: 2,516 — or 18.8 per 10,000 people (12th highest)
- Median household income growth: 23.6% — 21st highest (2017: $56,277; 2022: $69,543)
- Change in state population: +4.3% (2018: 1,338,404; 2023: 1,395,722)
1. Vermont

- Change in homelessness, 2018-2023: +155.2% (+2,004 people in total)
- Total homelessness, 2023: 3,295 — or 50.9 per 10,000 people (3rd highest)
- Total homelessness, 2018: 1,291 — or 20.6 per 10,000 people (10th highest)
- Median household income growth: 28.7% — 8th highest (2017: $57,513; 2022: $73,991)
- Change in state population: +3.4% (2018: 626,299; 2023: 647,464)