24/7 Wall St. Insights
- Since the start of the COVID-19 pandemic, supply and demand dynamics have sent home prices surging by nearly 38%.
- Coupled with historically high mortgage rates, rising home prices have made homeownership prohibitively expensive for large segments of the population.
- Still, when accounting for income, some cities in California are far more affordable for prospective home buyers than others.
- Also: Discover the next Nvidia
The United States is facing a housing affordability crisis. While overall inflation has cooled to 2.5% from a multi-decade high of 9.1% in June 2022 — at 5.4% as recently as August 2024, the Consumer Price Index for housing remains stubbornly high. And in much of the country, home prices are well above what millions of Americans can afford.
According to data from Realtor.com, the median list price for a single-family home in the U.S. was $437,450 in July 2024 — up about $118,500 from the start of the pandemic. In addition to the surge in list prices, most homebuyers are further burdened by historically high borrowing costs. For the first time since 2008, the average interest rate on a 30-year fixed mortgage exceeded 6% in September 2022, and it has remained above that threshold for the last two years. (Here is a look at the 23 cities where most homes are selling for less than $125,000.)
Even though the cost of homeownership has soared in recent years, the question of affordability also hinges on earnings and wealth. Multiple recent studies have found that it would take an annual income of over $100,000 to comfortably afford a typical home in the United States — and most American workers are making less than half that amount. As of May 2023, the median annual wage across all occupations in the U.S. was just $48,060, according to the Bureau of Labor Statistics.
Based on these numbers, the typical American home now costs about 9.1 times more than a typical worker’s annual earnings. Still, because both incomes and home prices vary across the country, housing affordability does too. In California, for example, housing is generally less affordable than it is nationwide. The typical home in California is listed for $777,900, about 14.4 times more than the state’s median annual wage of $54,030.
Even within California, housing affordability varies considerably by market. Of the 26 metropolitan areas in the state with available data from both Realtor.com and the BLS, median home prices are anywhere from about 8.1 to 47.8 times higher than the median annual wage. (These are 10 things to consider before buying a home for retirement.)
Accounting for both incomes and home prices, these are the most (and least) affordable housing markets in California, ranked. Supplemental data on median home size and year-over-year price changes are also from Realtor.com.
Why It Matters

Fueled by supply shortages and rising demand, home prices have surged since the start of the pandemic. More recently, the financial burden of higher home prices has been exacerbated by historically high mortgage rates, pricing millions of Americans out of the market. Still, housing affordability is contingent upon income, and some major markets in California are far more affordable for prospective buyers than others.
26. Hanford-Corcoran, CA

- Income to home price ratio: 8.1 to 1
- Median home list price in July 2024: $380,000 (51.2% lower than median home price in California)
- Median annual wage across all occupations: $46,980 (13.0% lower than median wage in California)
- Median size of a listed home in July 2024: 1,609 square feet (10.6% smaller than a typical home in California)
- 1-year change in median home list price: -4.6%
25. El Centro, CA

- Income to home price ratio: 8.6 to 1
- Median home list price in July 2024: $371,000 (52.3% lower than median home price in California)
- Median annual wage across all occupations: $43,210 (20.0% lower than median wage in California)
- Median size of a listed home in July 2024: 1,628 square feet (9.6% smaller than a typical home in California)
- 1-year change in median home list price: +3.1%
24. Bakersfield, CA

- Income to home price ratio: 9.0 to 1
- Median home list price in July 2024: $402,450 (48.3% lower than median home price in California)
- Median annual wage across all occupations: $44,960 (16.8% lower than median wage in California)
- Median size of a listed home in July 2024: 1,735 square feet (3.6% smaller than a typical home in California)
- 1-year change in median home list price: +0.9%
23. Chico, CA
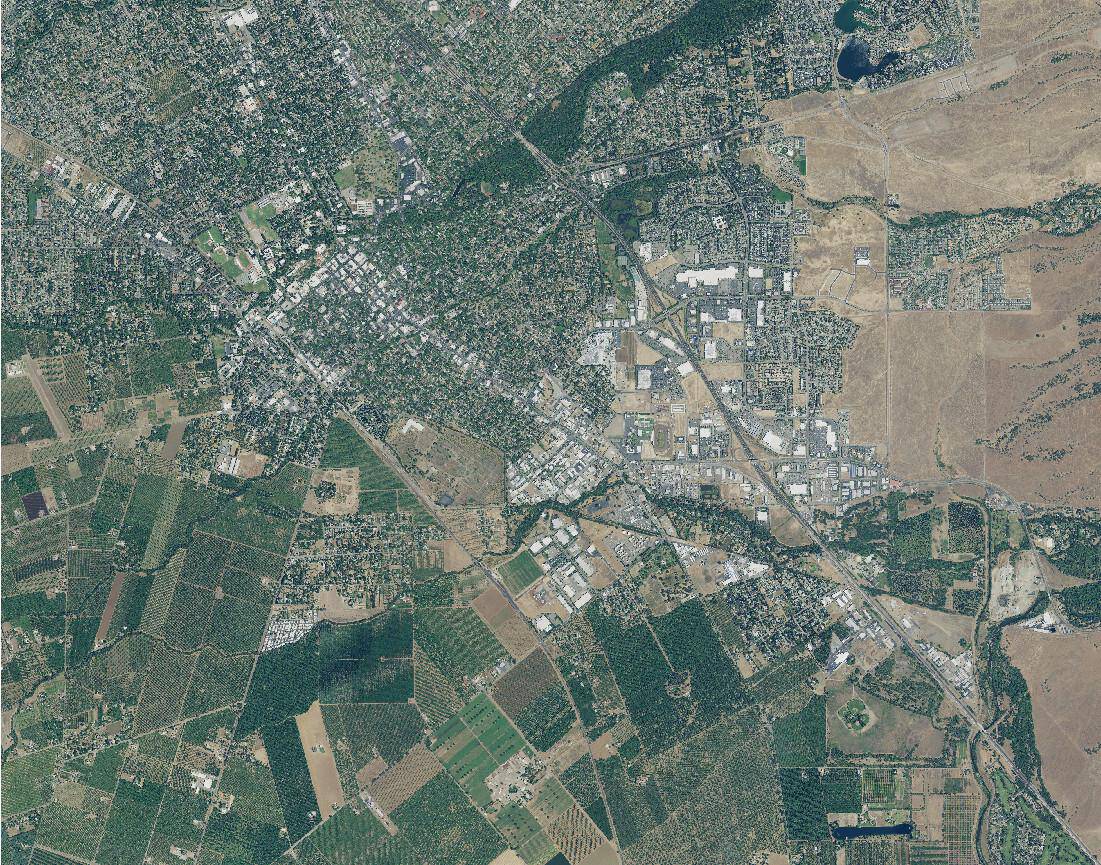
- Income to home price ratio: 9.5 to 1
- Median home list price in July 2024: $436,000 (44.0% lower than median home price in California)
- Median annual wage across all occupations: $46,110 (14.7% lower than median wage in California)
- Median size of a listed home in July 2024: 1,725 square feet (4.2% smaller than a typical home in California)
- 1-year change in median home list price: +1.4%
22. Redding, CA

- Income to home price ratio: 9.5 to 1
- Median home list price in July 2024: $437,475 (43.8% lower than median home price in California)
- Median annual wage across all occupations: $45,950 (15.0% lower than median wage in California)
- Median size of a listed home in July 2024: 1,767 square feet (1.8% smaller than a typical home in California)
- 1-year change in median home list price: -3.9%
21. Visalia-Porterville, CA

- Income to home price ratio: 10.0 to 1
- Median home list price in July 2024: $425,000 (45.4% lower than median home price in California)
- Median annual wage across all occupations: $42,350 (21.6% lower than median wage in California)
- Median size of a listed home in July 2024: 1,800 square feet (in line with a typical home in California)
- 1-year change in median home list price: -1.2%
20. Yuba City, CA

- Income to home price ratio: 10.2 to 1
- Median home list price in July 2024: $477,000 (38.7% lower than median home price in California)
- Median annual wage across all occupations: $46,810 (13.4% lower than median wage in California)
- Median size of a listed home in July 2024: 1,827 square feet (1.5% larger than a typical home in California)
- 1-year change in median home list price: -0.4%
19. Fresno, CA

- Income to home price ratio: 10.5 to 1
- Median home list price in July 2024: $469,450 (39.7% lower than median home price in California)
- Median annual wage across all occupations: $44,530 (17.6% lower than median wage in California)
- Median size of a listed home in July 2024: 1,868 square feet (3.8% larger than a typical home in California)
- 1-year change in median home list price: -1.2%
18. Merced, CA

- Income to home price ratio: 10.8 to 1
- Median home list price in July 2024: $478,161 (38.5% lower than median home price in California)
- Median annual wage across all occupations: $44,190 (18.2% lower than median wage in California)
- Median size of a listed home in July 2024: 1,760 square feet (2.2% smaller than a typical home in California)
- 1-year change in median home list price: +6.5%
17. Modesto, CA

- Income to home price ratio: 11.2 to 1
- Median home list price in July 2024: $534,000 (31.4% lower than median home price in California)
- Median annual wage across all occupations: $47,720 (11.7% lower than median wage in California)
- Median size of a listed home in July 2024: 1,800 square feet (In line with a typical home in California)
- 1-year change in median home list price: +2.2%
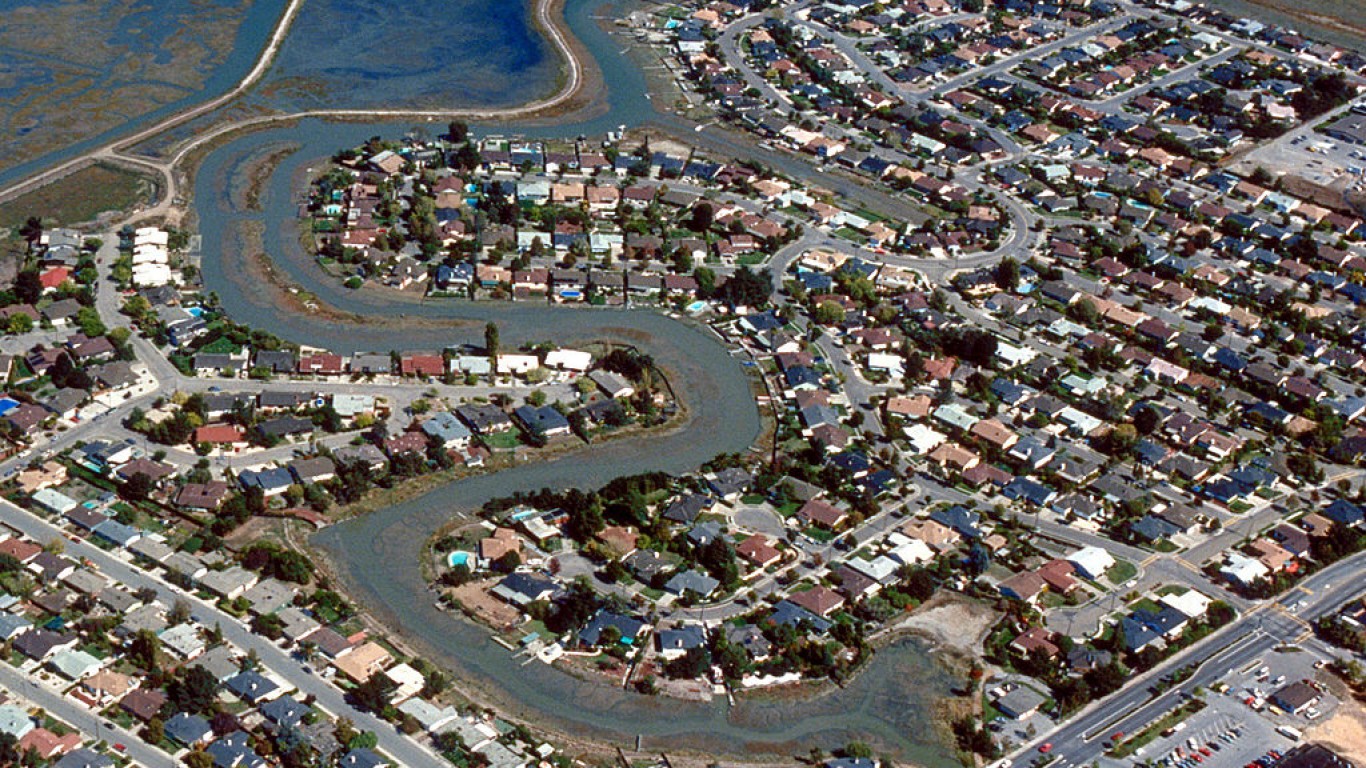
16. Vallejo-Fairfield, CA
- Income to home price ratio: 11.5 to 1
- Median home list price in July 2024: $617,125 (20.7% lower than median home price in California)
- Median annual wage across all occupations: $53,520 (0.9% lower than median wage in California)
- Median size of a listed home in July 2024: 1,772 square feet (1.6% smaller than a typical home in California)
- 1-year change in median home list price: -1.2%
15. Sacramento–Roseville–Arden-Arcade, CA

- Income to home price ratio: 11.8 to 1
- Median home list price in July 2024: $652,500 (16.1% lower than median home price in California)
- Median annual wage across all occupations: $55,290 (2.3% higher than median wage in California)
- Median size of a listed home in July 2024: 1,902 square feet (5.7% larger than a typical home in California)
- 1-year change in median home list price: -3.5%
14. Madera, CA
- Income to home price ratio: 12.0 to 1
- Median home list price in July 2024: $524,638 (32.6% lower than median home price in California)
- Median annual wage across all occupations: $43,580 (19.3% lower than median wage in California)
- Median size of a listed home in July 2024: 2,025 square feet (12.5% larger than a typical home in California)
- 1-year change in median home list price: +4.7%
13. Stockton-Lodi, CA

- Income to home price ratio: 12.3 to 1
- Median home list price in July 2024: $593,500 (23.7% lower than median home price in California)
- Median annual wage across all occupations: $48,370 (10.5% lower than median wage in California)
- Median size of a listed home in July 2024: 1,868 square feet (3.8% larger than a typical home in California)
- 1-year change in median home list price: +1.0%
12. Riverside-San Bernardino-Ontario, CA
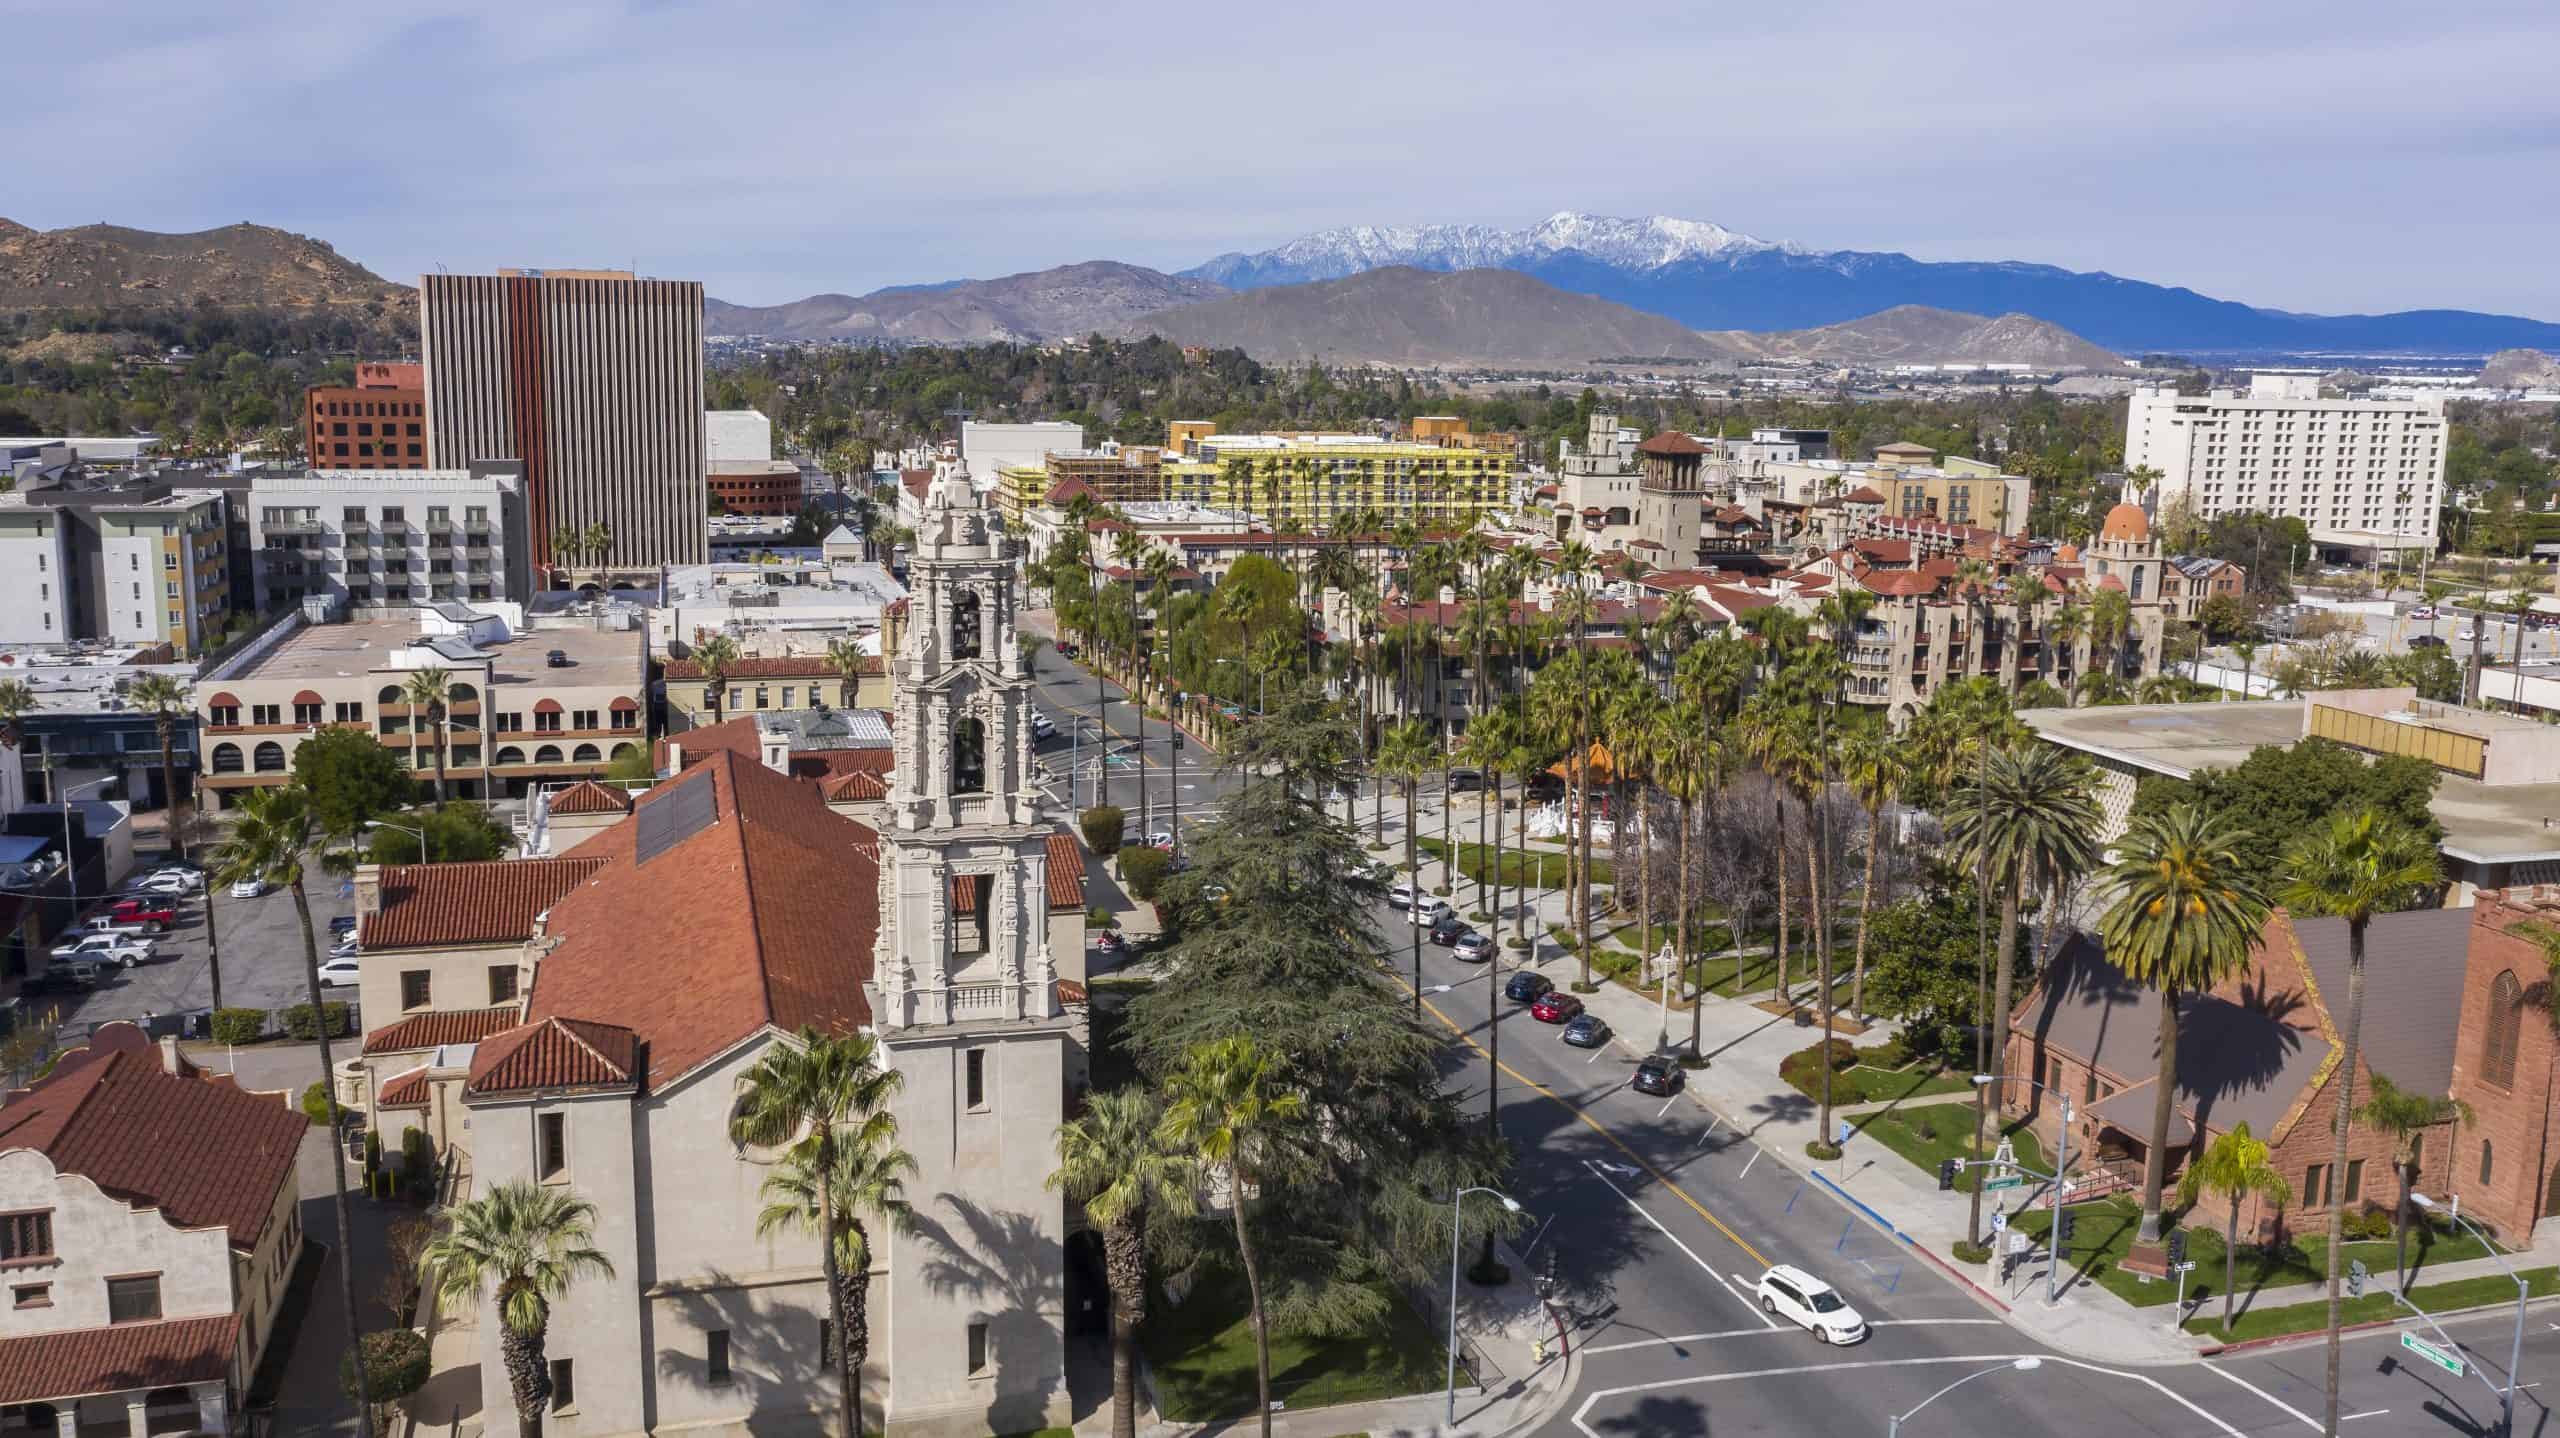
- Income to home price ratio: 12.6 to 1
- Median home list price in July 2024: $600,000 (22.9% lower than median home price in California)
- Median annual wage across all occupations: $47,450 (12.2% lower than median wage in California)
- Median size of a listed home in July 2024: 1,815 square feet (0.8% larger than a typical home in California)
- 1-year change in median home list price: +2.6%
11. San Francisco-Oakland-Hayward, CA

- Income to home price ratio: 13.5 to 1
- Median home list price in July 2024: $973,875 (25.2% higher than median home price in California)
- Median annual wage across all occupations: $72,050 (33.4% higher than median wage in California)
- Median size of a listed home in July 2024: 1,533 square feet (14.8% smaller than a typical home in California)
- 1-year change in median home list price: -11.5%
10. San Jose-Sunnyvale-Santa Clara, CA

- Income to home price ratio: 17.2 to 1
- Median home list price in July 2024: $1,399,750 (79.9% higher than median home price in California)
- Median annual wage across all occupations: $81,470 (50.8% higher than median wage in California)
- Median size of a listed home in July 2024: 1,671 square feet (7.2% smaller than a typical home in California)
- 1-year change in median home list price: -6.6%
9. San Diego-Carlsbad, CA

- Income to home price ratio: 19.6 to 1
- Median home list price in July 2024: $1,038,750 (33.5% higher than median home price in California)
- Median annual wage across all occupations: $53,090 (1.7% lower than median wage in California)
- Median size of a listed home in July 2024: 1,688 square feet (6.2% smaller than a typical home in California)
- 1-year change in median home list price: -5.4%
8. Santa Rosa, CA

- Income to home price ratio: 20.3 to 1
- Median home list price in July 2024: $1,050,000 (35.0% higher than median home price in California)
- Median annual wage across all occupations: $51,670 (4.4% lower than median wage in California)
- Median size of a listed home in July 2024: 1,937 square feet (7.6% larger than a typical home in California)
- 1-year change in median home list price: -2.7%
7. Oxnard-Thousand Oaks-Ventura, CA

- Income to home price ratio: 23.5 to 1
- Median home list price in July 2024: $1,135,000 (45.9% higher than median home price in California)
- Median annual wage across all occupations: $48,380 (10.5% lower than median wage in California)
- Median size of a listed home in July 2024: 1,975 square feet (9.7% larger than a typical home in California)
- 1-year change in median home list price: +5.6%
6. Los Angeles-Long Beach-Anaheim, CA

- Income to home price ratio: 24.3 to 1
- Median home list price in July 2024: $1,225,434 (57.5% higher than median home price in California)
- Median annual wage across all occupations: $50,490 (6.6% lower than median wage in California)
- Median size of a listed home in July 2024: 1,839 square feet (2.2% larger than a typical home in California)
- 1-year change in median home list price: +2.6%
5. San Luis Obispo-Paso Robles-Arroyo Grande, CA
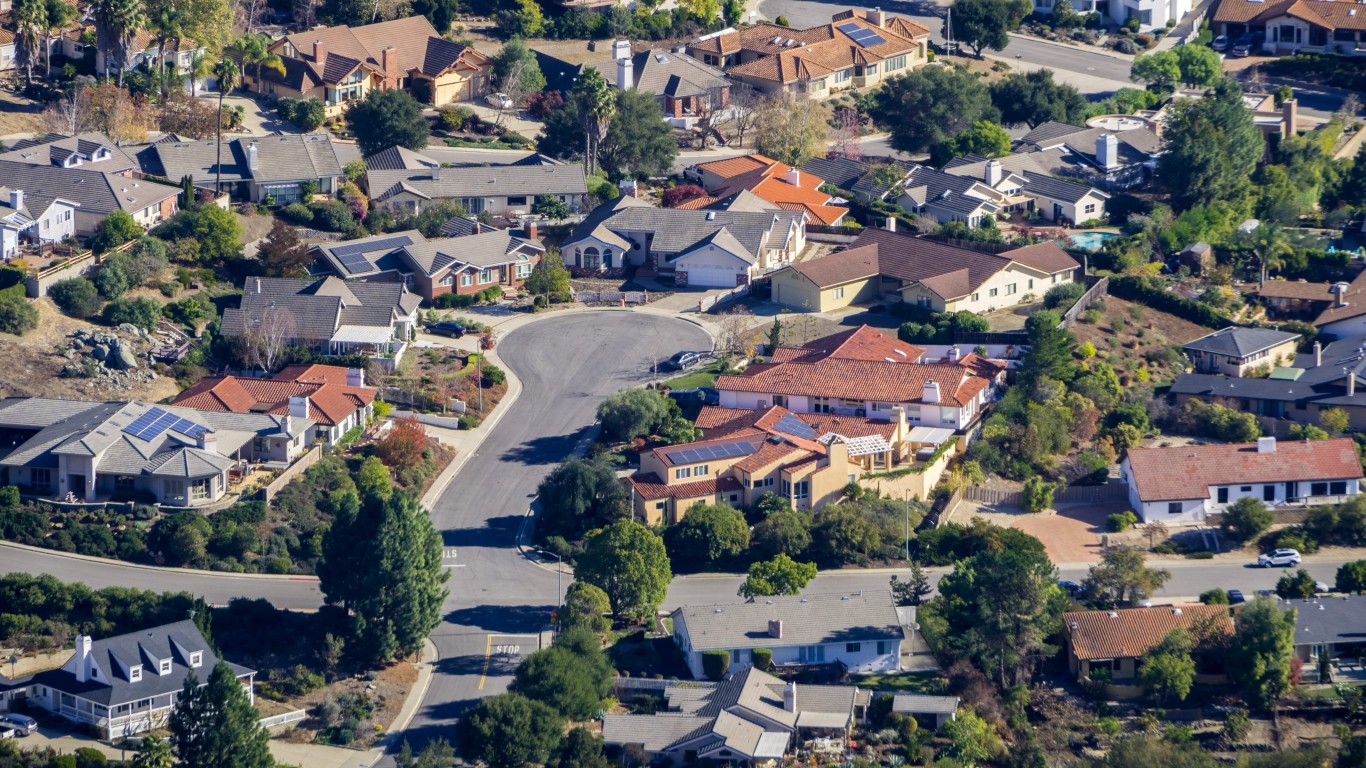
- Income to home price ratio: 24.6 to 1
- Median home list price in July 2024: $1,174,950 (51.0% higher than median home price in California)
- Median annual wage across all occupations: $47,700 (11.7% lower than median wage in California)
- Median size of a listed home in July 2024: 1,938 square feet (7.7% larger than a typical home in California)
- 1-year change in median home list price: +9.3%
4. Santa Cruz-Watsonville, CA

- Income to home price ratio: 26.6 to 1
- Median home list price in July 2024: $1,298,500 (66.9% higher than median home price in California)
- Median annual wage across all occupations: $48,900 (9.5% lower than median wage in California)
- Median size of a listed home in July 2024: 1,615 square feet (10.3% smaller than a typical home in California)
- 1-year change in median home list price: -5.6%
3. Salinas, CA

- Income to home price ratio: 30.2 to 1
- Median home list price in July 2024: $1,343,944 (72.8% higher than median home price in California)
- Median annual wage across all occupations: $44,570 (17.5% lower than median wage in California)
- Median size of a listed home in July 2024: 1,918 square feet (6.6% larger than a typical home in California)
- 1-year change in median home list price: -3.7%
2. Napa, CA

- Income to home price ratio: 31.7 to 1
- Median home list price in July 2024: $1,624,750 (108.9% higher than median home price in California)
- Median annual wage across all occupations: $51,200 (5.2% lower than median wage in California)
- Median size of a listed home in July 2024: 2,186 square feet (21.4% larger than a typical home in California)
- 1-year change in median home list price: -4.3%
1. Santa Maria-Santa Barbara, CA
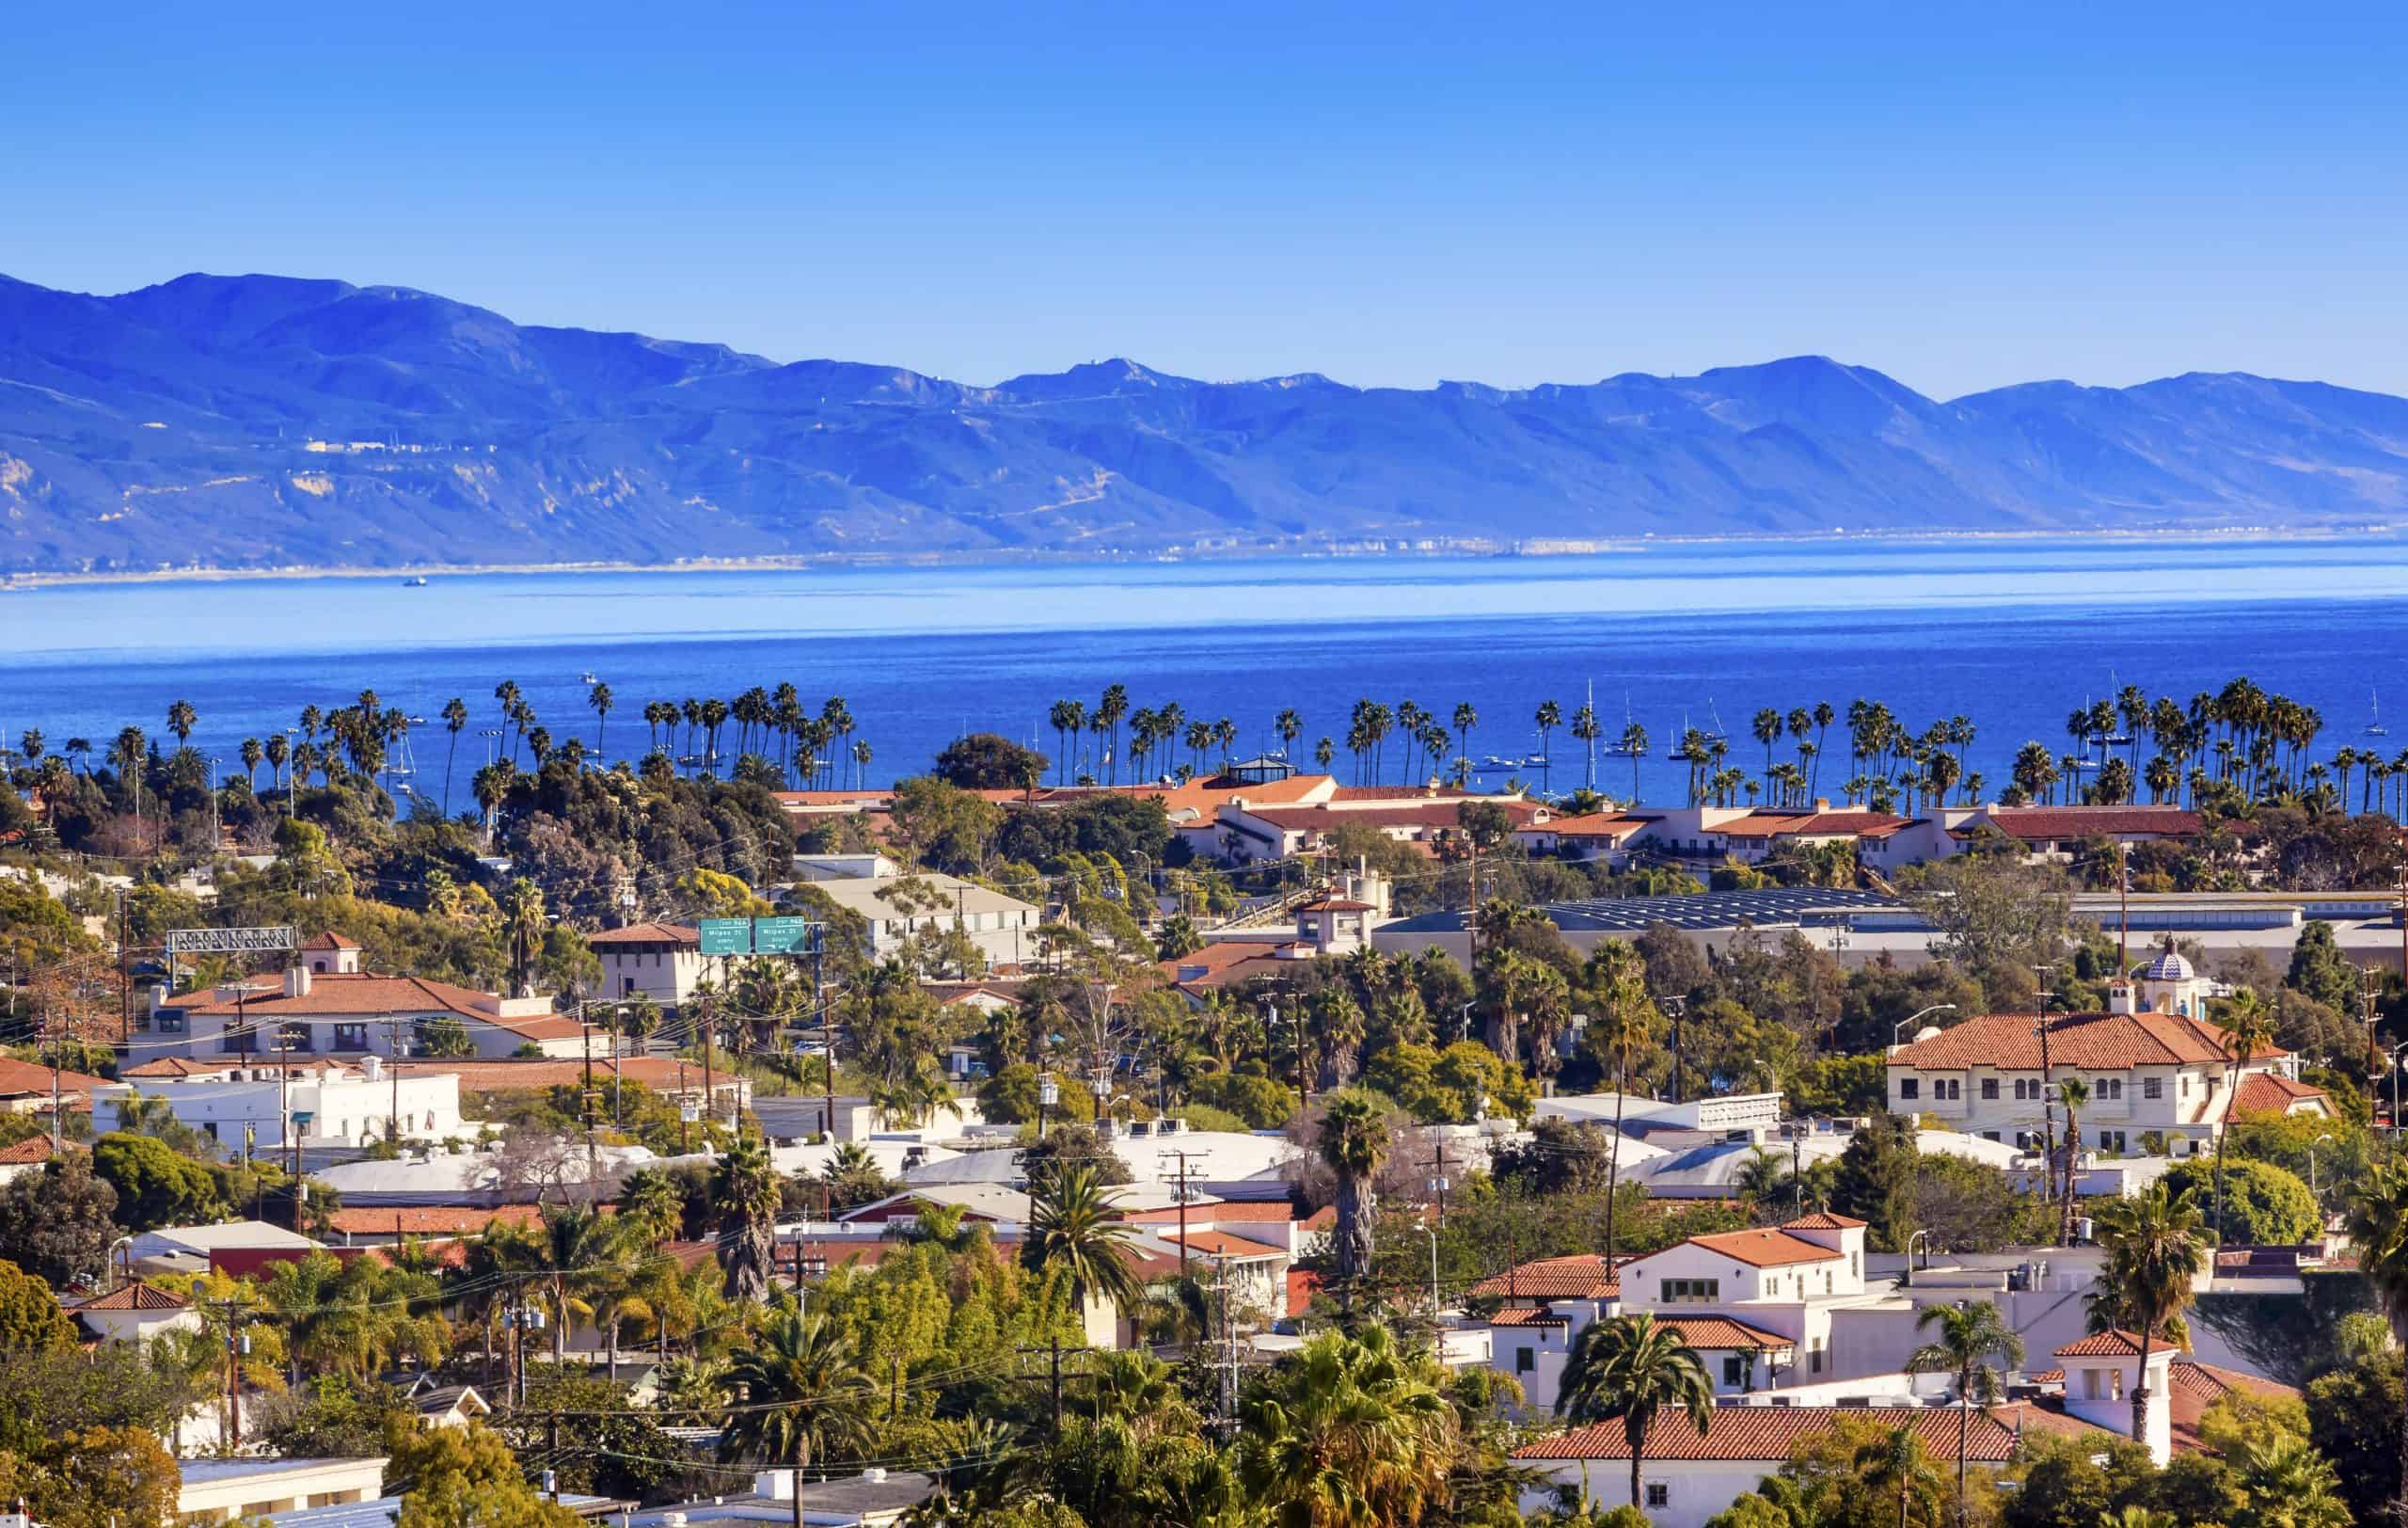
- Income to home price ratio: 47.8 to 1
- Median home list price in July 2024: $2,307,000 (196.6% higher than median home price in California)
- Median annual wage across all occupations: $48,280 (10.6% lower than median wage in California)
- Median size of a listed home in July 2024: 2,258 square feet (25.4% larger than a typical home in California)
- 1-year change in median home list price: +15.6%