24/7 Wall St. Insights
- To pursue a goal of homeownership, many millennials are moving to areas with a strong job market and lower cost of living, and away from big cities like New York or Los Angeles.
- The majority of metro areas that millennials are moving to are in the South, with only 2 of 25 being in the Midwest.
- All 25 cities on our list saw millennial population growths of 6.6% or more.
- Also: Discover the “Next NVIDIA”
Rates of millennial homeownership have been steadily rising over the years. In 2020, 48% of millennials across the United States owned their own homes. As of 2024, that percentage has risen to 52%. However, it has taken this generation time to reach this point. Millennials have lived through the 2007-08 financial crisis, a variety of wars, and, more recently, the coronavirus pandemic. Paired with rising educational costs — the average cost for students pursuing a Bachelor’s degree in over $38,000 a year — the millennial generation hasn’t always had homeownership in its sights. For many people, especially those in middle- or lower-class socioeconomic classes, homeownership still exists as just a dream. (This is the priciest college in every state.)
Millennials are also more likely to live longer with their parents than members of previous generations. According to a Pew Research Center survey, 15% of millennials were living in their parents’ home in 2018, compared to less than 10% of the Silent Generation, baby boomers, and Gen-Xers in comparable eras. Millennials are also far less likely to move than young adults of previous generations. But millennials can now have hope that certain areas around the country are making homeownership more accessible. Millennials are flocking to these cities in droves.
Here, 24/7 Wall St. identified the major cities that millennials are moving to the most using data from the U.S. Census Bureau’s American Community Survey. We ranked all U.S. metro areas with populations of at least 250,000 by the percentage change in residents between the ages of 25 and 39 from 2019 to 2022. Among these places, the share of 25 to 39 year olds increased by anywhere from 6.6% to 14.3% between 2019 and 2022. Supplemental unemployment data is from the Bureau of Labor Statistics.
Mostly absent from this list are large, so-called “superstar” cities that have historically drawn in large numbers of young, college-educated, and upwardly mobile professionals. Many of these cities, like Boston, Los Angeles, New York, and San Francisco, are expensive places to live and have reported a net-decline in their millennial population in recent years. Of the metro areas on this list, all but two are home to fewer than 1 million people. (These 10 cities have become “impossibly unaffordable.”)
Why This Matters

Millennials — generally defined as those born between 1981 and 1996 — are the largest generation in United States history, comprising around 72.7 million people. We’re writing this article to help you better understand how millennials’ decisions are driving key economic and demographic trends, and how that affects your personal wealth. The vast majority of the areas on this list have a lower overall cost of living than the U.S. as whole. According to the latest estimates from the Bureau of Economic Analysis, the average cost of goods and services is at least 5% lower than it is nationwide for some cities on this list. Lower living expenses in these places makes homeownership more affordable for new residents. In 17 of the 25 metro areas on this list, the homeownership rate among those who recently moved there exceeds the comparable national rate of 40.9%, according to one-year ACS estimates.
See the major U.S. cities that millennials are moving to the most:
25. Salisbury, MD-DE

- Increase of 25 to 39 year-old residents (2019 to 2022): +6.6%
- Population growth (2019 to 2022): +5.6%
- Homeownership rate (moved 2021 or later): 56.2%
- Unemployment rate (2022): 4.4%
24. Longview, TX
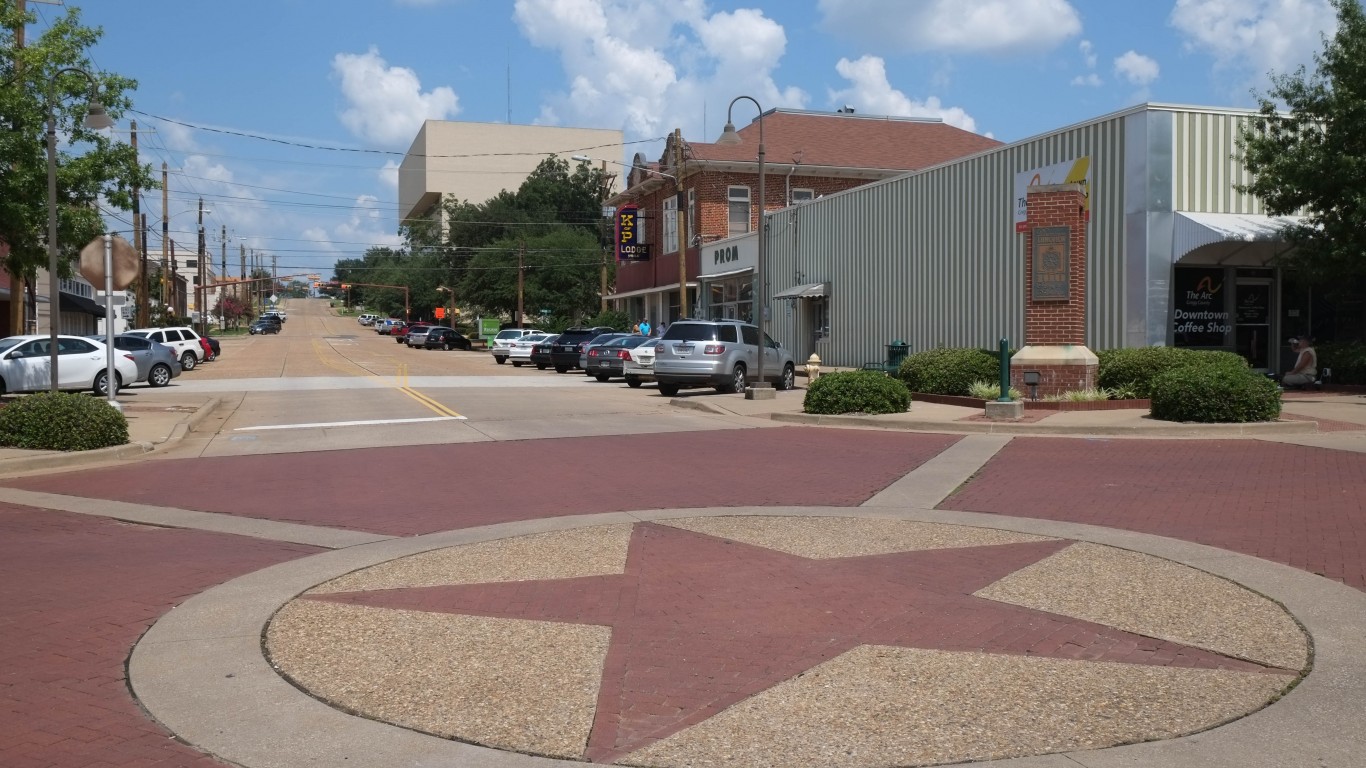
- Increase of 25 to 39 year-old residents (2019 to 2022): +6.6%
- Population growth (2019 to 2022): +1.6%
- Homeownership rate (moved 2021 or later): 45.0%
- Unemployment rate (2022): 4.2%
23. Killeen-Temple, TX

- Increase of 25 to 39 year-old residents (2019 to 2022): +6.7%
- Population growth (2019 to 2022): +7.6%
- Homeownership rate (moved 2021 or later): 35.9%
- Unemployment rate (2022): 4.4%
22. Fort Wayne, IN
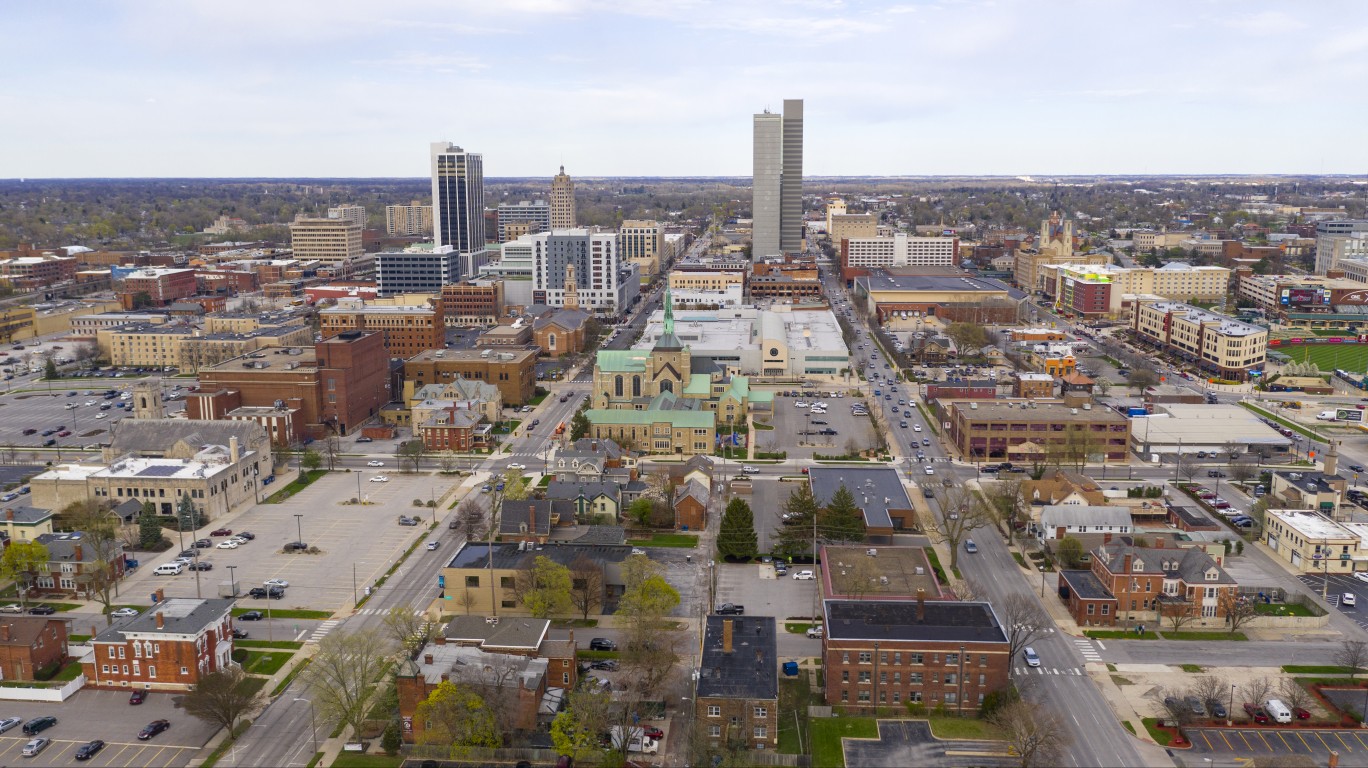
- Increase of 25 to 39 year-old residents (2019 to 2022): +6.7%
- Population growth (2019 to 2022): +3.1%
- Homeownership rate (moved 2021 or later): 45.2%
- Unemployment rate (2022): 2.8%
21. North Port-Sarasota-Bradenton, FL

- Increase of 25 to 39 year-old residents (2019 to 2022): +7.0%
- Population growth (2019 to 2022): +6.5%
- Homeownership rate (moved 2021 or later): 57.0%
- Unemployment rate (2022): 2.9%
20. Knoxville, TN

- Increase of 25 to 39 year-old residents (2019 to 2022): +7.2%
- Population growth (2019 to 2022): +4.3%
- Homeownership rate (moved 2021 or later): 42.9%
- Unemployment rate (2022): 3.1%
19. Kingsport-Bristol, TN-VA

- Increase of 25 to 39 year-old residents (2019 to 2022): +7.4%
- Population growth (2019 to 2022): +0.9%
- Homeownership rate (moved 2021 or later): 48.7%
- Unemployment rate (2022): 3.4%
18. Canton-Massillon, OH

- Increase of 25 to 39 year-old residents (2019 to 2022): +7.6%
- Population growth (2019 to 2022): +0.5%
- Homeownership rate (moved 2021 or later): 43.9%
- Unemployment rate (2022): 4.0%
17. Reno, NV

- Increase of 25 to 39 year-old residents (2019 to 2022): +7.8%
- Population growth (2019 to 2022): +5.5%
- Homeownership rate (moved 2021 or later): 37.1%
- Unemployment rate (2022): 3.5%
16. Portland-South Portland, ME

- Increase of 25 to 39 year-old residents (2019 to 2022): +8.0%
- Population growth (2019 to 2022): +4.3%
- Homeownership rate (moved 2021 or later): 49.4%
- Unemployment rate (2022): 2.5%
15. Montgomery, AL
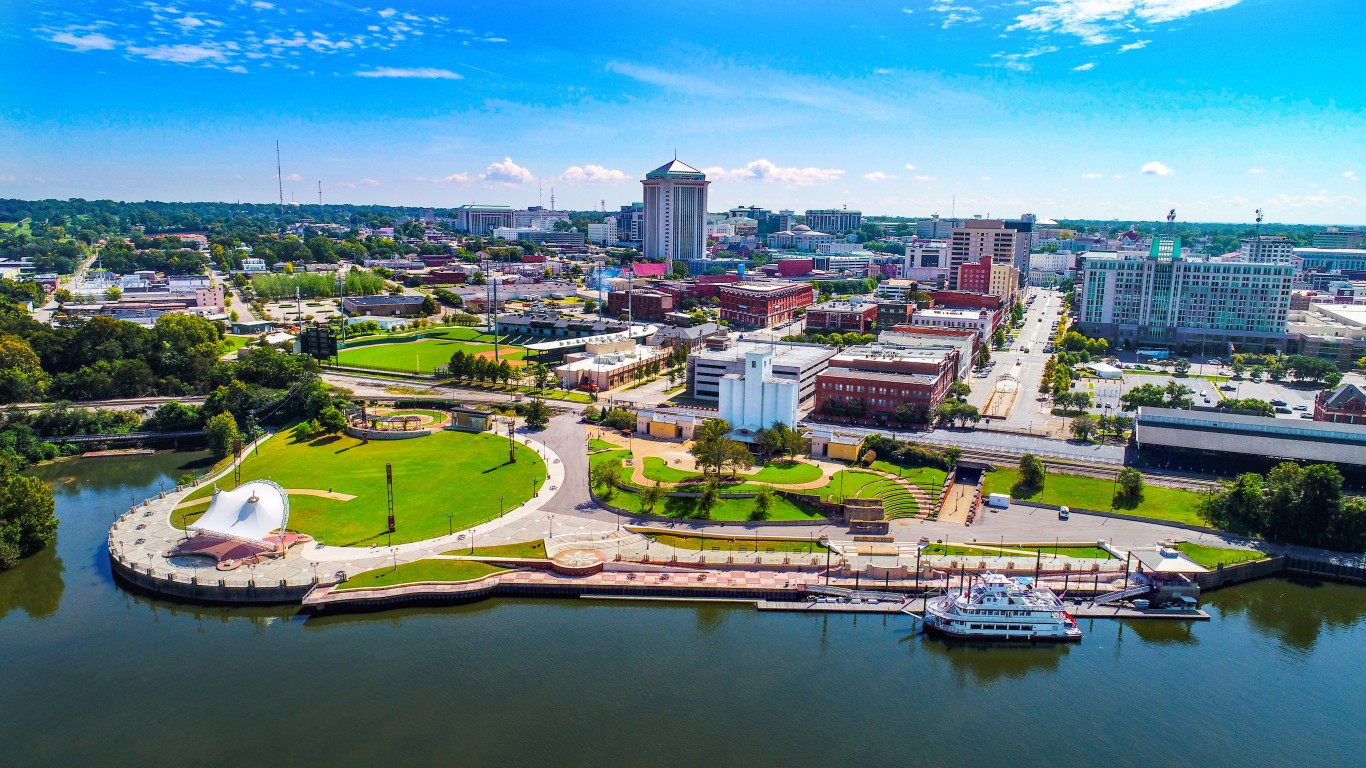
- Increase of 25 to 39 year-old residents (2019 to 2022): +8.4%
- Population growth (2019 to 2022): +4.1%
- Homeownership rate (moved 2021 or later): 40.3%
- Unemployment rate (2022): 2.8%
14. Raleigh-Cary, NC

- Increase of 25 to 39 year-old residents (2019 to 2022): +8.4%
- Population growth (2019 to 2022): +6.7%
- Homeownership rate (moved 2021 or later): 37.4%
- Unemployment rate (2022): 3.1%
13. Austin-Round Rock-Georgetown, TX

- Increase of 25 to 39 year-old residents (2019 to 2022): +8.7%
- Population growth (2019 to 2022): +8.7%
- Homeownership rate (moved 2021 or later): 29.3%
- Unemployment rate (2022): 2.9%
12. Deltona-Daytona Beach-Ormond Beach, FL
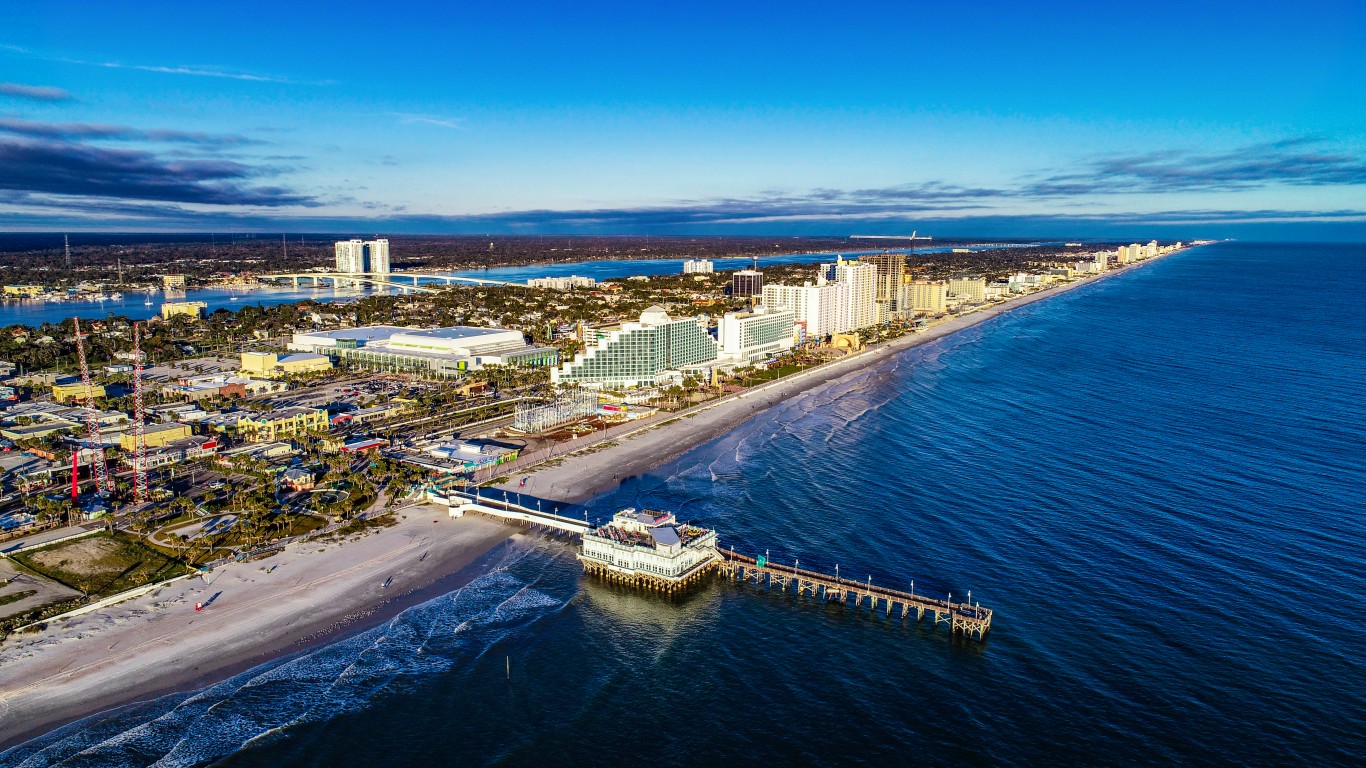
- Increase of 25 to 39 year-old residents (2019 to 2022): +9.2%
- Population growth (2019 to 2022): +5.6%
- Homeownership rate (moved 2021 or later): 57.4%
- Unemployment rate (2022): 3.2%
11. Salem, OR
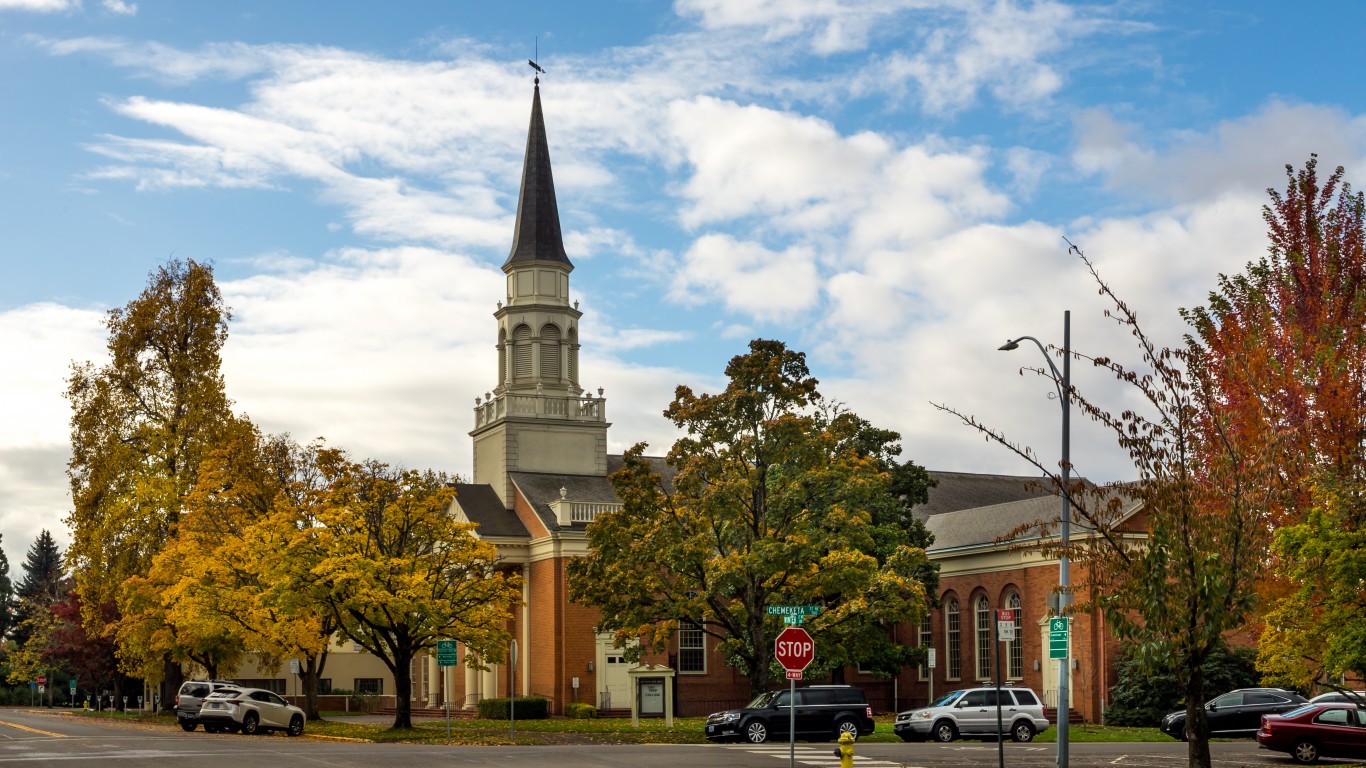
- Increase of 25 to 39 year-old residents (2019 to 2022): +9.3%
- Population growth (2019 to 2022): +0.6%
- Homeownership rate (moved 2021 or later): 49.0%
- Unemployment rate (2022): 4.3%
10. Wilmington, NC

- Increase of 25 to 39 year-old residents (2019 to 2022): +10.4%
- Population growth (2019 to 2022): +1.1%
- Homeownership rate (moved 2021 or later): 41.3%
- Unemployment rate (2022): 3.3%
9. Clarksville, TN-KY
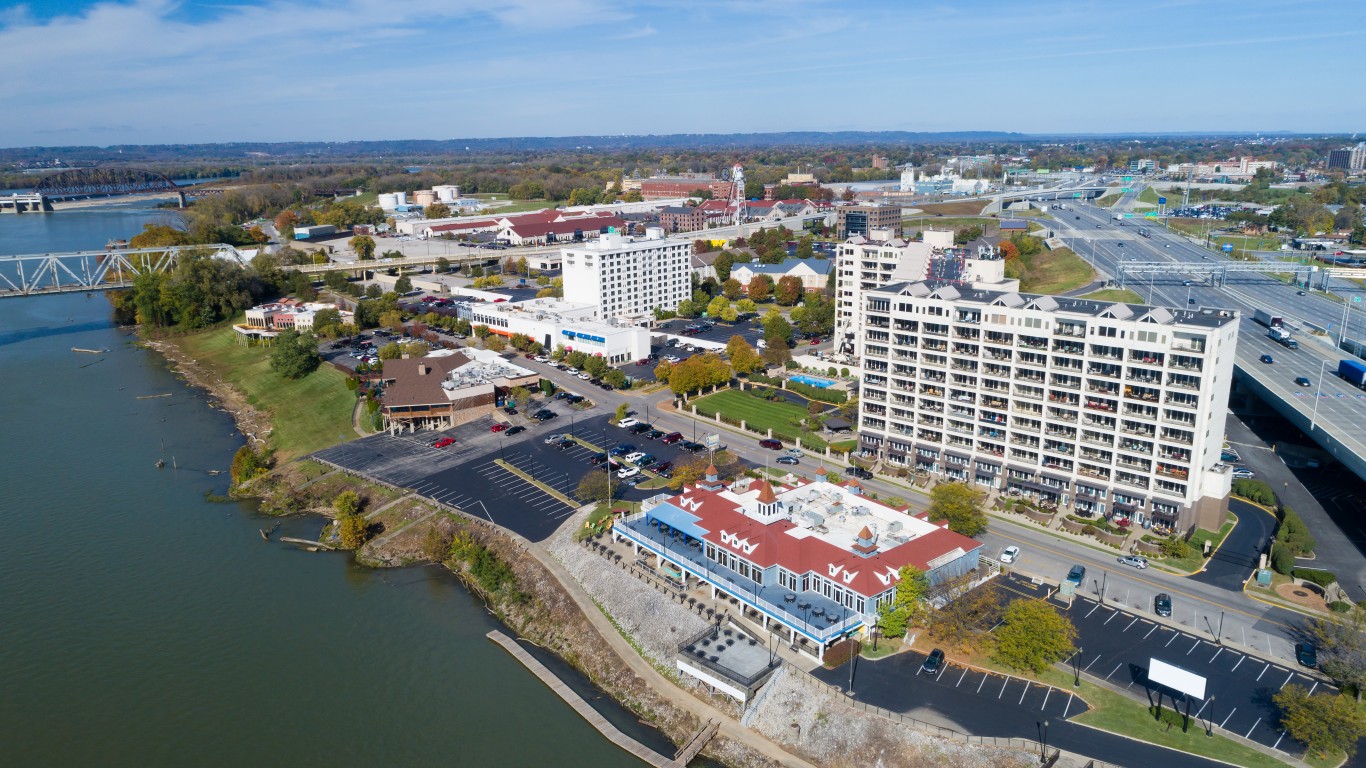
- Increase of 25 to 39 year-old residents (2019 to 2022): +10.6%
- Population growth (2019 to 2022): +8.2%
- Homeownership rate (moved 2021 or later): 38.8%
- Unemployment rate (2022): 4.0%
8. Harrisburg-Carlisle, PA

- Increase of 25 to 39 year-old residents (2019 to 2022): +10.7%
- Population growth (2019 to 2022): +4.4%
- Homeownership rate (moved 2021 or later): 45.4%
- Unemployment rate (2022): 3.7%
7. Manchester-Nashua, NH

- Increase of 25 to 39 year-old residents (2019 to 2022): +10.7%
- Population growth (2019 to 2022): +2.3%
- Homeownership rate (moved 2021 or later): 48.7%
- Unemployment rate (2022): 2.4%
6. Fayetteville-Springdale-Rogers, AR

- Increase of 25 to 39 year-old residents (2019 to 2022): +10.9%
- Population growth (2019 to 2022): +7.6%
- Homeownership rate (moved 2021 or later): 43.2%
- Unemployment rate (2022): 2.4%
5. Greeley, CO

- Increase of 25 to 39 year-old residents (2019 to 2022): +11.5%
- Population growth (2019 to 2022): +7.9%
- Homeownership rate (moved 2021 or later): 59.6%
- Unemployment rate (2022): 3.2%
4. Waco, TX

- Increase of 25 to 39 year-old residents (2019 to 2022): +11.8%
- Population growth (2019 to 2022): +4.4%
- Homeownership rate (moved 2021 or later): 32.8%
- Unemployment rate (2022): 3.6%
3. Lakeland-Winter Haven, FL

- Increase of 25 to 39 year-old residents (2019 to 2022): +12.2%
- Population growth (2019 to 2022): +8.6%
- Homeownership rate (moved 2021 or later): 55.3%
- Unemployment rate (2022): 3.5%
2. Provo-Orem, UT

- Increase of 25 to 39 year-old residents (2019 to 2022): +13.6%
- Population growth (2019 to 2022): +10.0%
- Homeownership rate (moved 2021 or later): 40.5%
- Unemployment rate (2022): 2.1%
1. Spartanburg, SC
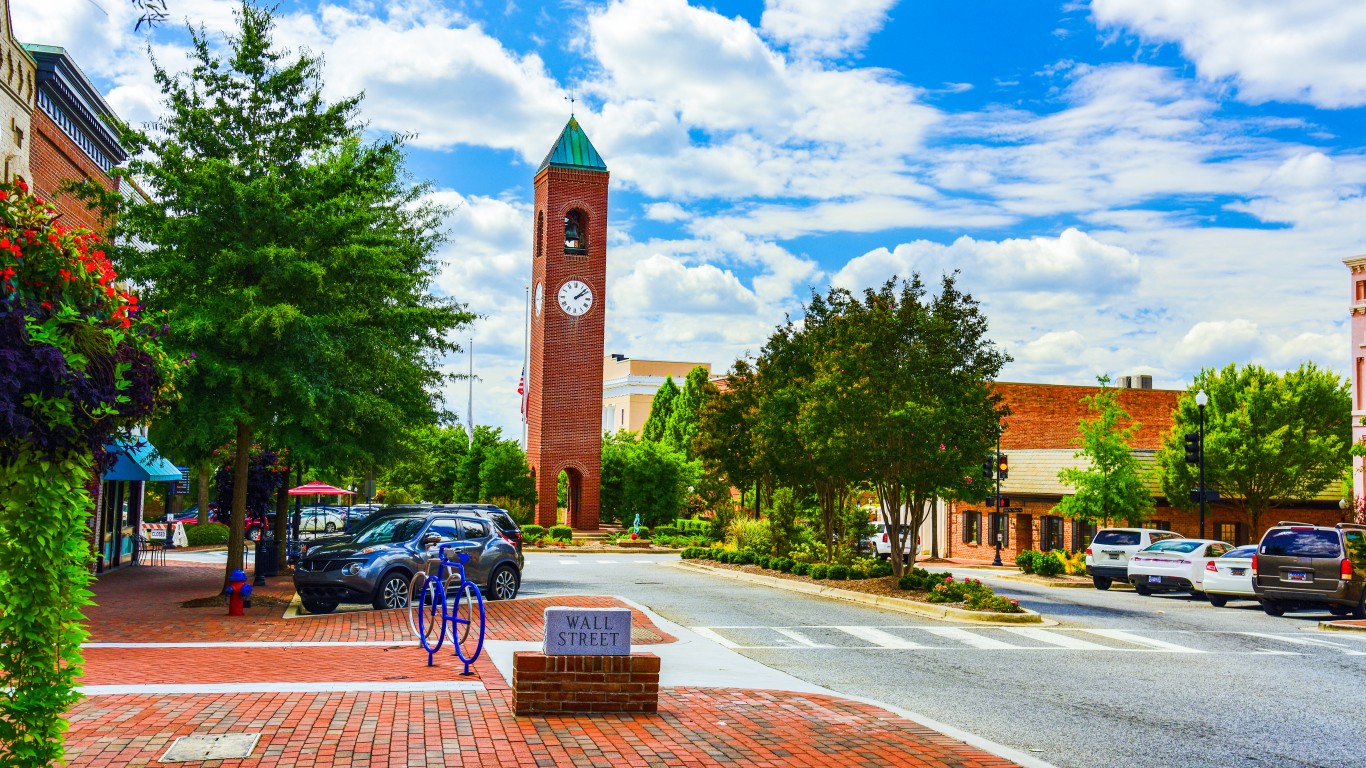
- Increase of 25 to 39 year-old residents (2019 to 2022): +14.3%
- Population growth (2019 to 2022): +8.1%
- Homeownership rate (moved 2021 or later): 52.5%
- Unemployment rate (2022): 3.3%