
24/7 Wall St. Insights
- Rising demand and limited supply have driven U.S. home prices up by nearly 4% so far in 2024.
- In many popular coastal areas, price increases have far exceeded the national average.
- In Maryland, however, not all oceanfront housing markets align with the broader trend.
- Also: Discover the next Nvidia
The United States has nearly 12,400 miles of coastline, more than all but seven other countries globally. Many coastal communities along the Atlantic and Pacific Oceans, as well as the Gulf of Mexico, are among the most popular places to live in the country.
Across the 50 states, there are more than 3,200 counties and county equivalents — and though fewer than 8% of them are located along an ocean, these coastal areas are home to nearly 30% of the U.S. population. Between 1970 and 2020, the population of coastal counties climbed by more than 40 million, according to the National Oceanic and Atmospheric Administration
While demand for real estate on or near an ocean has climbed in recent decades, available waterfront acreage is an inherently limited resource. With rising demand and fixed supply, many coastal communities are reporting skyrocketing home prices — a reflection of the nationwide housing shortage and ongoing affordability crisis.
Though home prices have fallen slightly in recent months, the housing market is still generally more expensive today than it was at the beginning of the year. According to data from Realtor.com, the typical American home was listed for $425,000 in September 2024, a $15,500, or 3.8%, increase from the median list price in January 2024.
In Maryland, one of 23 U.S. states located along an ocean, home prices have climbed even faster than average. Among the 18,213 homes statewide that were on the market in September 2024, the median list price was $427,495, about 9.6% higher than in January. Notably, however, not all housing markets in coastal Maryland have followed this trend.
Of the 24 counties and independent cities in Maryland with available housing market data, 15 border the Atlantic Ocean or an estuary. In some of these places, home prices have climbed by more than 15% in 2024. In other coastal counties and independent cities, price increases have been far more modest — and in one, a typical home is cheaper now than it was at the beginning of the year. (Here is a look at the most affordable housing market in each state.)
It is important to note that median list prices vary between $219,900 to $581,100 in these counties and independent cities as of September 2024, the most recent month of available data. And while some of these housing markets may be only modestly more expensive, or even cheaper, than they were at the beginning of the year, they are not necessarily affordable areas for a broad range of budgets. (Here is a look at the cities where most homes cost less than $125,000.)
These are the coastal counties and independent cities in Maryland where home prices have climbed or fallen the most in 2024. All 15 oceanfront counties and independent cities in the state, with available data from Realtor.com, are ranked on the percent change in median list price from January to September 2024.
Why It Matters
In recent years, limited supply and rising demand have fueled a surge in home prices. This year alone, the list price of a typical American home has climbed by about 3.8%. In many popular coastal areas, the same supply and demand dynamics that led to the ongoing housing affordability crisis have been even more pronounced. In Maryland, however, not all oceanfront housing markets have gotten more expensive in 2024.
15. Kent County
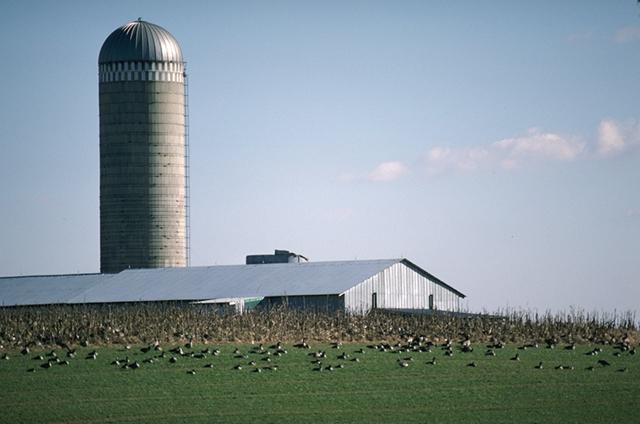
- Change in median home list price in 2024: +27.4% (+$92,425)
- Median home list price in January 2024: $337,475 ($52,525 less than statewide median)
- Median home list price in September 2024: $429,900 ($2,405 more than statewide median)
- Median size of a listed home in September 2024: 2,038 square feet (189 sq. ft. larger than statewide median)
- Number of homes for sale in September 2024: 116 (0.6% of all listed homes in Maryland)
- Population: 19,289
14. Somerset County

- Change in median home list price in 2024: +19.9% (+$46,350)
- Median home list price in January 2024: $232,875 ($157,125 less than statewide median)
- Median home list price in September 2024: $279,225 ($148,270 less than statewide median)
- Median size of a listed home in September 2024: 1,511 square feet (338 sq. ft. smaller than statewide median)
- Number of homes for sale in September 2024: 143 (0.8% of all listed homes in Maryland)
- Population: 24,672
13. Baltimore

- Change in median home list price in 2024: +16.4% (+$30,950)
- Median home list price in January 2024: $188,950 ($201,050 less than statewide median)
- Median home list price in September 2024: $219,900 ($207,595 less than statewide median)
- Median size of a listed home in September 2024: 1,498 square feet (351 sq. ft. smaller than statewide median)
- Number of homes for sale in September 2024: 2,934 (16.1% of all listed homes in Maryland)
- Population: 584,548
12. Dorchester County
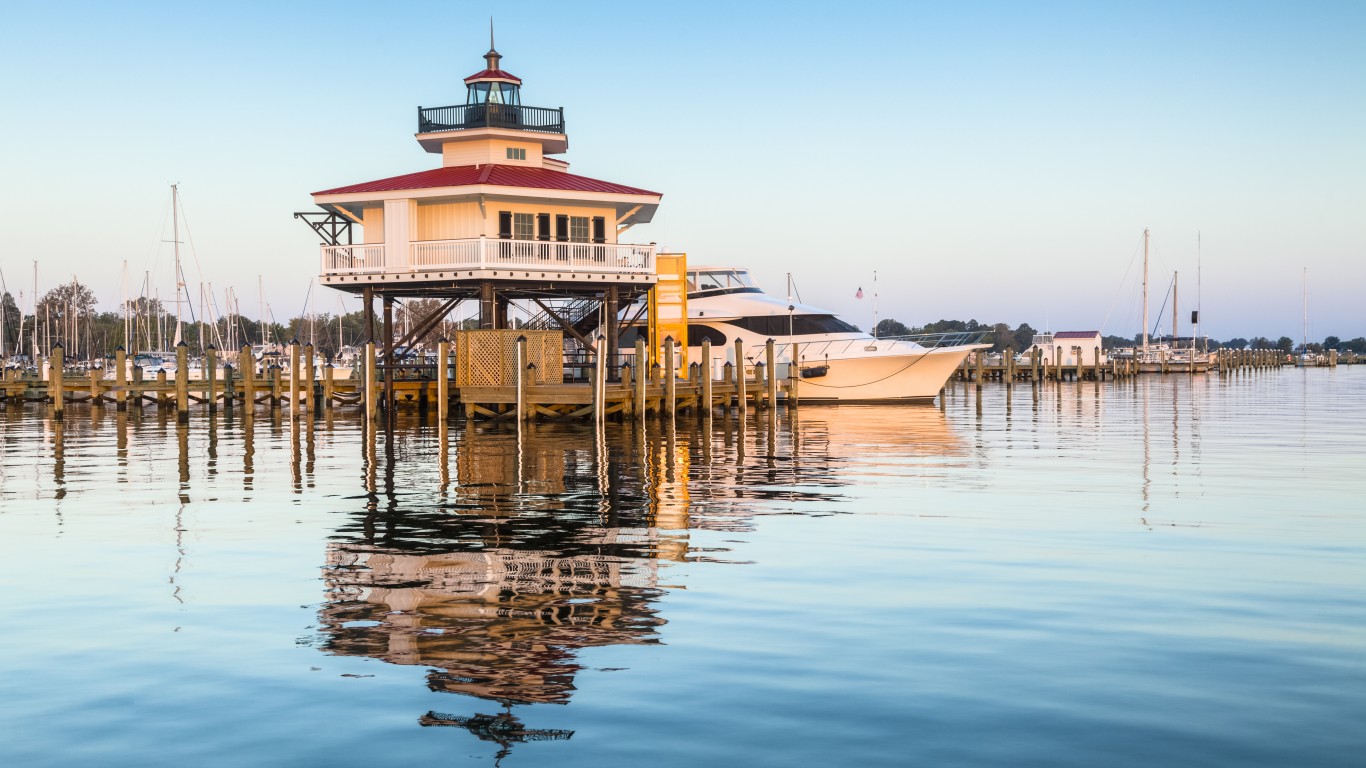
- Change in median home list price in 2024: +9.7% (+$27,245)
- Median home list price in January 2024: $282,250 ($107,750 less than statewide median)
- Median home list price in September 2024: $309,495 ($118,000 less than statewide median)
- Median size of a listed home in September 2024: 1,667 square feet (182 sq. ft. smaller than statewide median)
- Number of homes for sale in September 2024: 213 (1.2% of all listed homes in Maryland)
- Population: 32,557
11. Cecil County

- Change in median home list price in 2024: +8.2% (+$36,992)
- Median home list price in January 2024: $449,998 ($59,998 more than statewide median)
- Median home list price in September 2024: $486,990 ($59,495 more than statewide median)
- Median size of a listed home in September 2024: 2,137 square feet (288 sq. ft. larger than statewide median)
- Number of homes for sale in September 2024: 318 (1.7% of all listed homes in Maryland)
- Population: 103,876
10. Harford County
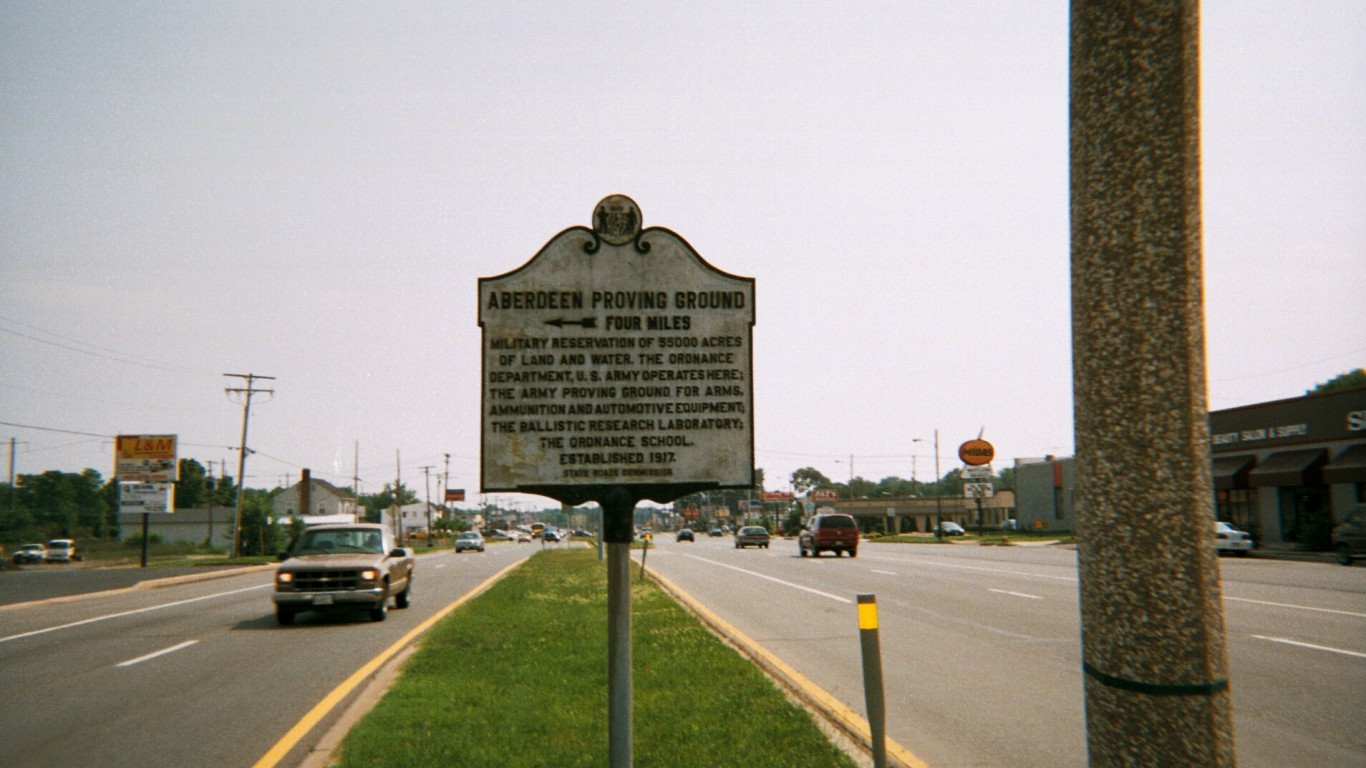
- Change in median home list price in 2024: +7.1% (+$28,752)
- Median home list price in January 2024: $406,243 ($16,243 more than statewide median)
- Median home list price in September 2024: $434,995 ($7,500 more than statewide median)
- Median size of a listed home in September 2024: 2,058 square feet (209 sq. ft. larger than statewide median)
- Number of homes for sale in September 2024: 710 (3.9% of all listed homes in Maryland)
- Population: 261,059
9. Wicomico County

- Change in median home list price in 2024: +5.3% (+$15,225)
- Median home list price in January 2024: $284,725 ($105,275 less than statewide median)
- Median home list price in September 2024: $299,950 ($127,545 less than statewide median)
- Median size of a listed home in September 2024: 1,662 square feet (187 sq. ft. smaller than statewide median)
- Number of homes for sale in September 2024: 332 (1.8% of all listed homes in Maryland)
- Population: 103,815
8. Anne Arundel County
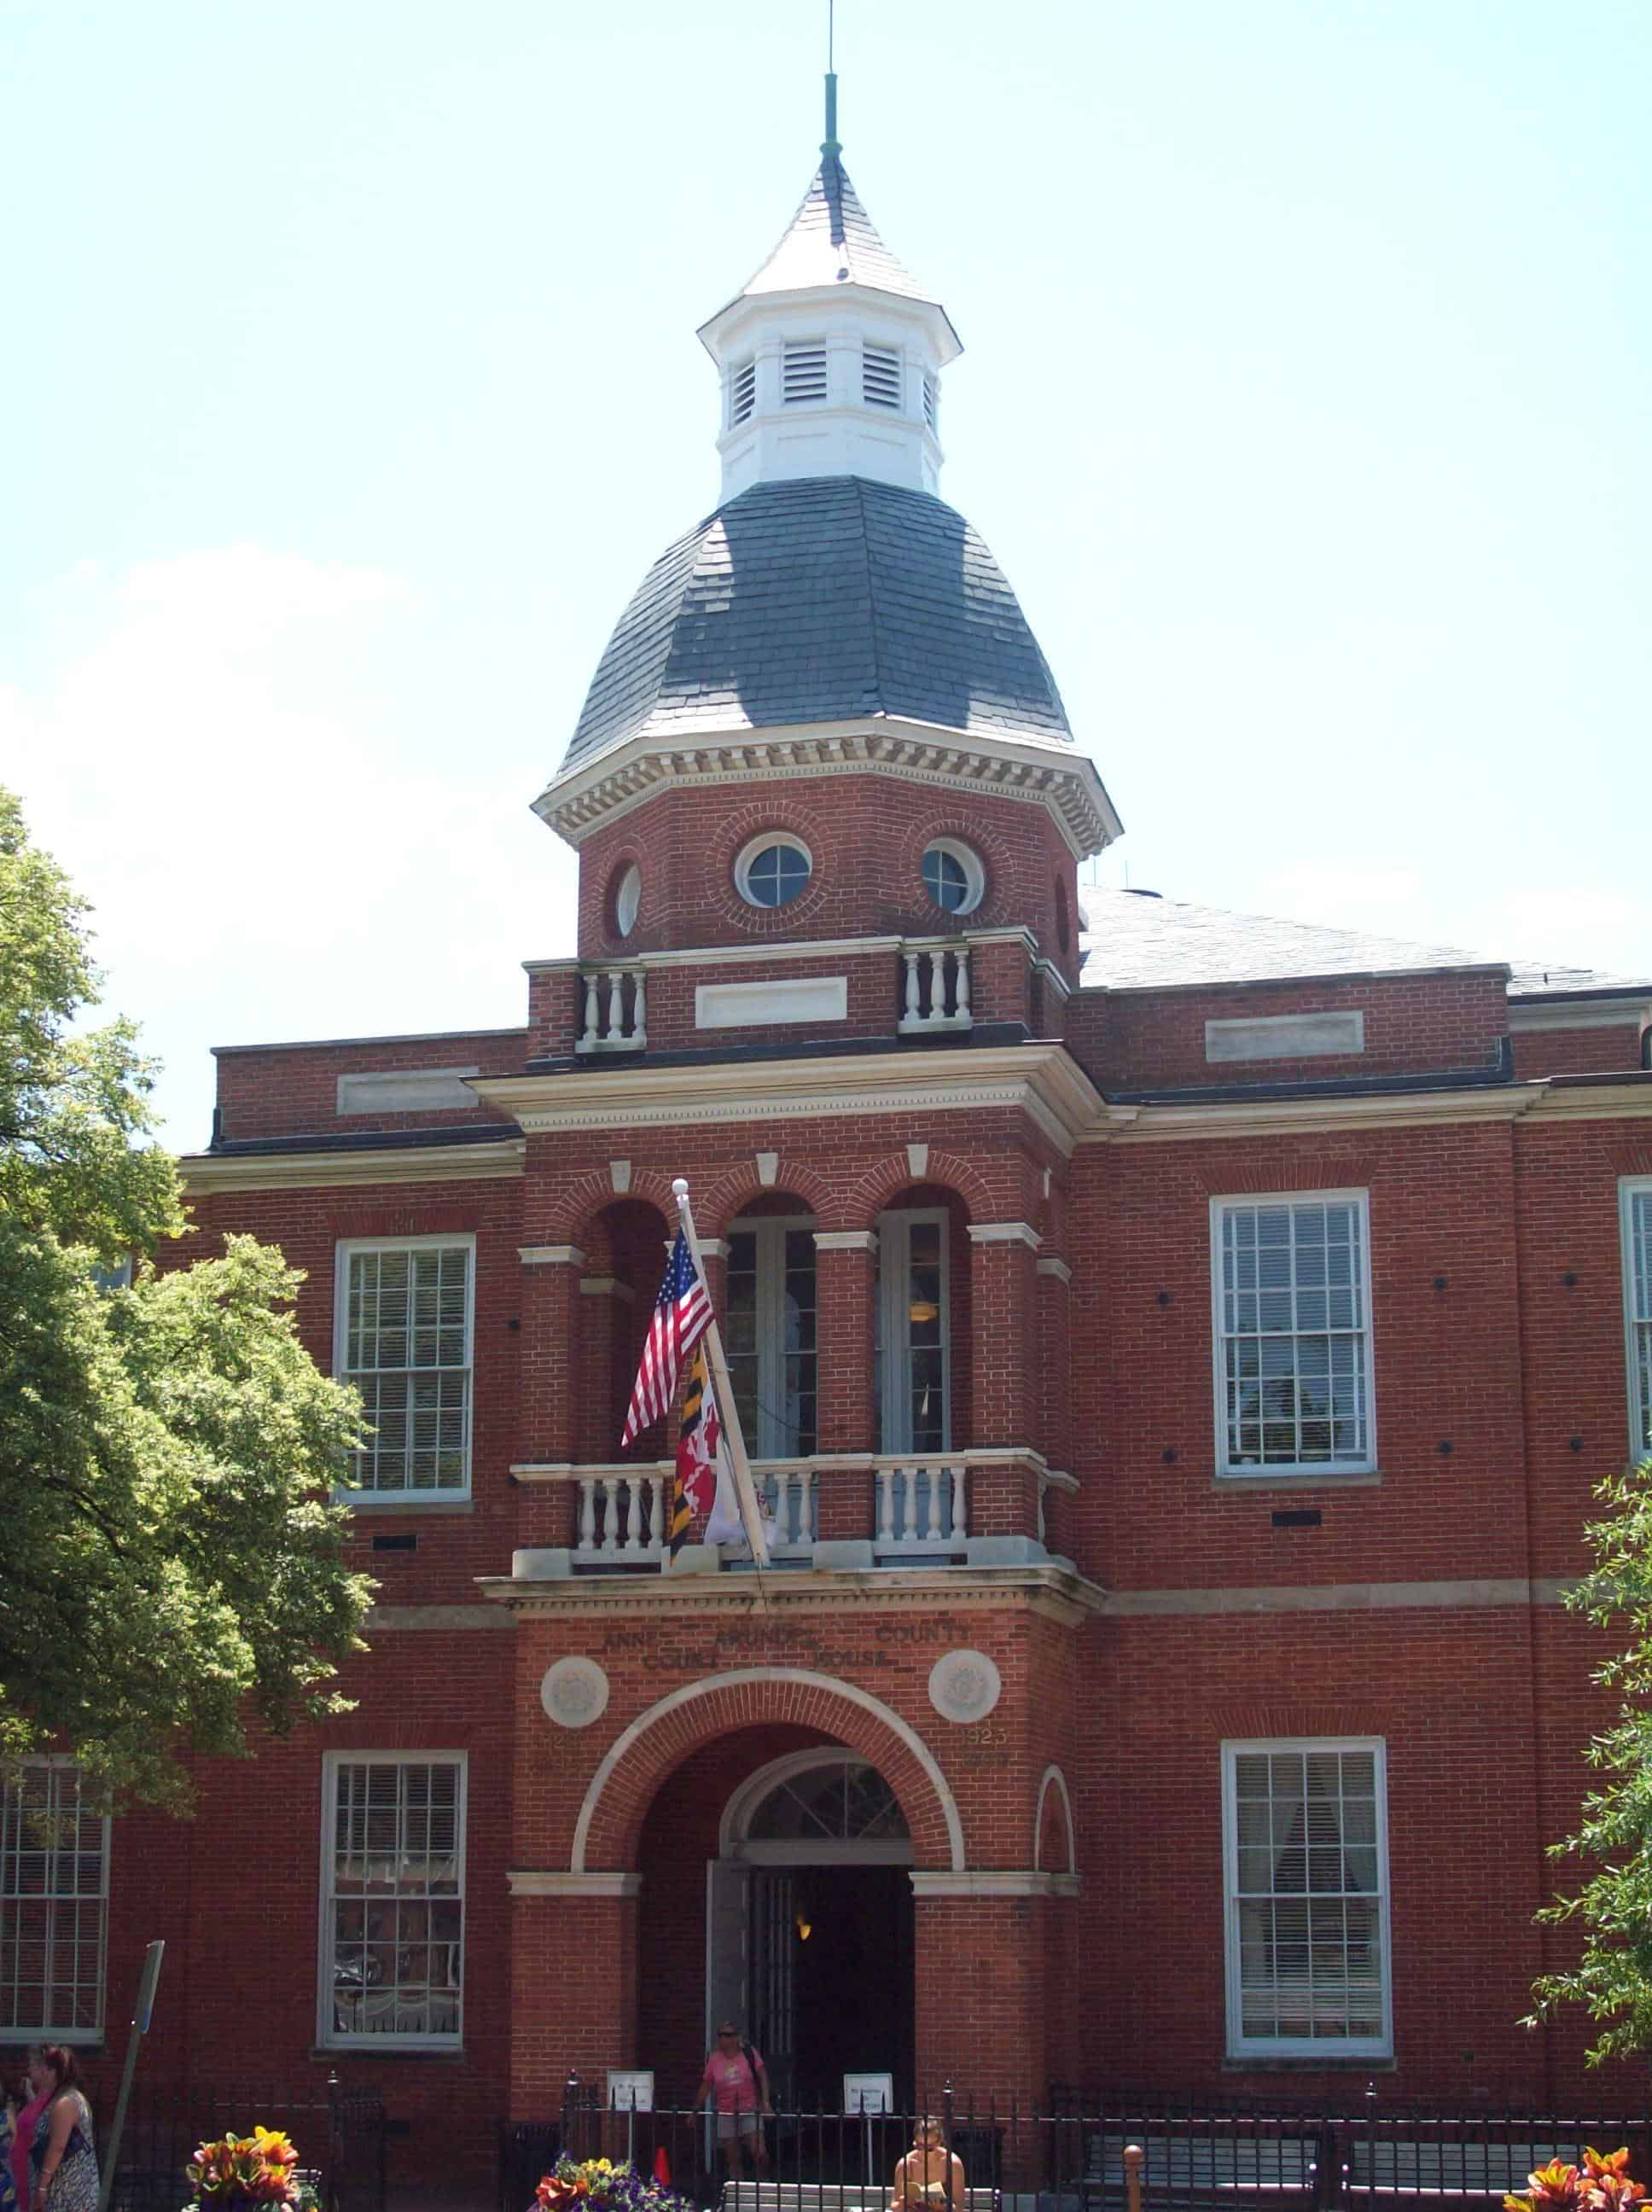
- Change in median home list price in 2024: +3.7% (+$19,850)
- Median home list price in January 2024: $529,575 ($139,575 more than statewide median)
- Median home list price in September 2024: $549,425 ($121,930 more than statewide median)
- Median size of a listed home in September 2024: 2,039 square feet (190 sq. ft. larger than statewide median)
- Number of homes for sale in September 2024: 1,477 (8.1% of all listed homes in Maryland)
- Population: 588,109
7. St. Mary’s County
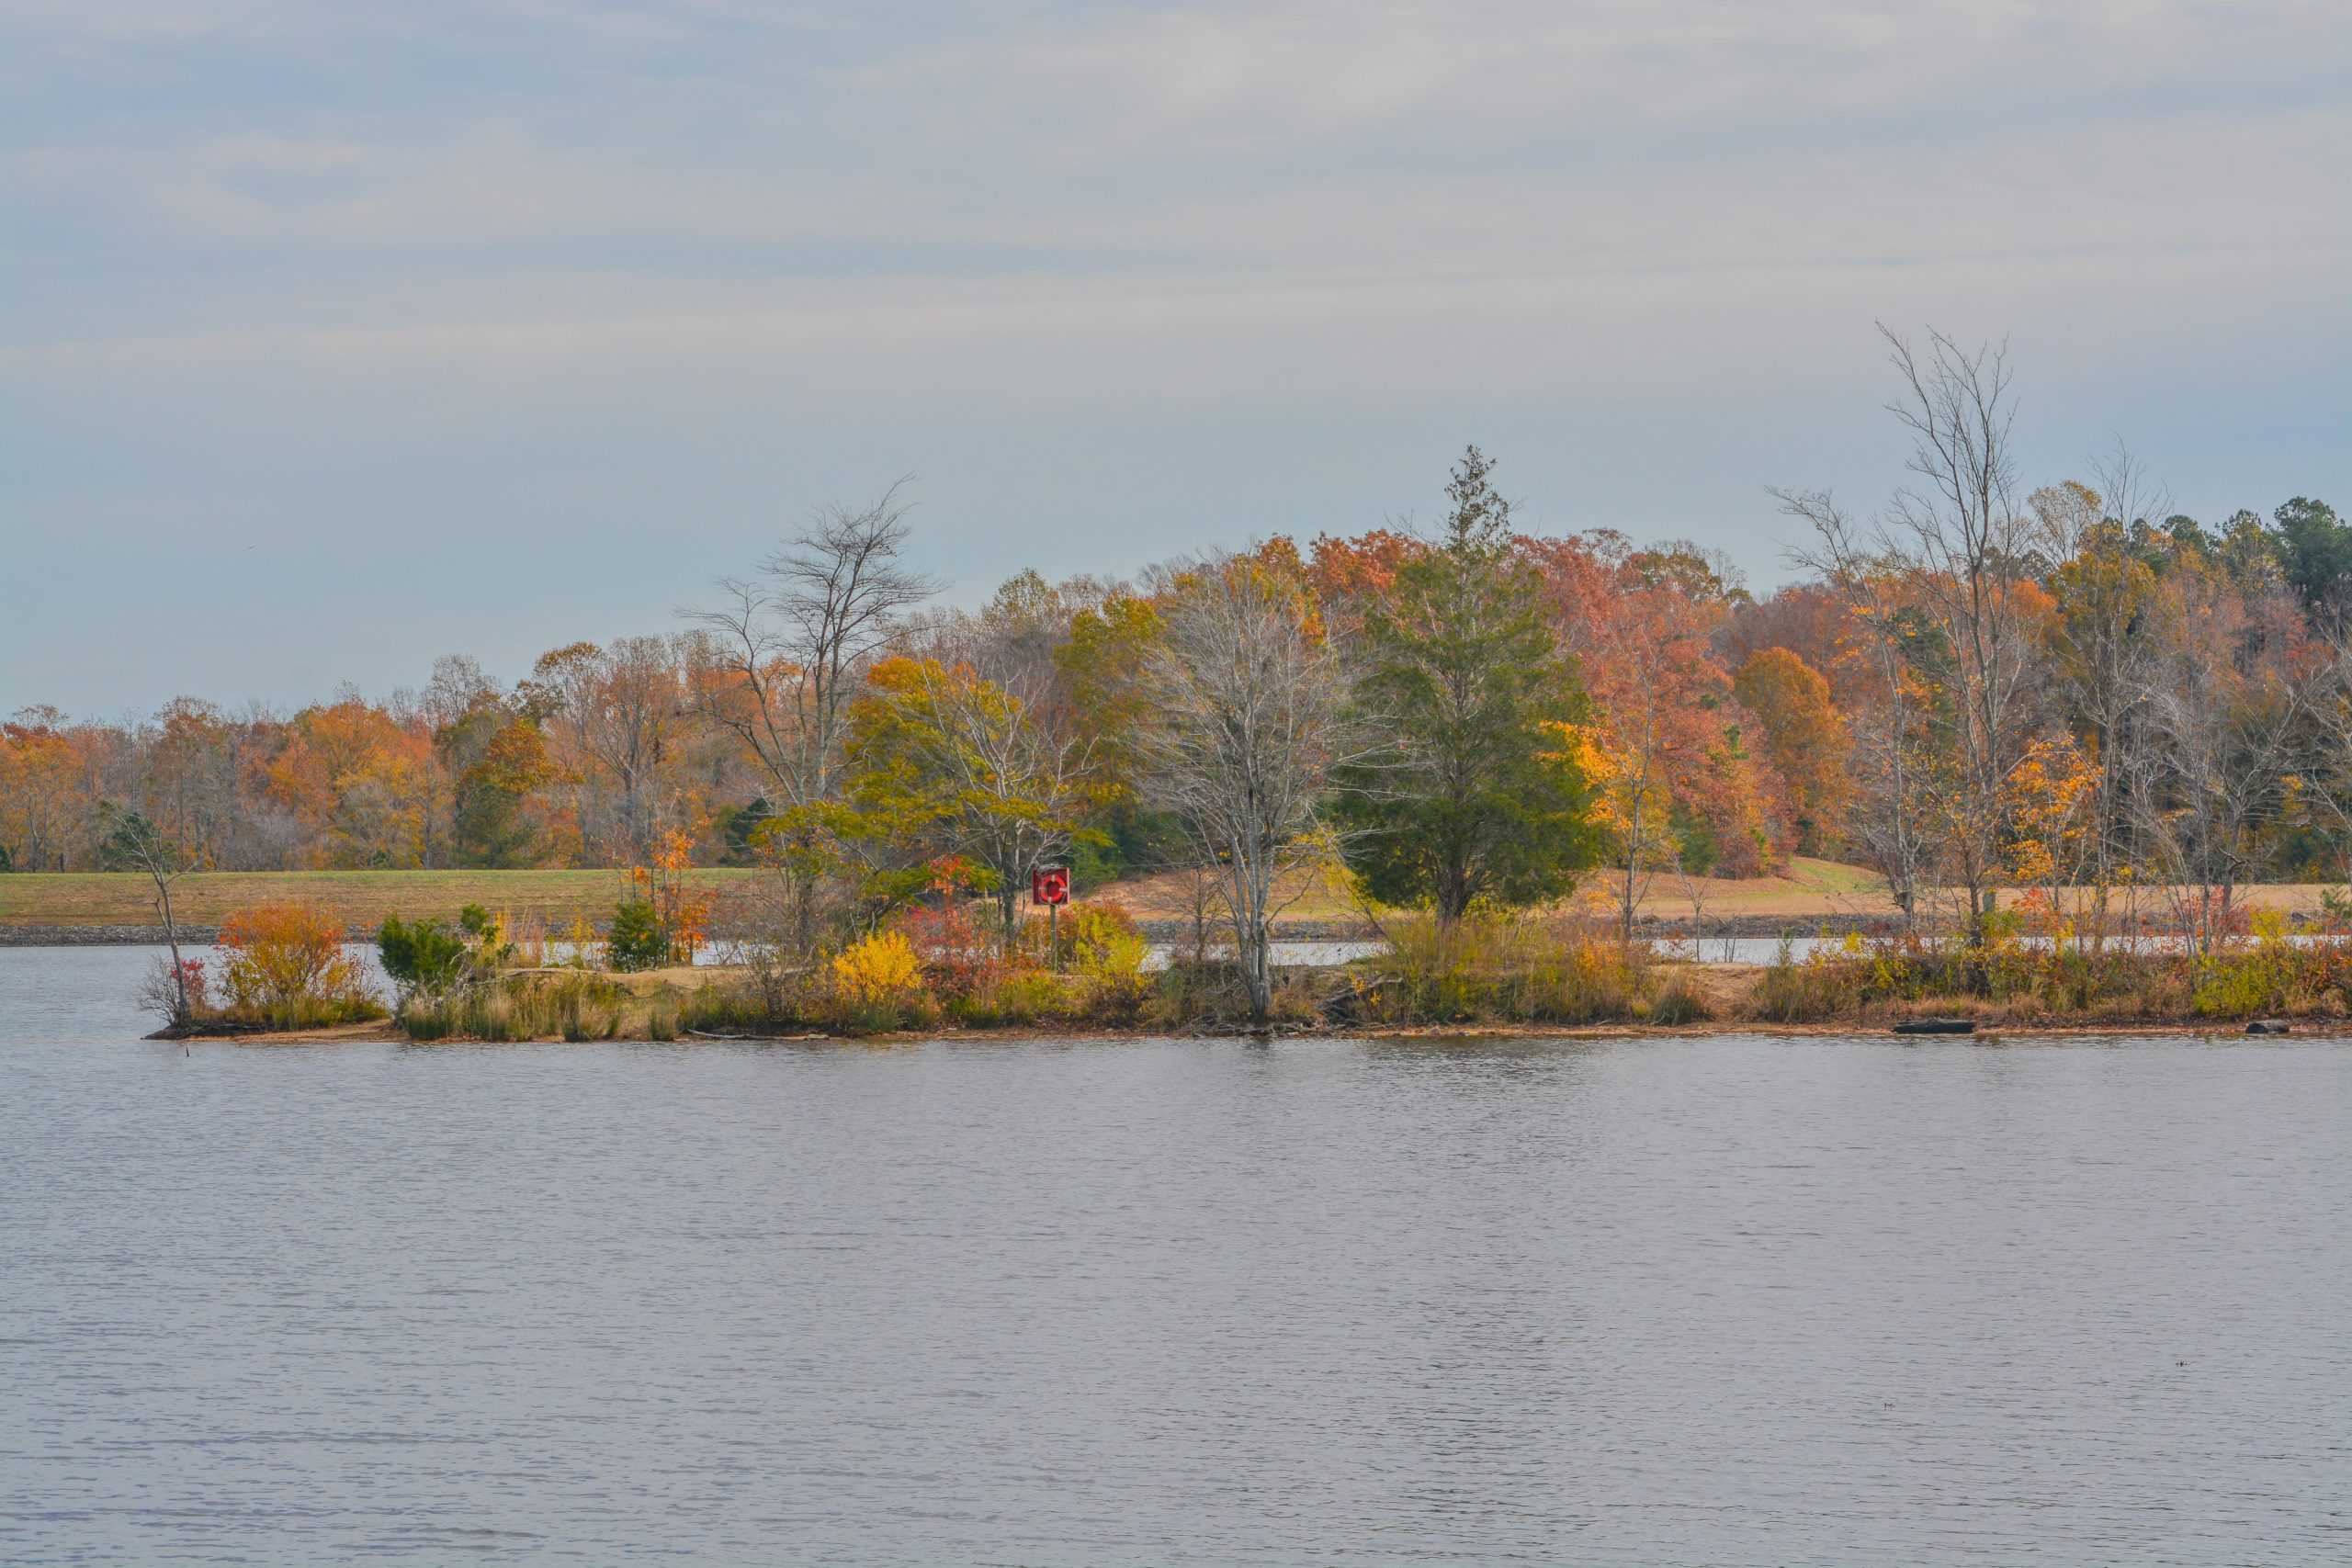
- Change in median home list price in 2024: +3.0% (+$14,050)
- Median home list price in January 2024: $475,400 ($85,400 more than statewide median)
- Median home list price in September 2024: $489,450 ($61,955 more than statewide median)
- Median size of a listed home in September 2024: 2,276 square feet (427 sq. ft. larger than statewide median)
- Number of homes for sale in September 2024: 351 (1.9% of all listed homes in Maryland)
- Population: 113,814
6. Calvert County

- Change in median home list price in 2024: +2.7% (+$14,263)
- Median home list price in January 2024: $523,175 ($133,175 more than statewide median)
- Median home list price in September 2024: $537,438 ($109,943 more than statewide median)
- Median size of a listed home in September 2024: 2,353 square feet (504 sq. ft. larger than statewide median)
- Number of homes for sale in September 2024: 305 (1.7% of all listed homes in Maryland)
- Population: 93,244
5. Baltimore County

- Change in median home list price in 2024: +2.0% (+$7,650)
- Median home list price in January 2024: $384,850 ($5,150 less than statewide median)
- Median home list price in September 2024: $392,500 ($34,995 less than statewide median)
- Median size of a listed home in September 2024: 1,851 square feet (2 sq. ft. larger than statewide median)
- Number of homes for sale in September 2024: 2,029 (11.1% of all listed homes in Maryland)
- Population: 850,737
4. Worcester County
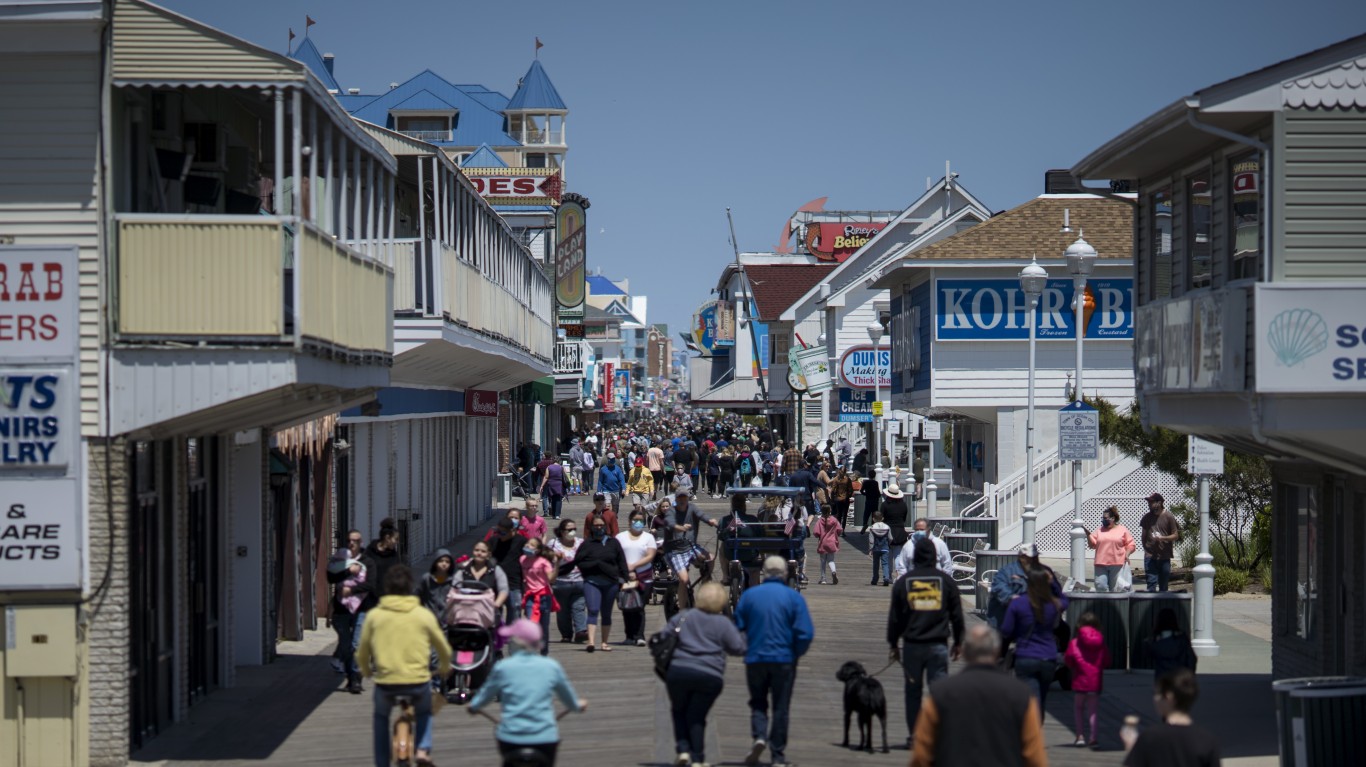
- Change in median home list price in 2024: +0.8% (+$3,775)
- Median home list price in January 2024: $449,950 ($59,950 more than statewide median)
- Median home list price in September 2024: $453,725 ($26,230 more than statewide median)
- Median size of a listed home in September 2024: 1,276 square feet (573 sq. ft. smaller than statewide median)
- Number of homes for sale in September 2024: 812 (4.5% of all listed homes in Maryland)
- Population: 52,827
3. Queen Anne’s County
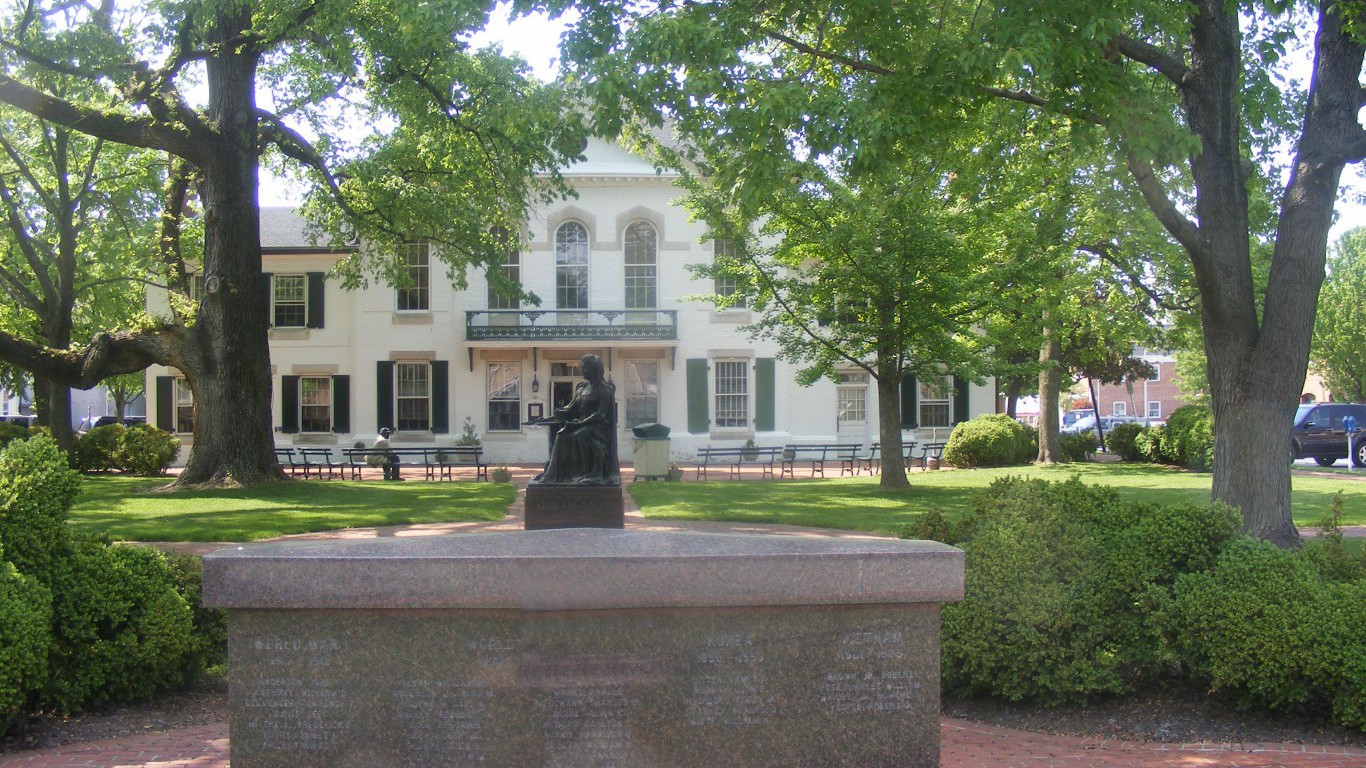
- Change in median home list price in 2024: +0.6% (+$3,605)
- Median home list price in January 2024: $577,495 ($187,495 more than statewide median)
- Median home list price in September 2024: $581,100 ($153,605 more than statewide median)
- Median size of a listed home in September 2024: 2,275 square feet (426 sq. ft. larger than statewide median)
- Number of homes for sale in September 2024: 333 (1.8% of all listed homes in Maryland)
- Population: 50,316
2. Charles County
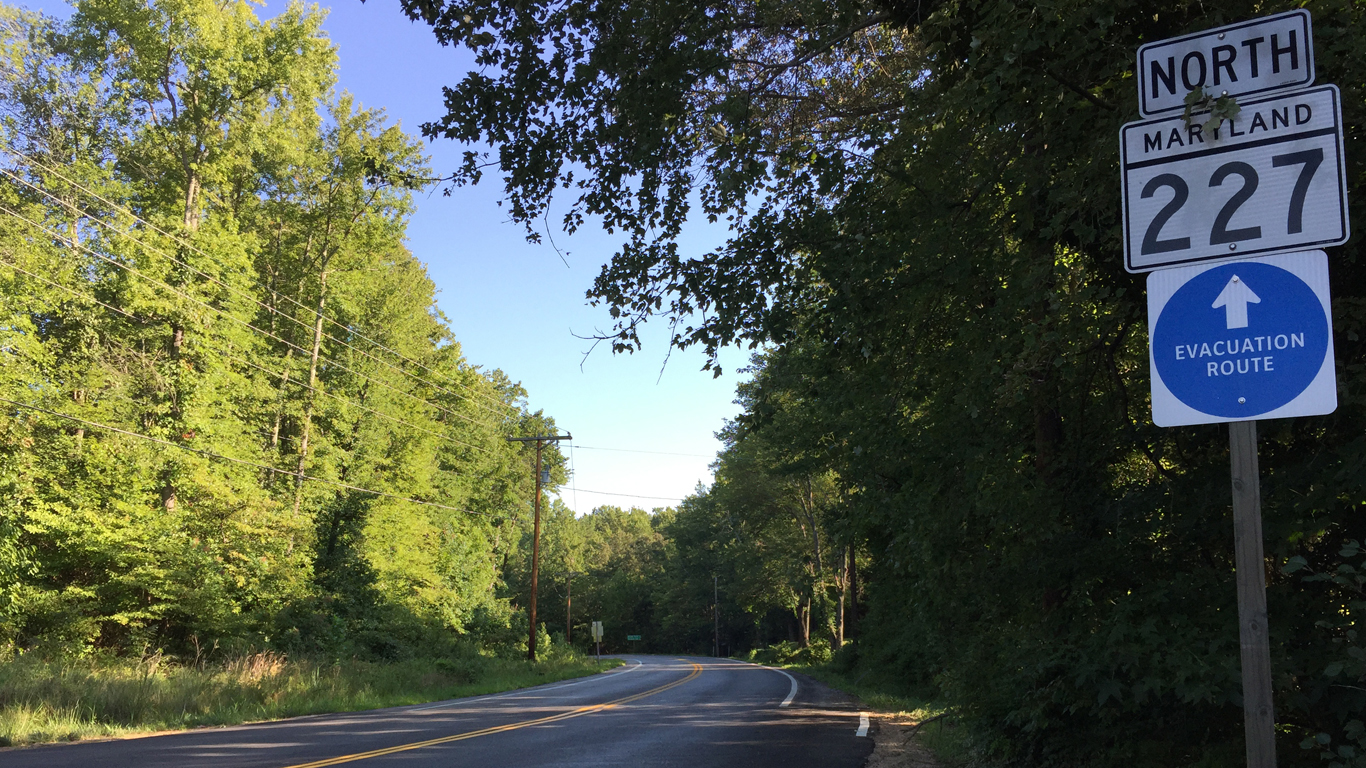
- Change in median home list price in 2024: +0.0% (+$05)
- Median home list price in January 2024: $474,995 ($84,995 more than statewide median)
- Median home list price in September 2024: $475,000 ($47,505 more than statewide median)
- Median size of a listed home in September 2024: 2,232 square feet (383 sq. ft. larger than statewide median)
- Number of homes for sale in September 2024: 643 (3.5% of all listed homes in Maryland)
- Population: 167,035
1. Talbot County
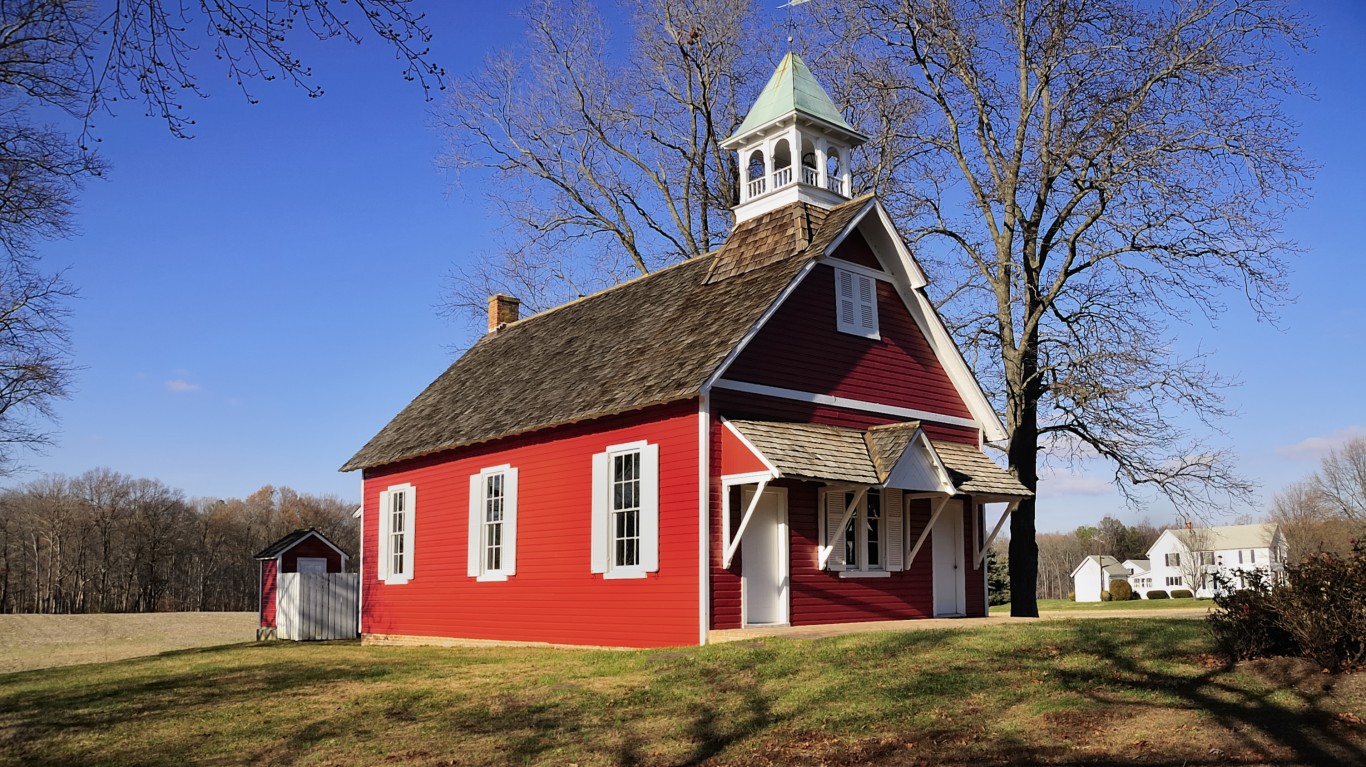
- Change in median home list price in 2024: -21.9% (-$156,975)
- Median home list price in January 2024: $717,225 ($327,225 more than statewide median)
- Median home list price in September 2024: $560,250 ($132,755 more than statewide median)
- Median size of a listed home in September 2024: 2,116 square feet (267 sq. ft. larger than statewide median)
- Number of homes for sale in September 2024: 250 (1.4% of all listed homes in Maryland)
- Population: 37,663
Are You Ahead, or Behind on Retirement?
If you’re one of the over 4 Million Americans set to retire this year, you may want to pay attention. Many people have worked their whole lives preparing to retire without ever knowing the answer to the most important question: am I ahead, or behind on my goals?
Don’t make the same mistake. It’s an easy question to answer. A quick conversation with a financial advisor can help you unpack your savings, spending, and goals for your money. With Zoe Financial’s free matching tool, you can connect with trusted financial advisors in minutes.
Why wait? Click here to get started today!
Thank you for reading! Have some feedback for us?
Contact the 24/7 Wall St. editorial team.
