
There is no set definition for the middle class, but one thing everybody seems to agree on is that America’s middle class has been shrinking for the past 50 years or so. The share of adults who live in middle-class households fell from 61% in 1971 to 50% in 2021, according to the Pew Research Center. Despite this, middle class Americans remain the biggest income group — by the number of people that is, not aggregate income earned.
In fact, even though the upper income group is far smaller, with 21% of adults, the aggregate income earned by the upper income group is 50% to the middle class’s 42%. And of course, the aggregate income of the middle class has shrunk from 62% in 1970, even as the upper income group’s aggregate income rose from 29% to 50%. So where do we see the middle class shrinking the most?
To determine the cities where the middle class is shrinking, 24/7 Wall St. reviewed five-year data on family income from the U.S. Census Bureau’s American Community Survey. Cities were ranked based on the percentage-point change in the share of family households residing in middle-income census tracts from 2012 to 2022. Middle-income census tracts were defined as census tracts in which the median family income is within 25% of the median family income for the city as a whole. Only census tracts that spatially overlap with city boundaries by at least 50% were considered. Census tract and place boundaries are from the U.S. Census Bureau. Only cities with at least 150,000 residents were considered in our analysis.
Most of the cities on the list, where the middle class shrank the most in the past decade, are not very large cities, with between 150,000 to 250,000 residents. The median family income ranges among the cities on the list from $52,443 in Jackson, Mississippi to $116,103 in Portland, Oregon. (Also see: The City With the Poorest Middle Class in Every State.)
The cities span the country — six are in California, five are in Florida, and four in Texas — but the city where the middle class shrank the most is Jersey City, New Jersey. Interestingly, while some might assume that in places where the middle class is shrinking the lower-income class would be increasing, this is not always the case. In many of the places on the list, the share of families in the upper-income class rose during that time, sometimes this happened even as the share of families in the lower-income classes fell, and sometimes when it rose.
40. New Orleans, Louisiana

- Change in share of families in middle-income tracts, 2012 to 2022: -2.7 ppts.
- Change in share of families in upper-income tracts, 2012 to 2022: +8.0 ppts.
- Change in share of families in lower-income tracts, 2012 to 2022: -5.3 ppts.
- Median family income, 2022: $73,549
- Total population, 2022: 380,408
39. Pembroke Pines, Florida
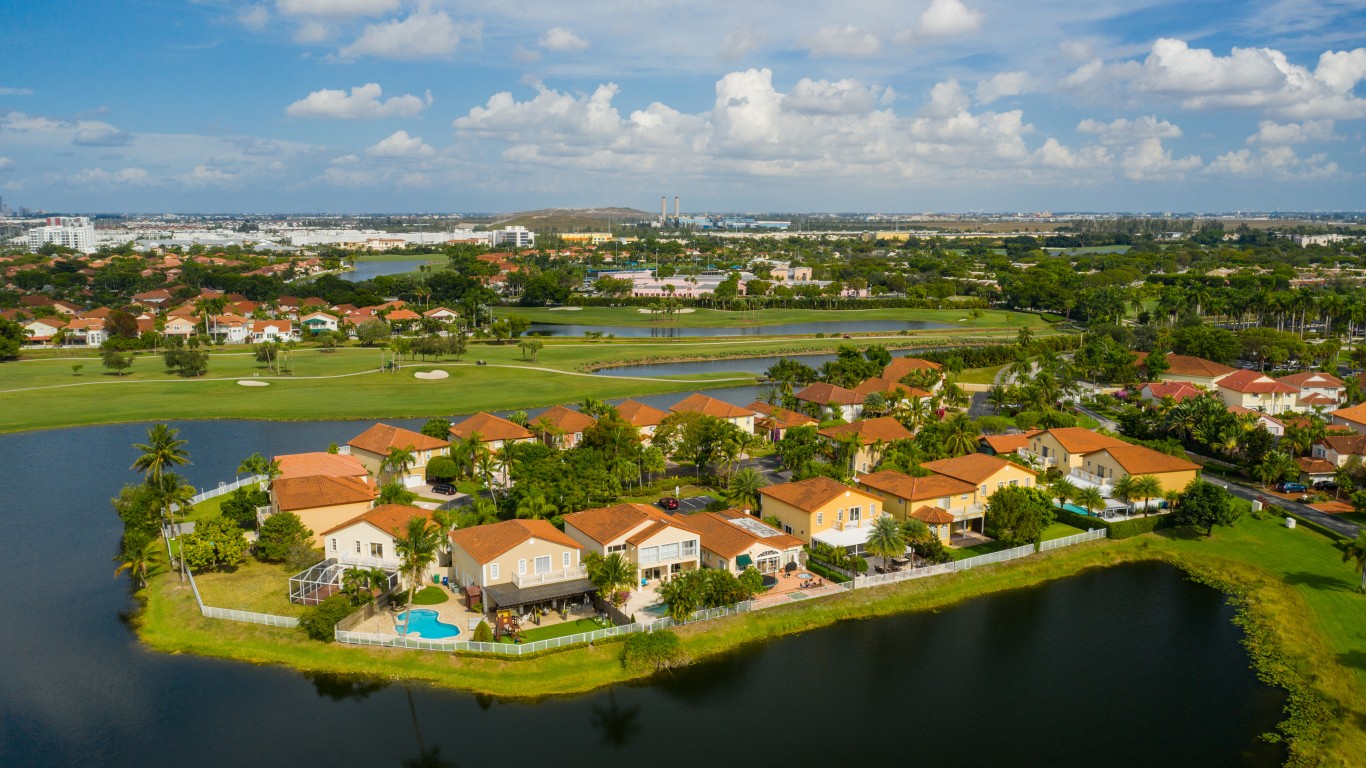
- Change in share of families in middle-income tracts, 2012 to 2022: -2.8 ppts.
- Change in share of families in upper-income tracts, 2012 to 2022: -1.9 ppts.
- Change in share of families in lower-income tracts, 2012 to 2022: +4.6 ppts.
- Median family income, 2022: $94,525
- Total population, 2022: 170,472
38. Des Moines, Iowa

- Change in share of families in middle-income tracts, 2012 to 2022: -2.9 ppts.
- Change in share of families in upper-income tracts, 2012 to 2022: -1.8 ppts.
- Change in share of families in lower-income tracts, 2012 to 2022: +4.7 ppts.
- Median family income, 2022: $76,602
- Total population, 2022: 213,164
37. Portland, Oregon
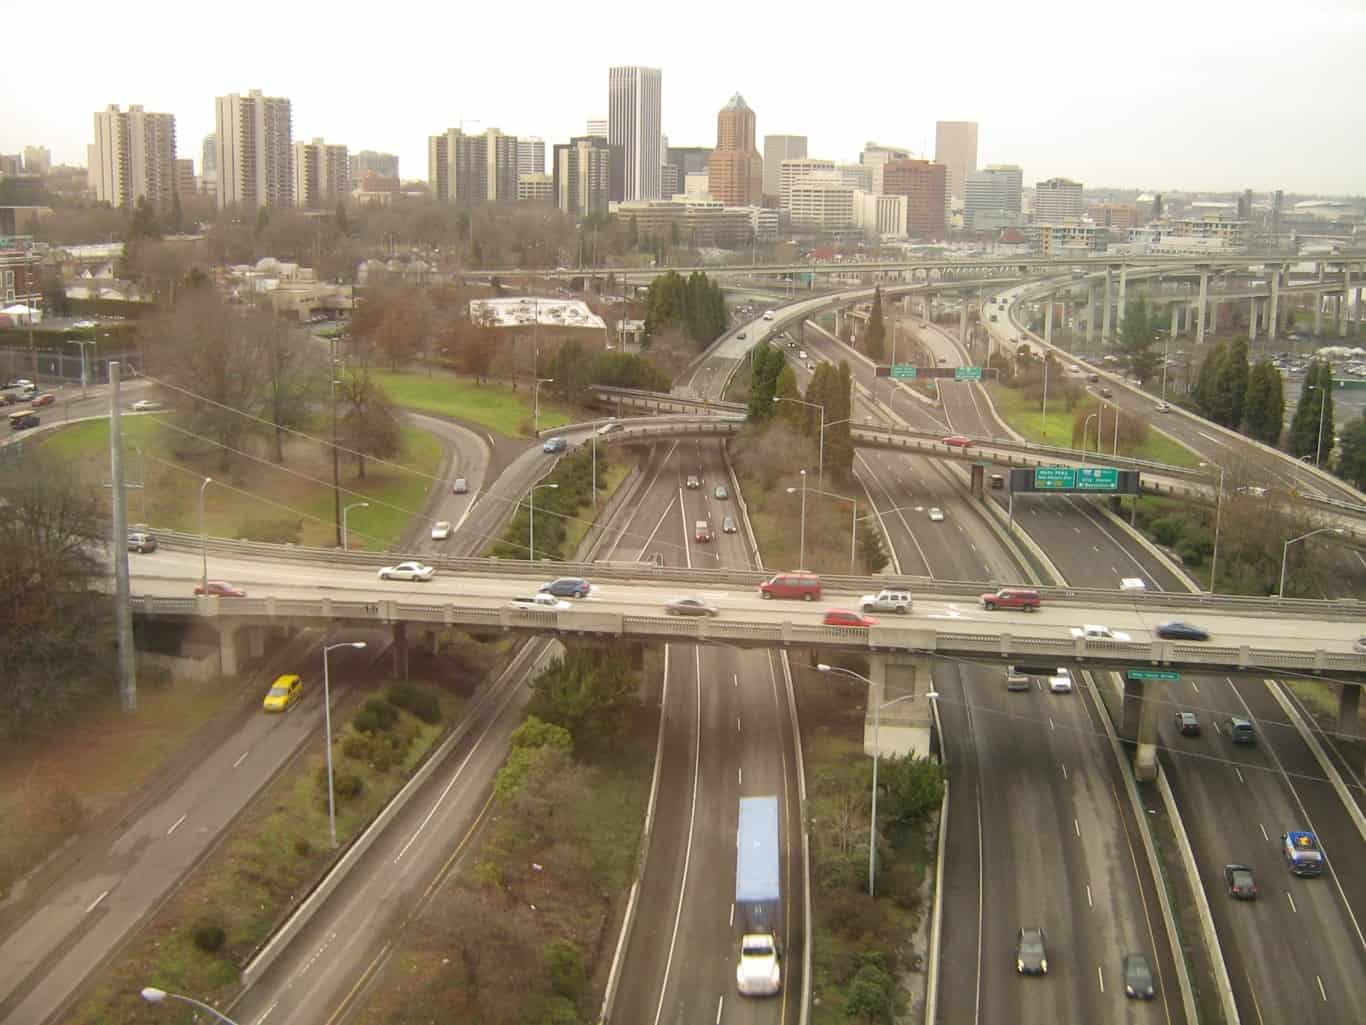
- Change in share of families in middle-income tracts, 2012 to 2022: -3.0 ppts.
- Change in share of families in upper-income tracts, 2012 to 2022: +2.7 ppts.
- Change in share of families in lower-income tracts, 2012 to 2022: +0.3 ppts.
- Median family income, 2022: $116,103
- Total population, 2022: 646,101
36. El Paso, Texas

- Change in share of families in middle-income tracts, 2012 to 2022: -3.0 ppts.
- Change in share of families in upper-income tracts, 2012 to 2022: -2.3 ppts.
- Change in share of families in lower-income tracts, 2012 to 2022: +5.3 ppts.
- Median family income, 2022: $63,067
- Total population, 2022: 677,181
35. Santa Rosa, California

- Change in share of families in middle-income tracts, 2012 to 2022: -3.2 ppts.
- Change in share of families in upper-income tracts, 2012 to 2022: +10.6 ppts.
- Change in share of families in lower-income tracts, 2012 to 2022: -7.4 ppts.
- Median family income, 2022: $110,196
- Total population, 2022: 178,221
34. Escondido, California
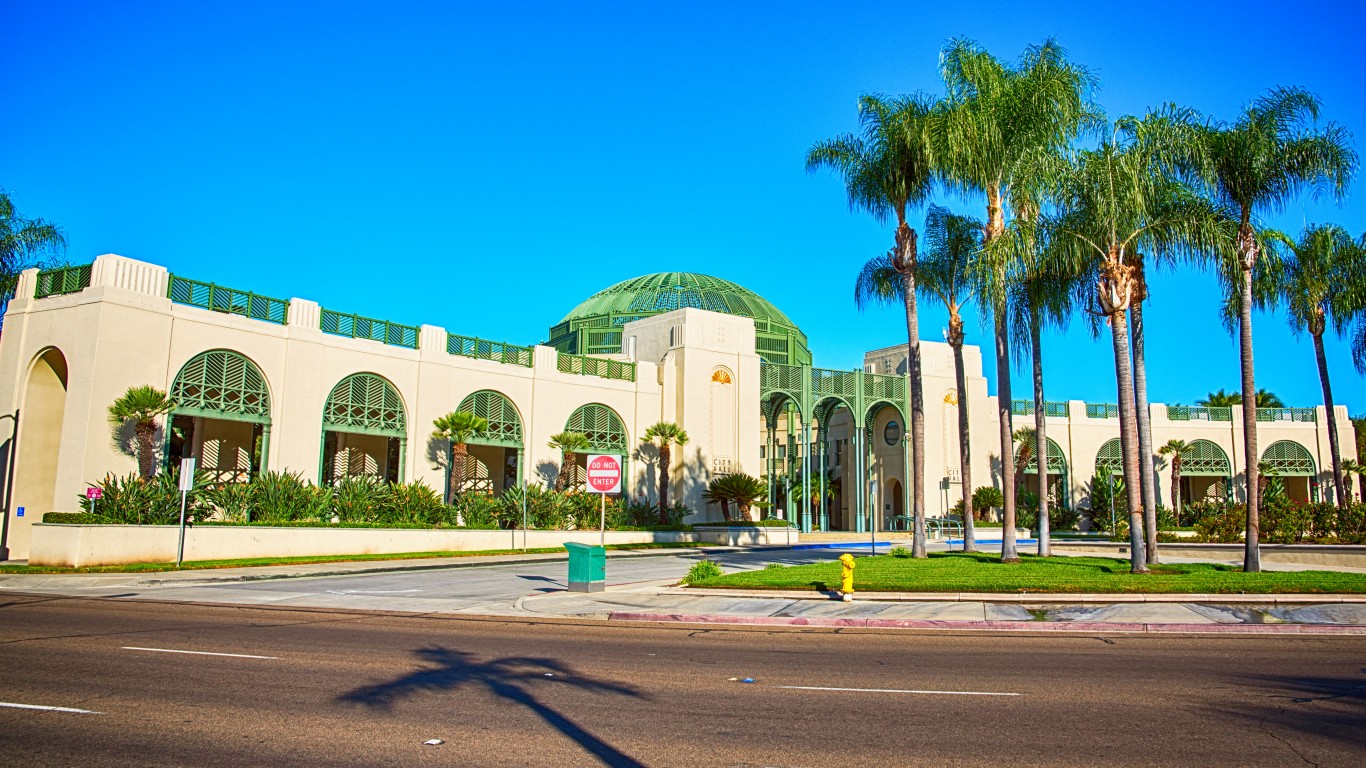
- Change in share of families in middle-income tracts, 2012 to 2022: -3.3 ppts.
- Change in share of families in upper-income tracts, 2012 to 2022: -3.7 ppts.
- Change in share of families in lower-income tracts, 2012 to 2022: +7.0 ppts.
- Median family income, 2022: $89,970
- Total population, 2022: 151,114
33. Peoria, Arizona
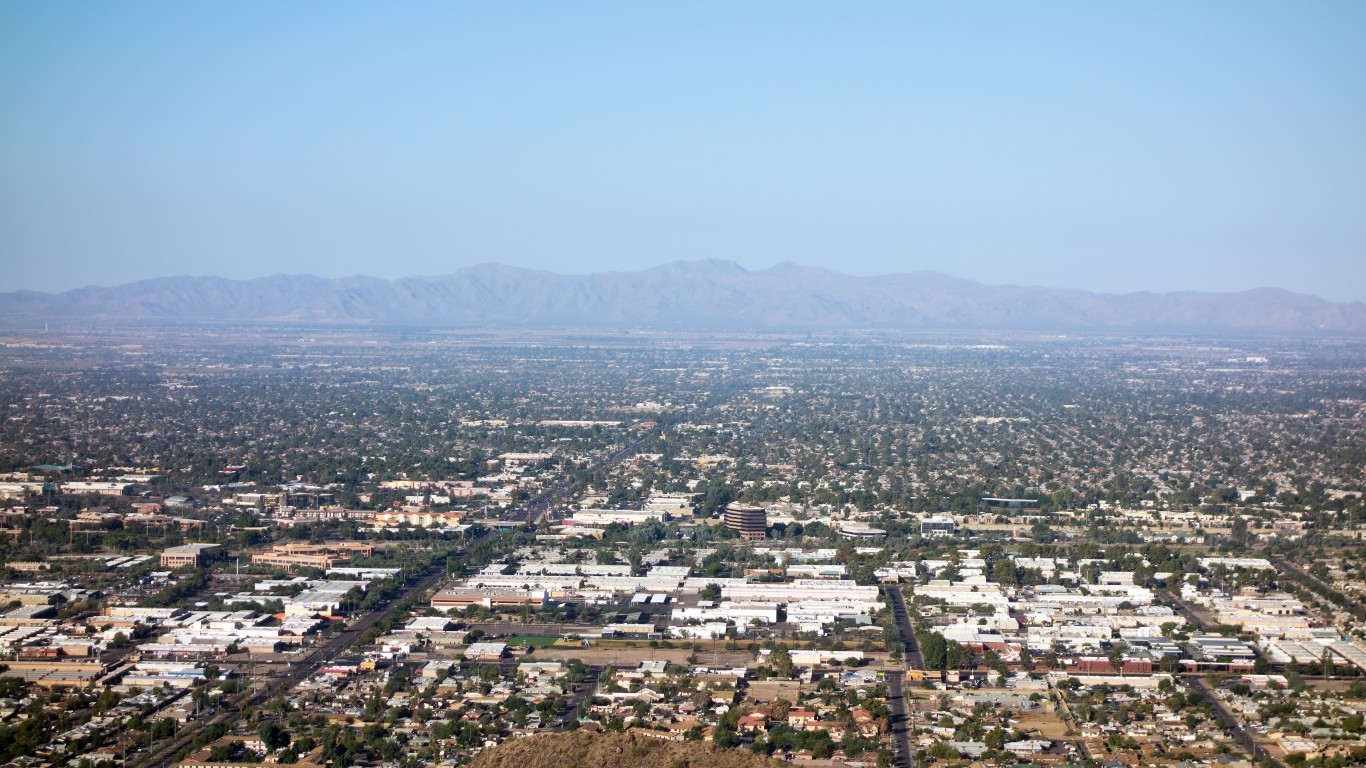
- Change in share of families in middle-income tracts, 2012 to 2022: -3.3 ppts.
- Change in share of families in upper-income tracts, 2012 to 2022: +3.2 ppts.
- Change in share of families in lower-income tracts, 2012 to 2022: +0.1 ppts.
- Median family income, 2022: $102,661
- Total population, 2022: 191,292
32. Glendale, Arizona

- Change in share of families in middle-income tracts, 2012 to 2022: -3.4 ppts.
- Change in share of families in upper-income tracts, 2012 to 2022: +6.0 ppts.
- Change in share of families in lower-income tracts, 2012 to 2022: -2.6 ppts.
- Median family income, 2022: $77,602
- Total population, 2022: 248,083
31. Jackson, Mississippi

- Change in share of families in middle-income tracts, 2012 to 2022: -3.6 ppts.
- Change in share of families in upper-income tracts, 2012 to 2022: +1.0 ppts.
- Change in share of families in lower-income tracts, 2012 to 2022: +2.6 ppts.
- Median family income, 2022: $52,443
- Total population, 2022: 153,271
30. Boston, Massachusetts

- Change in share of families in middle-income tracts, 2012 to 2022: -3.6 ppts.
- Change in share of families in upper-income tracts, 2012 to 2022: +4.6 ppts.
- Change in share of families in lower-income tracts, 2012 to 2022: -1.0 ppts.
- Median family income, 2022: $106,015
- Total population, 2022: 665,945
29. Madison, Wisconsin
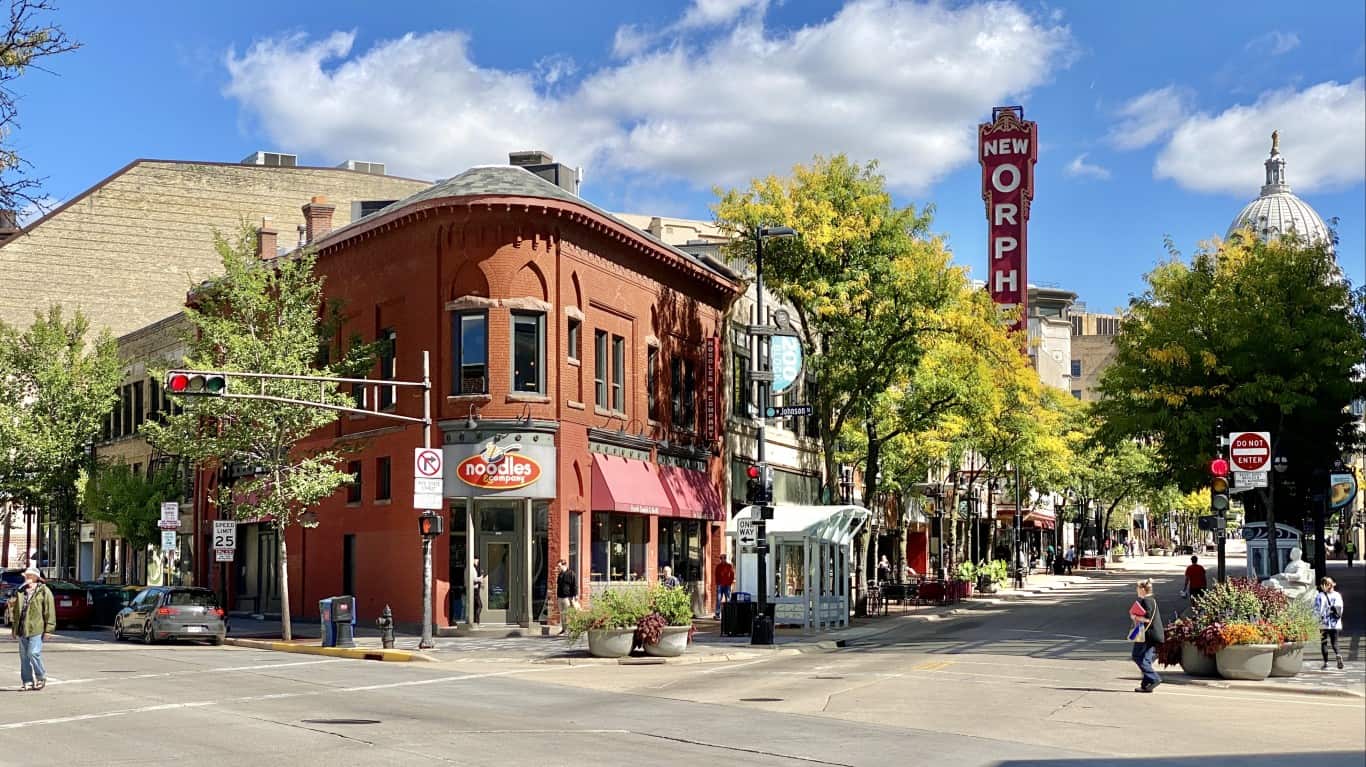
- Change in share of families in middle-income tracts, 2012 to 2022: -4.0 ppts.
- Change in share of families in upper-income tracts, 2012 to 2022: +1.5 ppts.
- Change in share of families in lower-income tracts, 2012 to 2022: +2.6 ppts.
- Median family income, 2022: $111,576
- Total population, 2022: 268,516
28. Spring Valley, Nevada
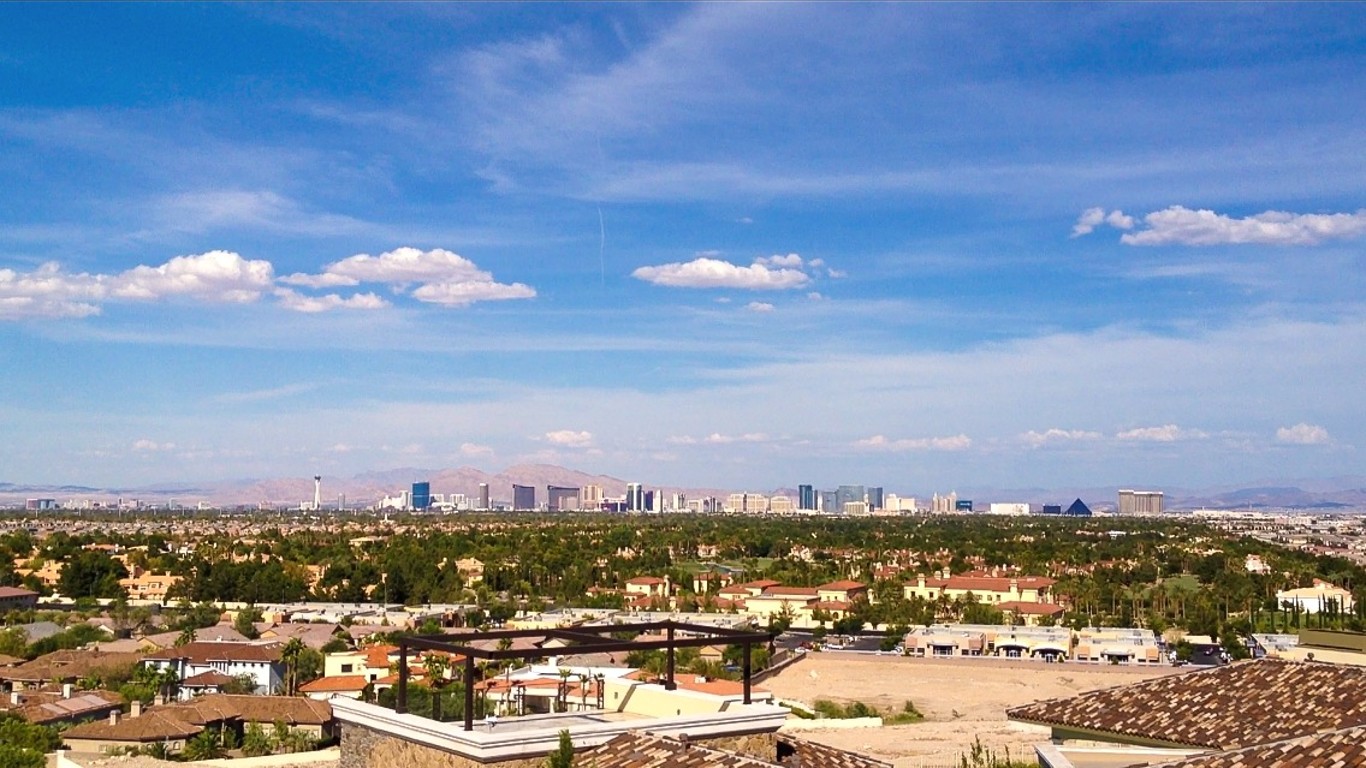
- Change in share of families in middle-income tracts, 2012 to 2022: -4.8 ppts.
- Change in share of families in upper-income tracts, 2012 to 2022: -2.7 ppts.
- Change in share of families in lower-income tracts, 2012 to 2022: +7.4 ppts.
- Median family income, 2022: $79,763
- Total population, 2022: 220,114
27. Birmingham, Alabama

- Change in share of families in middle-income tracts, 2012 to 2022: -5.1 ppts.
- Change in share of families in upper-income tracts, 2012 to 2022: -3.6 ppts.
- Change in share of families in lower-income tracts, 2012 to 2022: +8.7 ppts.
- Median family income, 2022: $55,541
- Total population, 2022: 200,431
26. Baton Rouge, Louisiana
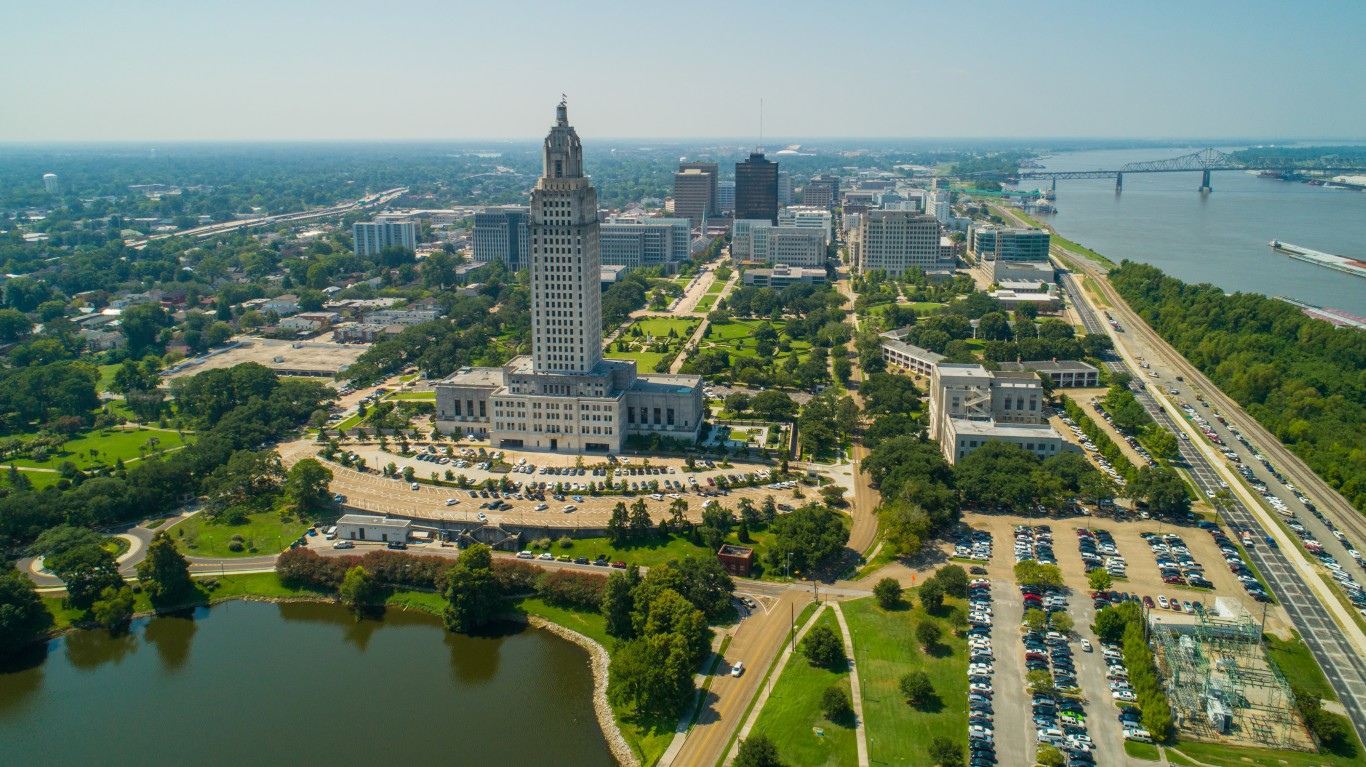
- Change in share of families in middle-income tracts, 2012 to 2022: -5.3 ppts.
- Change in share of families in upper-income tracts, 2012 to 2022: +3.4 ppts.
- Change in share of families in lower-income tracts, 2012 to 2022: +1.9 ppts.
- Median family income, 2022: $68,228
- Total population, 2022: 225,500
25. Chesapeake, Virginia
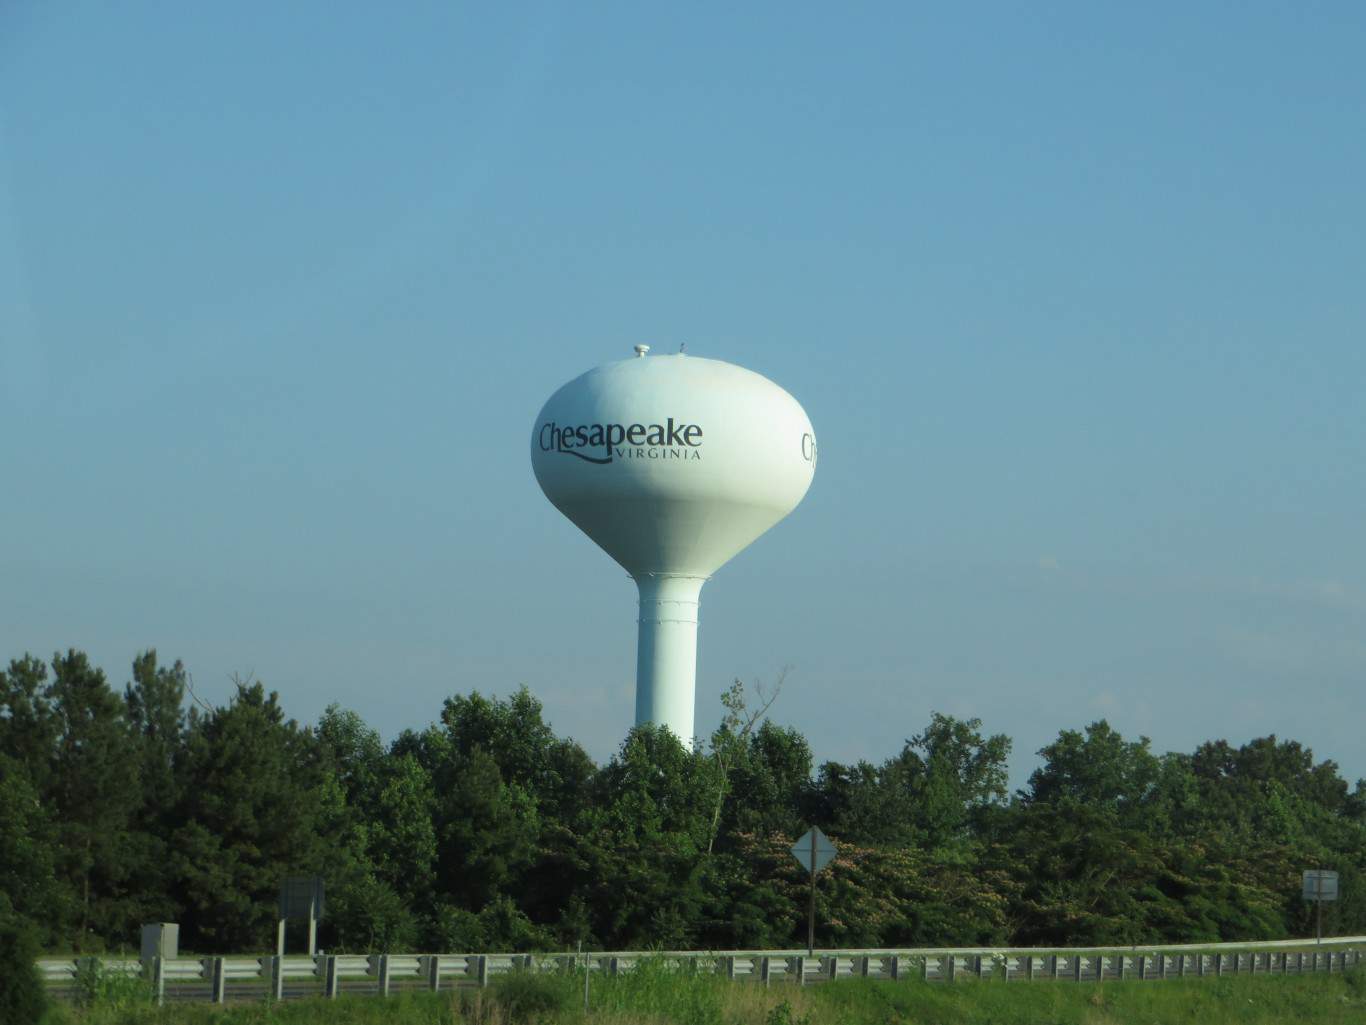
- Change in share of families in middle-income tracts, 2012 to 2022: -5.4 ppts.
- Change in share of families in upper-income tracts, 2012 to 2022: +6.3 ppts.
- Change in share of families in lower-income tracts, 2012 to 2022: -0.9 ppts.
- Median family income, 2022: $109,923
- Total population, 2022: 249,377
24. Atlanta, Georgia

- Change in share of families in middle-income tracts, 2012 to 2022: -5.6 ppts.
- Change in share of families in upper-income tracts, 2012 to 2022: +11.9 ppts.
- Change in share of families in lower-income tracts, 2012 to 2022: -6.3 ppts.
- Median family income, 2022: $103,886
- Total population, 2022: 494,838
23. Fayetteville, North Carolina
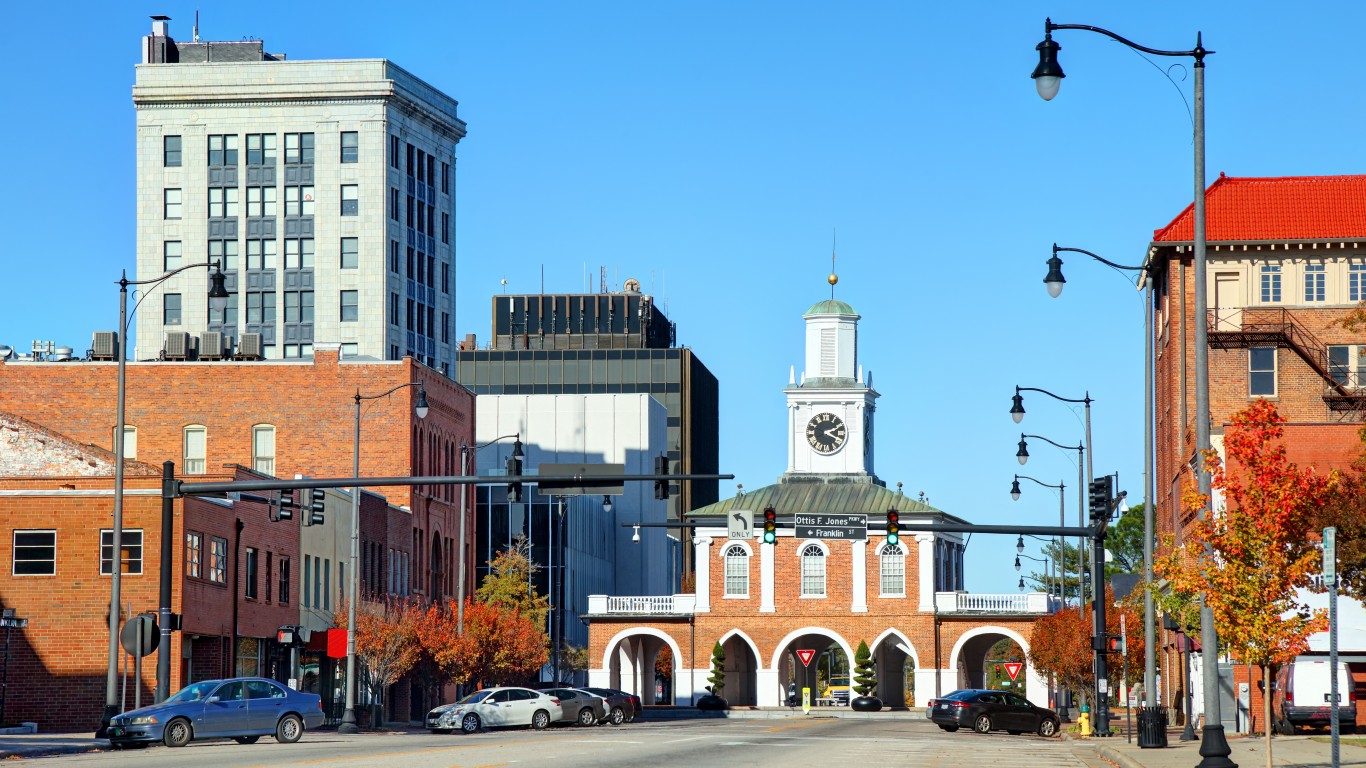
- Change in share of families in middle-income tracts, 2012 to 2022: -5.7 ppts.
- Change in share of families in upper-income tracts, 2012 to 2022: +8.4 ppts.
- Change in share of families in lower-income tracts, 2012 to 2022: -2.8 ppts.
- Median family income, 2022: $63,485
- Total population, 2022: 208,697
22. Corpus Christi, Texas
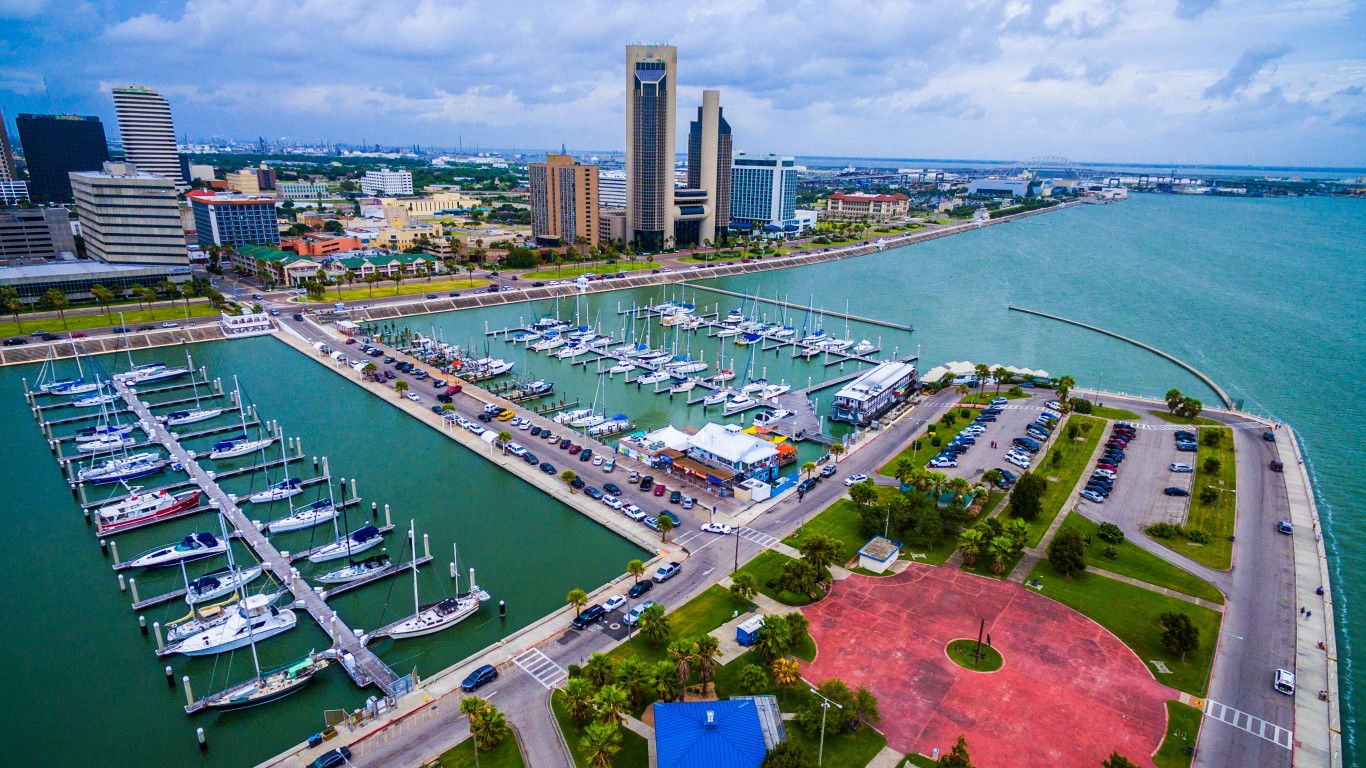
- Change in share of families in middle-income tracts, 2012 to 2022: -6.0 ppts.
- Change in share of families in upper-income tracts, 2012 to 2022: +3.5 ppts.
- Change in share of families in lower-income tracts, 2012 to 2022: +2.5 ppts.
- Median family income, 2022: $78,428
- Total population, 2022: 317,804
21. Amarillo, Texas

- Change in share of families in middle-income tracts, 2012 to 2022: -6.7 ppts.
- Change in share of families in upper-income tracts, 2012 to 2022: -0.2 ppts.
- Change in share of families in lower-income tracts, 2012 to 2022: +6.9 ppts.
- Median family income, 2022: $76,749
- Total population, 2022: 200,360
20. Henderson, Nevada

- Change in share of families in middle-income tracts, 2012 to 2022: -8.1 ppts.
- Change in share of families in upper-income tracts, 2012 to 2022: +0.0 ppts.
- Change in share of families in lower-income tracts, 2012 to 2022: +8.0 ppts.
- Median family income, 2022: $100,794
- Total population, 2022: 318,063
19. Santa Ana, California
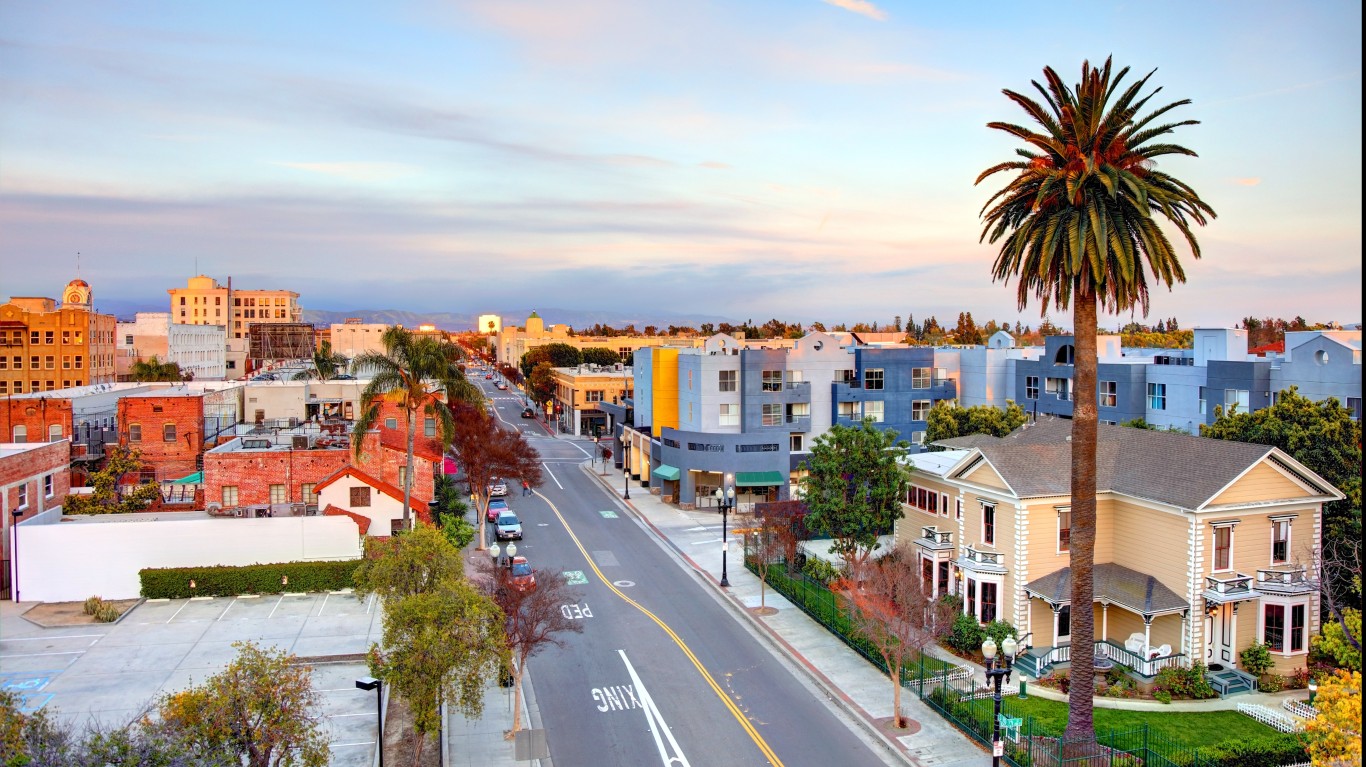
- Change in share of families in middle-income tracts, 2012 to 2022: -8.3 ppts.
- Change in share of families in upper-income tracts, 2012 to 2022: +2.3 ppts.
- Change in share of families in lower-income tracts, 2012 to 2022: +6.0 ppts.
- Median family income, 2022: $83,689
- Total population, 2022: 311,379
18. Newport News, Virginia

- Change in share of families in middle-income tracts, 2012 to 2022: -8.8 ppts.
- Change in share of families in upper-income tracts, 2012 to 2022: +0.8 ppts.
- Change in share of families in lower-income tracts, 2012 to 2022: +8.0 ppts.
- Median family income, 2022: $77,483
- Total population, 2022: 185,118
17. Hialeah, Florida

- Change in share of families in middle-income tracts, 2012 to 2022: -9.0 ppts.
- Change in share of families in upper-income tracts, 2012 to 2022: +9.5 ppts.
- Change in share of families in lower-income tracts, 2012 to 2022: -0.5 ppts.
- Median family income, 2022: $55,066
- Total population, 2022: 222,996
16. Augusta, Georgia
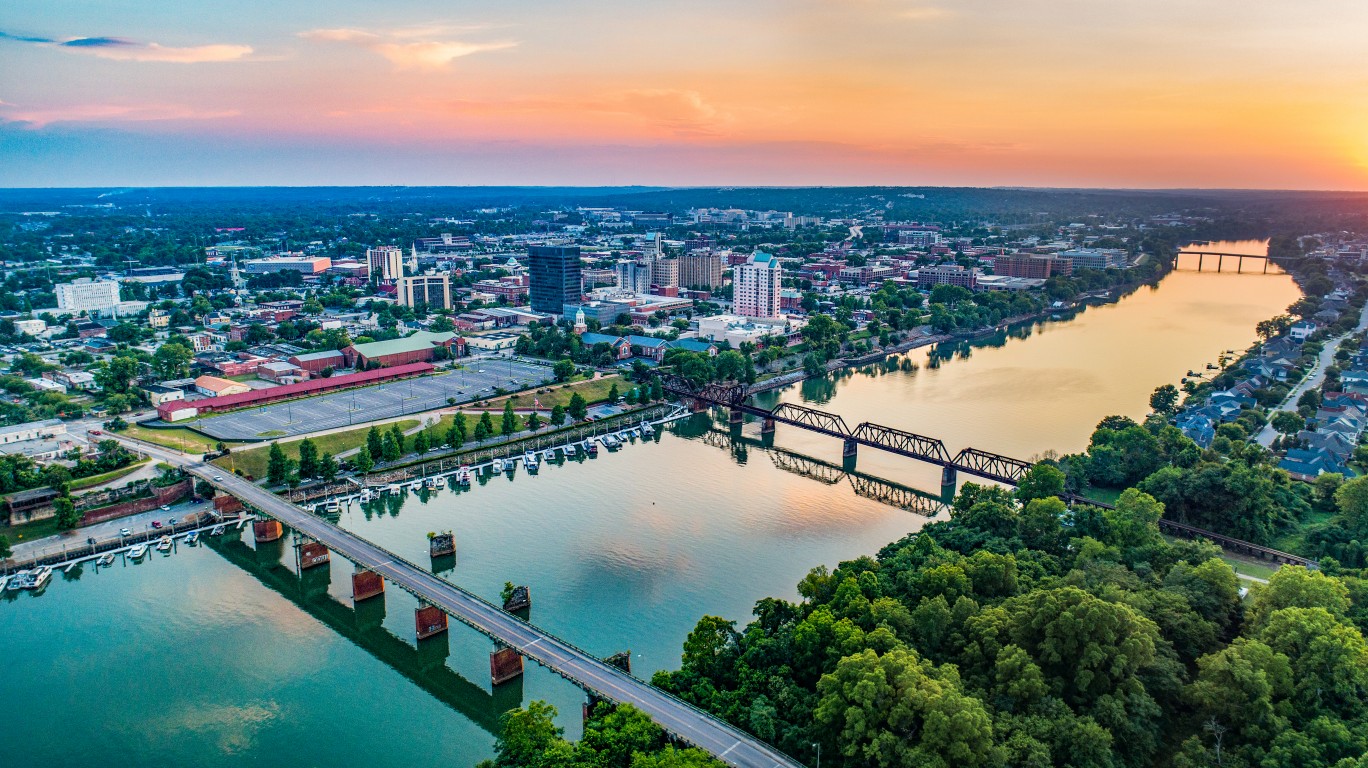
- Change in share of families in middle-income tracts, 2012 to 2022: -10.0 ppts.
- Change in share of families in upper-income tracts, 2012 to 2022: -0.4 ppts.
- Change in share of families in lower-income tracts, 2012 to 2022: +10.4 ppts.
- Median family income, 2022: $60,664
- Total population, 2022: 201,615
15. Tulsa, Oklahoma

- Change in share of families in middle-income tracts, 2012 to 2022: -10.0 ppts.
- Change in share of families in upper-income tracts, 2012 to 2022: +2.7 ppts.
- Change in share of families in lower-income tracts, 2012 to 2022: +7.4 ppts.
- Median family income, 2022: $74,430
- Total population, 2022: 411,938
14. Irvine, California
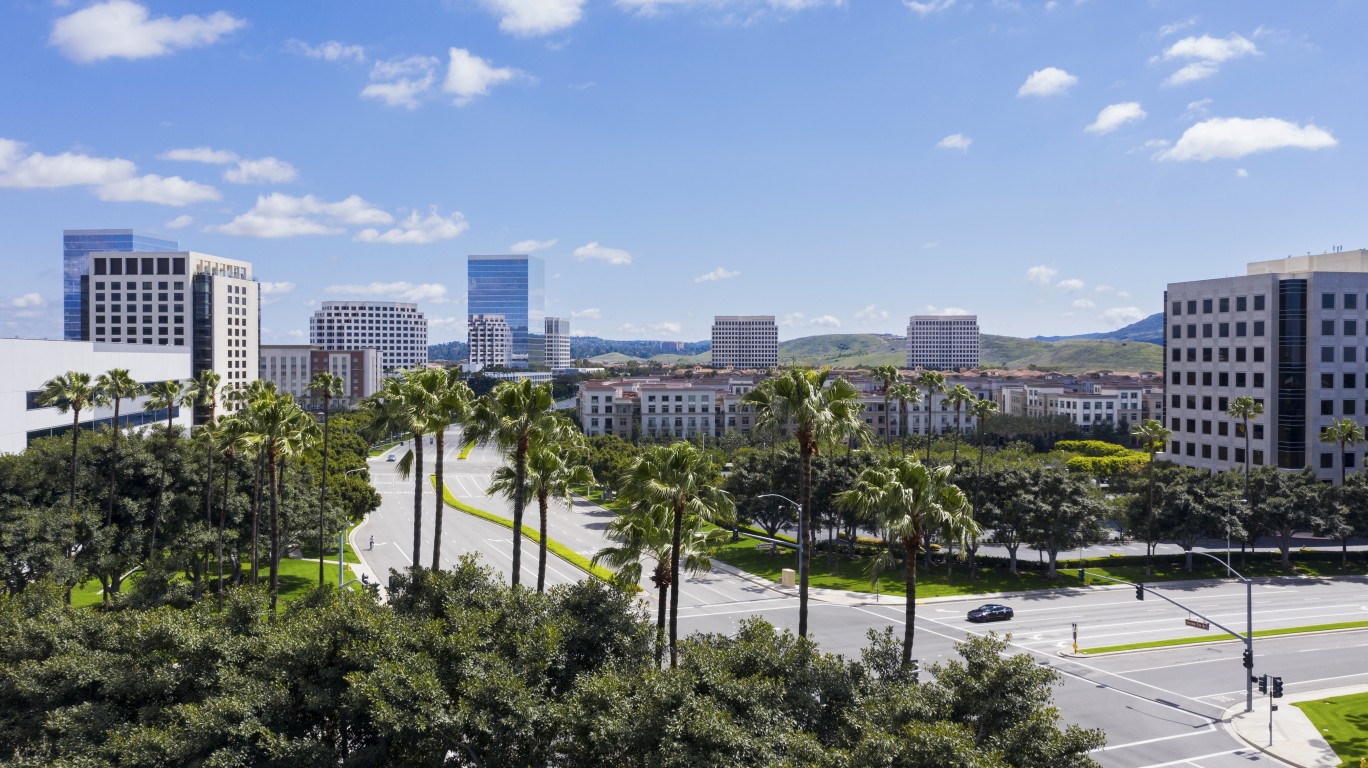
- Change in share of families in middle-income tracts, 2012 to 2022: -10.2 ppts.
- Change in share of families in upper-income tracts, 2012 to 2022: +3.3 ppts.
- Change in share of families in lower-income tracts, 2012 to 2022: +6.9 ppts.
- Median family income, 2022: $153,615
- Total population, 2022: 304,527
13. Sunnyvale, California
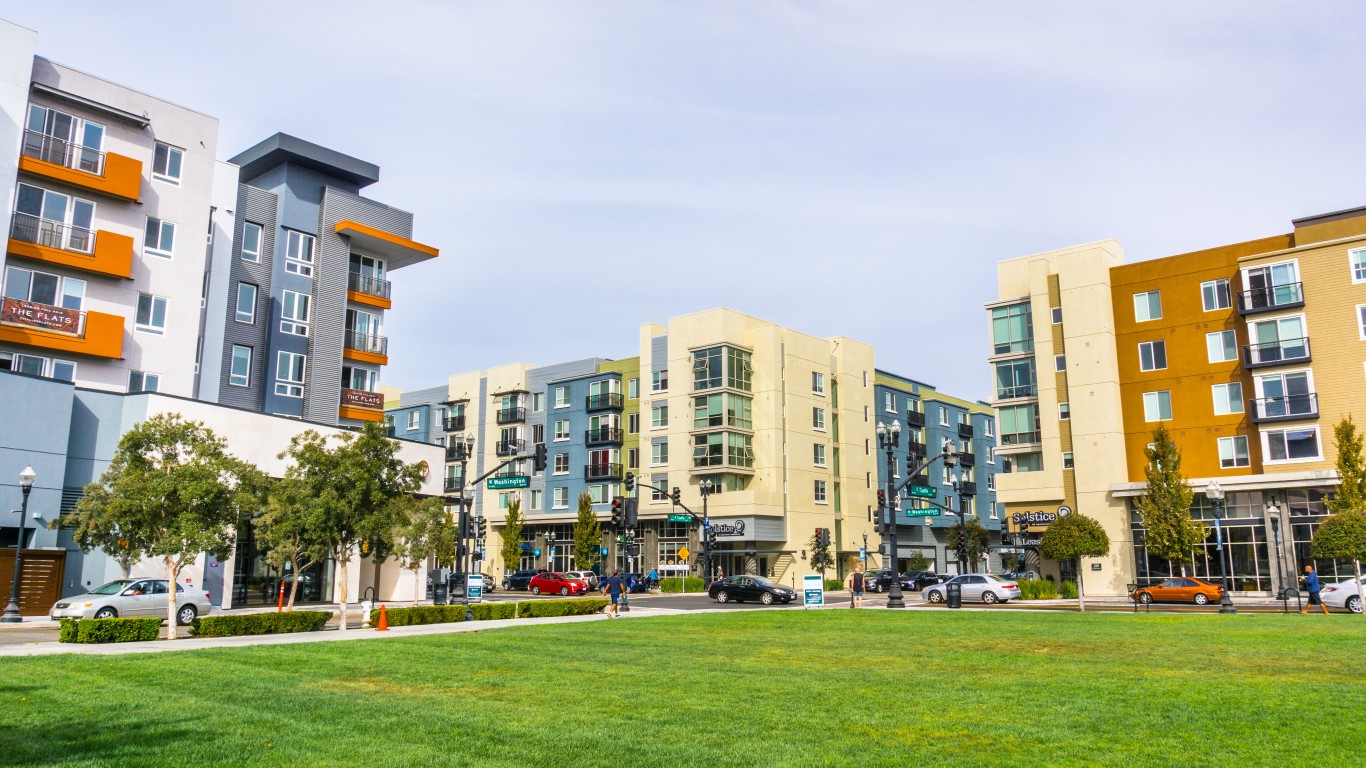
- Change in share of families in middle-income tracts, 2012 to 2022: -10.4 ppts.
- Change in share of families in upper-income tracts, 2012 to 2022: -3.2 ppts.
- Change in share of families in lower-income tracts, 2012 to 2022: +13.5 ppts.
- Median family income, 2022: $190,031
- Total population, 2022: 154,573
12. Oxnard, California

- Change in share of families in middle-income tracts, 2012 to 2022: -11.3 ppts.
- Change in share of families in upper-income tracts, 2012 to 2022: +0.5 ppts.
- Change in share of families in lower-income tracts, 2012 to 2022: +10.8 ppts.
- Median family income, 2022: $89,908
- Total population, 2022: 202,279
11. Tampa, Florida

- Change in share of families in middle-income tracts, 2012 to 2022: -11.6 ppts.
- Change in share of families in upper-income tracts, 2012 to 2022: +11.0 ppts.
- Change in share of families in lower-income tracts, 2012 to 2022: +0.6 ppts.
- Median family income, 2022: $84,185
- Total population, 2022: 388,768
10. Urban Honolulu, Hawaii

- Change in share of families in middle-income tracts, 2012 to 2022: -12.1 ppts.
- Change in share of families in upper-income tracts, 2012 to 2022: +8.1 ppts.
- Change in share of families in lower-income tracts, 2012 to 2022: +4.0 ppts.
- Median family income, 2022: $106,192
- Total population, 2022: 348,547
9. Paradise, Nevada

- Change in share of families in middle-income tracts, 2012 to 2022: -12.5 ppts.
- Change in share of families in upper-income tracts, 2012 to 2022: +13.8 ppts.
- Change in share of families in lower-income tracts, 2012 to 2022: -1.3 ppts.
- Median family income, 2022: $68,168
- Total population, 2022: 189,733
8. Anchorage, Alaska
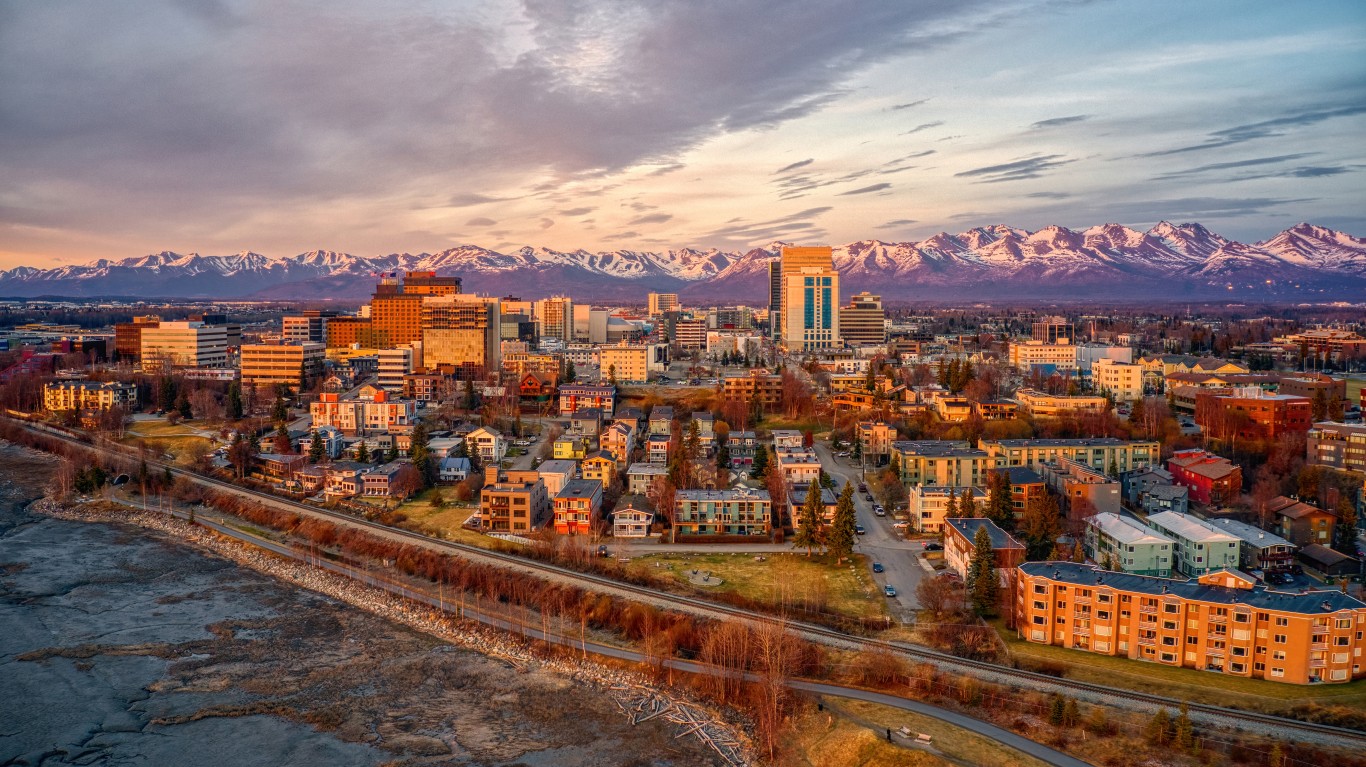
- Change in share of families in middle-income tracts, 2012 to 2022: -12.7 ppts.
- Change in share of families in upper-income tracts, 2012 to 2022: +9.4 ppts.
- Change in share of families in lower-income tracts, 2012 to 2022: +3.3 ppts.
- Median family income, 2022: $115,272
- Total population, 2022: 290,674
7. Paterson, New Jersey

- Change in share of families in middle-income tracts, 2012 to 2022: -12.8 ppts.
- Change in share of families in upper-income tracts, 2012 to 2022: +4.4 ppts.
- Change in share of families in lower-income tracts, 2012 to 2022: +8.4 ppts.
- Median family income, 2022: $59,976
- Total population, 2022: 157,864
6. Orlando, Florida

- Change in share of families in middle-income tracts, 2012 to 2022: -12.9 ppts.
- Change in share of families in upper-income tracts, 2012 to 2022: +6.5 ppts.
- Change in share of families in lower-income tracts, 2012 to 2022: +6.4 ppts.
- Median family income, 2022: $74,980
- Total population, 2022: 307,738
5. Clarksville, Tennessee
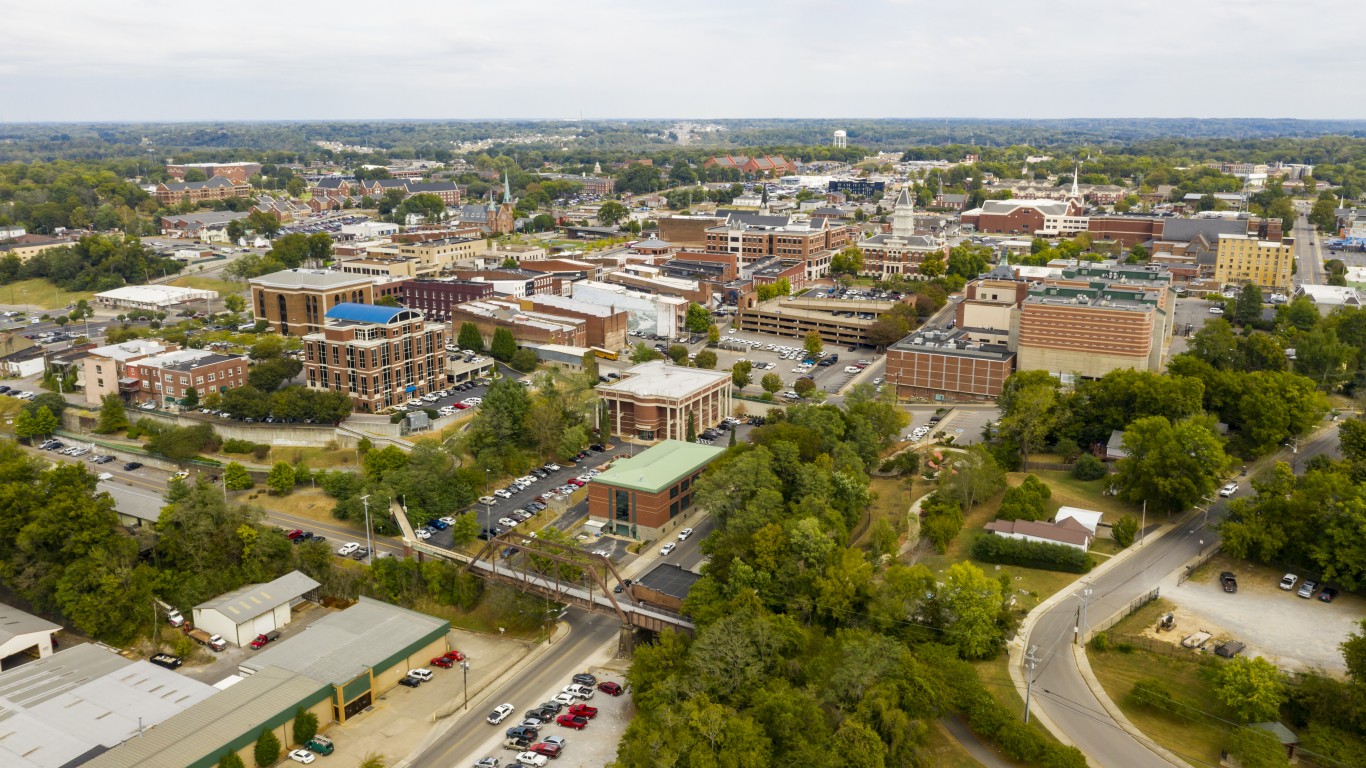
- Change in share of families in middle-income tracts, 2012 to 2022: -14.0 ppts.
- Change in share of families in upper-income tracts, 2012 to 2022: +5.8 ppts.
- Change in share of families in lower-income tracts, 2012 to 2022: +8.3 ppts.
- Median family income, 2022: $73,333
- Total population, 2022: 167,882
4. Laredo, Texas
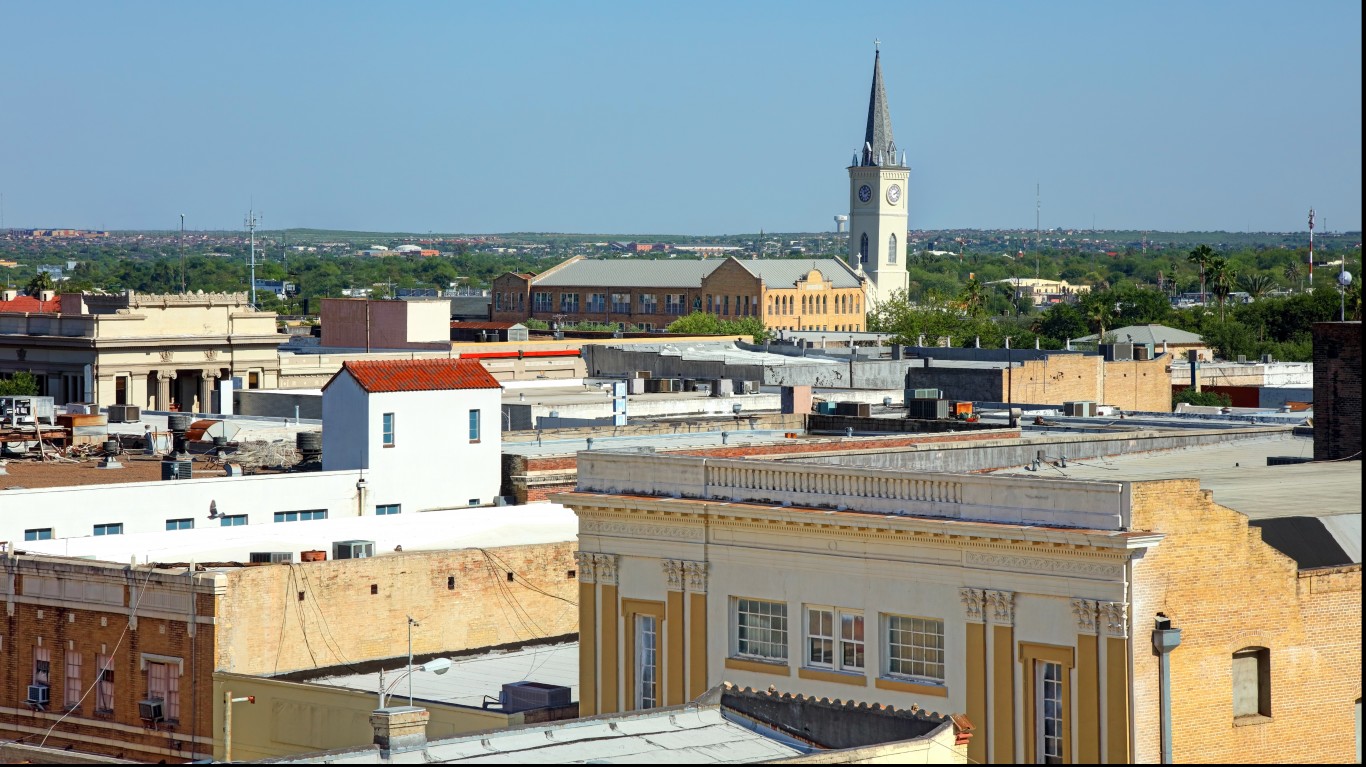
- Change in share of families in middle-income tracts, 2012 to 2022: -15.6 ppts.
- Change in share of families in upper-income tracts, 2012 to 2022: +5.4 ppts.
- Change in share of families in lower-income tracts, 2012 to 2022: +10.2 ppts.
- Median family income, 2022: $66,315
- Total population, 2022: 255,293
3. Fort Lauderdale, Florida
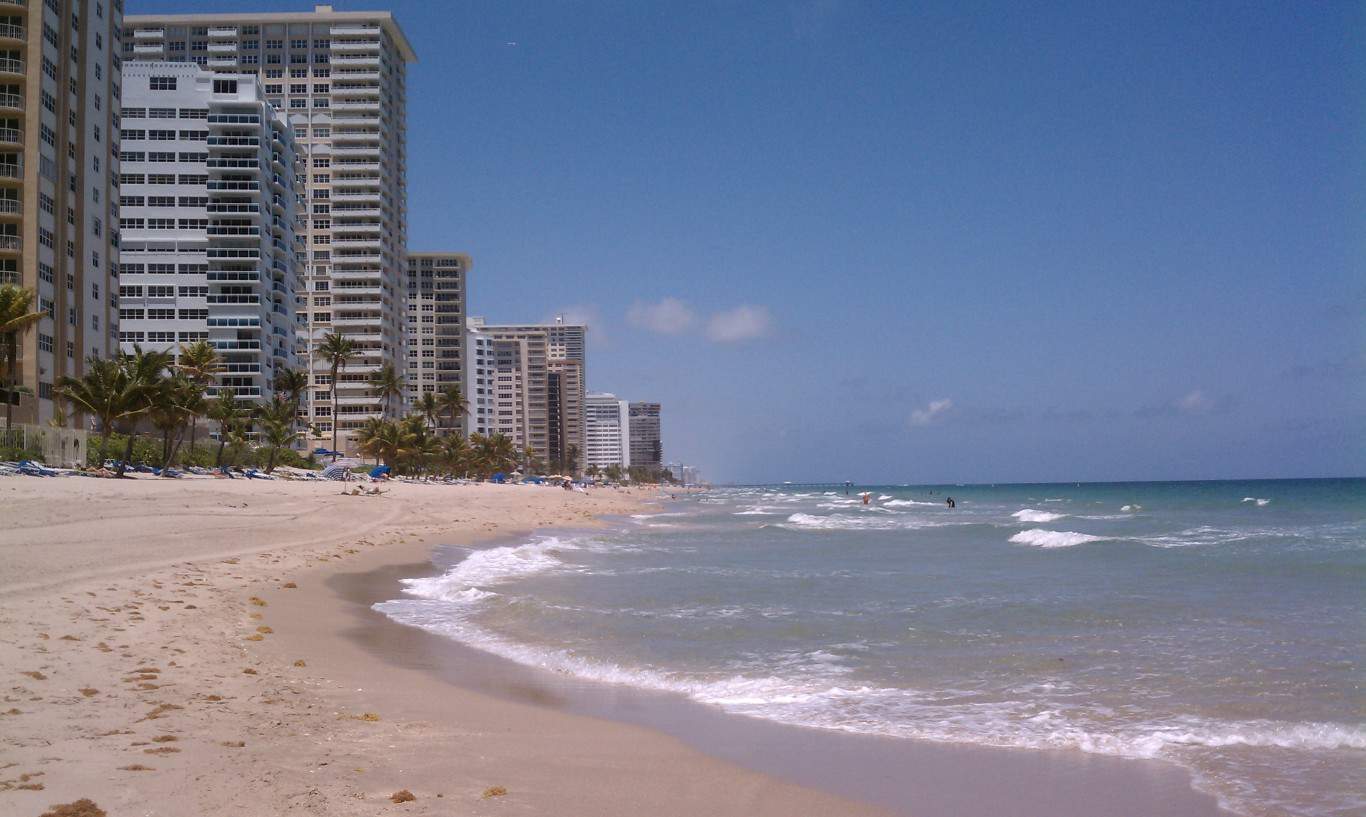
- Change in share of families in middle-income tracts, 2012 to 2022: -16.6 ppts.
- Change in share of families in upper-income tracts, 2012 to 2022: +9.3 ppts.
- Change in share of families in lower-income tracts, 2012 to 2022: +7.3 ppts.
- Median family income, 2022: $87,676
- Total population, 2022: 182,673
2. Murfreesboro, Tennessee

- Change in share of families in middle-income tracts, 2012 to 2022: -16.7 ppts.
- Change in share of families in upper-income tracts, 2012 to 2022: +2.1 ppts.
- Change in share of families in lower-income tracts, 2012 to 2022: +14.6 ppts.
- Median family income, 2022: $90,863
- Total population, 2022: 153,487
1. Jersey City, New Jersey

- Change in share of families in middle-income tracts, 2012 to 2022: -20.1 ppts.
- Change in share of families in upper-income tracts, 2012 to 2022: +10.4 ppts.
- Change in share of families in lower-income tracts, 2012 to 2022: +9.7 ppts.
- Median family income, 2022: $102,072
- Total population, 2022: 287,899
The #1 Thing to Do Before You Claim Social Security (Sponsor)
Choosing the right (or wrong) time to claim Social Security can dramatically change your retirement. So, before making one of the biggest decisions of your financial life, it’s a smart idea to get an extra set of eyes on your complete financial situation.
A financial advisor can help you decide the right Social Security option for you and your family. Finding a qualified financial advisor doesn’t have to be hard. SmartAsset’s free tool matches you with up to three financial advisors who serve your area, and you can interview your advisor matches at no cost to decide which one is right for you.
Click here to match with up to 3 financial pros who would be excited to help you optimize your Social Security outcomes.
Have questions about retirement or personal finance? Email us at [email protected]!
By emailing your questions to 24/7 Wall St., you agree to have them published anonymously on a673b.bigscoots-temp.com.
By submitting your story, you understand and agree that we may use your story, or versions of it, in all media and platforms, including via third parties.
Thank you for reading! Have some feedback for us?
Contact the 24/7 Wall St. editorial team.
Latest from 24/7