
24/7 Wall St. Insight
- How much Americans are able to save depends on several factors.
- Cost of housing, however, seems to be a most dominant factor
- California has the most cities where it is hardest to save
- Also: 2 Dividend Legends To Hold Forever
Americans’ personal saving rate — saving as a percentage of disposable personal income — declined in June 2024 to the lowest levels since December 2022. When the pandemic hit, the saving rate went through the roof, reaching 32% and remaining well in the double digits for about a year. This changed in early 2021. With easing restrictions and inflation rearing its head, the saving rate declined to low single digits, responding to inflation levels. By June 2024, Americans managed to save only 3.4% of their disposable income, according to data from the Bureau of Economic Analysis.
How much people are able to save depends on several factors in addition to income, such as inflation, cost of living, cost of housing, taxes, and more. And while in some American cities conditions are more conducive to saving, in others, conditions make it very difficult to save.
To find the cities where it is the most difficult to save money, 24/7 Wall St. reviewed Finance Buzz’s report, The U.S. Cities Where It’s Easiest To Save Money (2024). The report scores 125 of the biggest U.S. cities and considers such factors as overall cost of living; median income; median monthly rent payment as a percentage of median income; median monthly mortgage costs as a percentage of median income; average effective tax burden; debt-to-income ratio; and median amount of credit card debt. The 30 cities with the lowest score out of 100 are listed here. We added median household income (the national median is $74,755) and population for each city from the Census Bureau.
The average score for the 125 cities is 50.1 out of 100 and the cost of living is 12.7% higher than the U.S. average. Residents of these cities pay on average 30% of their wages on rent or 41% of their wages on mortgage payments.
The cities on the list score 43 or lower. In 22, the cost of living is higher than the average for the cities, capping out in Honolulu and New York city, where the cost of living is over 71% more expensive than the national average. Similarly, in all but two cities, the expense on rent is higher than 30%, including 11 where rent expense is 40% or more of wages. The highest rent expense is in Santa Ana, California, where residents pay 54% of their income on rent.
In 25 cities, mortgage payments account for more 41% of local income, including seven cities where mortgage expenses account for 60% or more of income. In Miami, residents spend 71% of their income on mortgage payments.
But it is California that has the most cities on the list, including nine of the 10 cities where it is hardest to save. Surprisingly, despite Florida having no income tax, four Florida cities rank among those where it is hardest to save. (Also see: The Wealthiest Cities in Every US State.)
Why it matters

30. North Las Vegas, Nevada

- Overall savings score: 43.0 out of 100
- Overall cost of living: 10.6% higher than US average
- Rent / mortgage as pct of income: rent: 40%; mortgage: 43%
- Median household income, 2022: $75,459
- Average effective tax burden: 15.78%
- Median credit card debt: $3,061
- Population, 2022: 280,539
29. Reno, Nevada

- Overall savings score: 42.6 out of 100
- Overall cost of living: 18.6% higher than US average
- Rent / mortgage as pct of income: rent: 33%; mortgage: 42%
- Median household income, 2022: $72,103
- Average effective tax burden: 15.78%
- Median credit card debt: $3,506
- Population, 2022: 273,447
28. Virginia Beach, Virginia
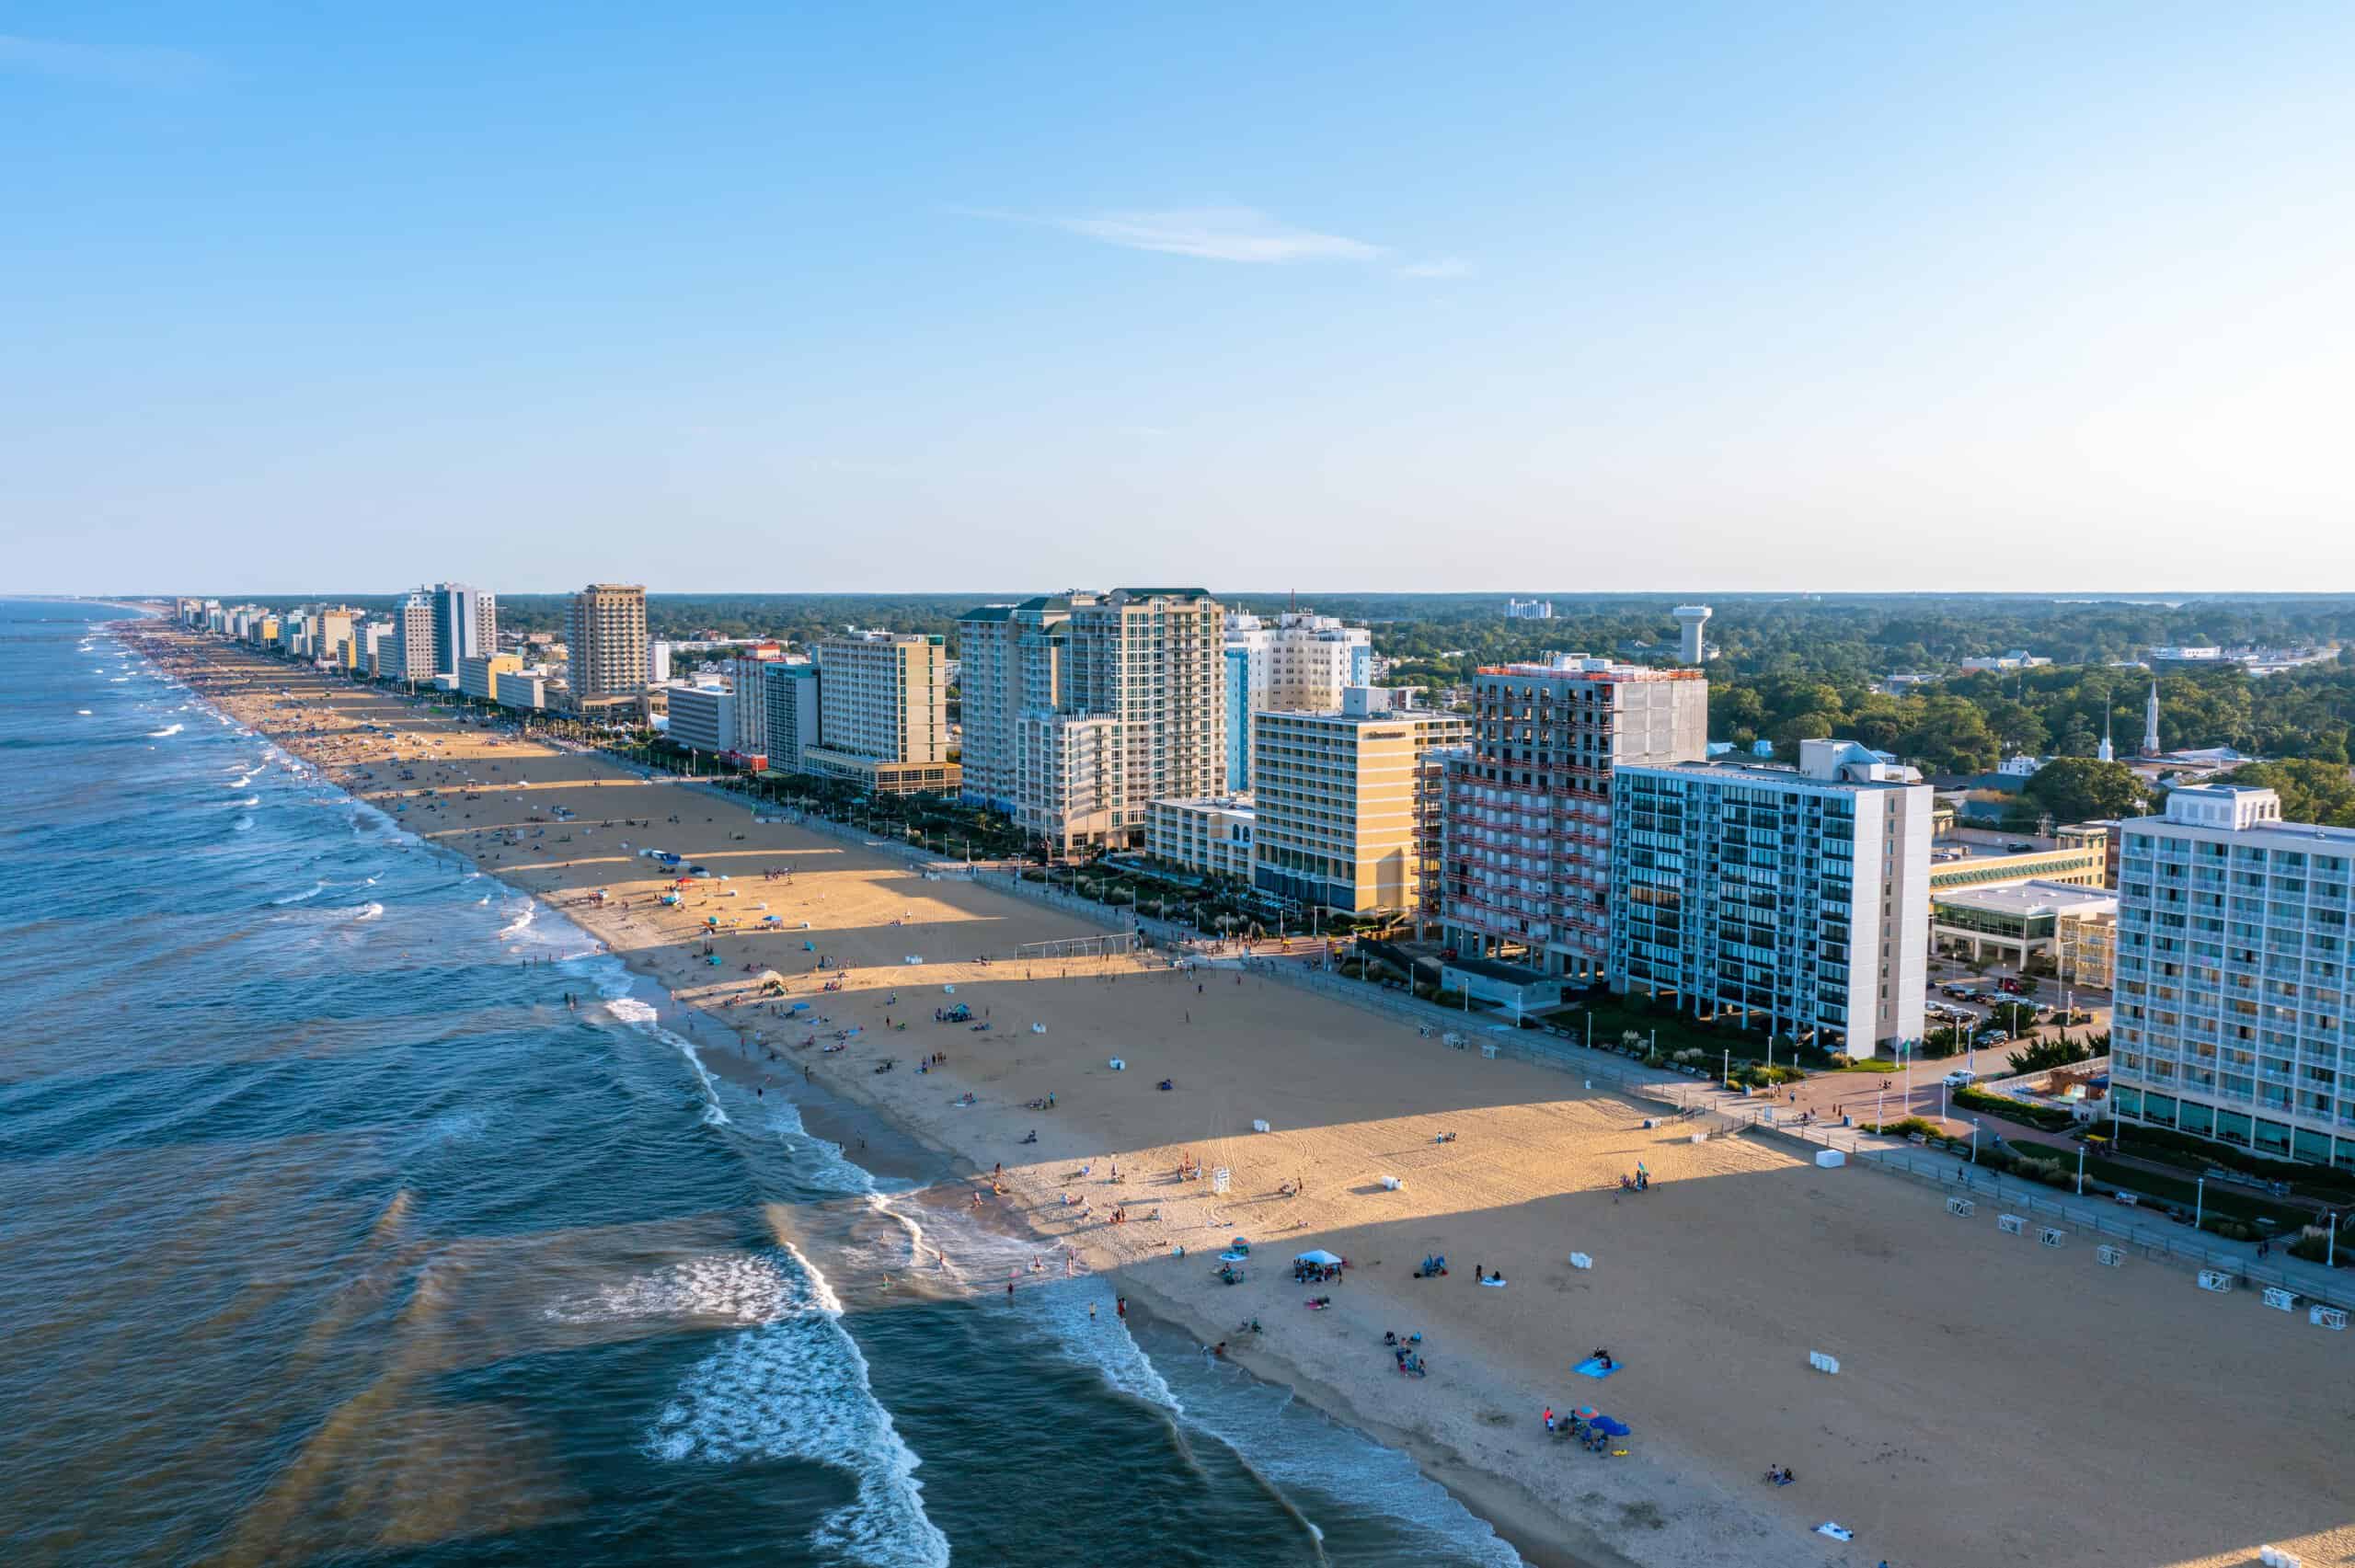
- Overall savings score: 42.1 out of 100
- Overall cost of living: 4.8% higher than US average
- Rent / mortgage as pct of income: rent: 32%; mortgage: 39%
- Median household income, 2022: $83,245
- Average effective tax burden: 21.80%
- Median credit card debt: $3,638
- Population, 2022: 455,618
27. Fayetteville, North Carolina

- Overall savings score: 41.8 out of 100
- Overall cost of living: 18.6% lower than US average
- Rent / mortgage as pct of income: rent: 34%; mortgage: 38%
- Median household income, 2022: $56,685
- Average effective tax burden: 19.60%
- Median credit card debt: $2,731
- Population, 2022: 208,888
26. Chesapeake, Virginia
- Overall savings score: 41.3 out of 100
- Overall cost of living: 3.5% higher than US average
- Rent / mortgage as pct of income: rent: 29%; mortgage: 39%
- Median household income, 2022: $87,749
- Average effective tax burden: 21.80%
- Median credit card debt: $3,723
- Population, 2022: 252,488
25. Cape Coral, Florida

- Overall savings score: 41.0 out of 100
- Overall cost of living: 4.2% higher than US average
- Rent / mortgage as pct of income: rent: 43%; mortgage: 40%
- Median household income, 2022: $76,991
- Average effective tax burden: 15.75%
- Median credit card debt: $3,271
- Population, 2022: 216,984
23. Norfolk, Virginia

- Overall savings score: 40.9 out of 100
- Overall cost of living: 8.6% lower than US average
- Rent / mortgage as pct of income: rent: 31%; mortgage: 45%
- Median household income, 2022: $61,090
- Average effective tax burden: 21.80%
- Median credit card debt: $2,995
- Population, 2022: 232,995
23. Hialeah, Florida

- Overall savings score: 40.9 out of 100
- Overall cost of living: 18.9% higher than US average
- Rent / mortgage as pct of income: rent: 47%; mortgage: 60%
- Median household income, 2022: $52,674
- Average effective tax burden: 15.75%
- Median credit card debt: $2,372
- Population, 2022: 220,274
22. Port St. Lucie, Florida
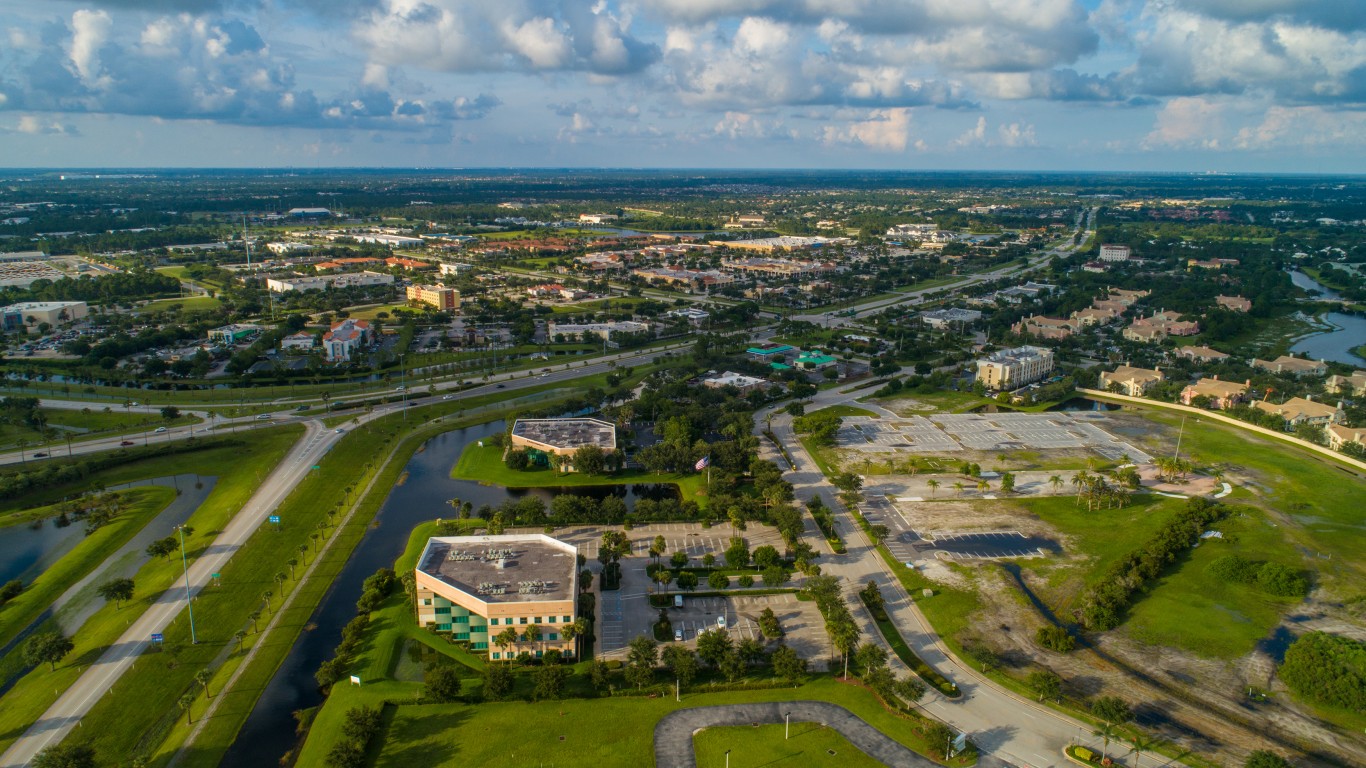
- Overall savings score: 40.8 out of 100
- Overall cost of living: 1.4% lower than US average
- Rent / mortgage as pct of income: rent: 39%; mortgage: 43%
- Median household income, 2022: $70,613
- Average effective tax burden: 15.75%
- Median credit card debt: $3,235
- Population, 2022: 231,804
21. Sacramento, California

- Overall savings score: 40.6 out of 100
- Overall cost of living: 27.2% higher than US average
- Rent / mortgage as pct of income: rent: 33%; mortgage: 44%
- Median household income, 2022: $80,254
- Average effective tax burden: 20.63%
- Median credit card debt: $2,745
- Population, 2022: 528,026
19. Santa Clarita, California

- Overall savings score: 40.0 out of 100
- Overall cost of living: 61.7% higher than US average
- Rent / mortgage as pct of income: rent: 37%; mortgage: 50%
- Median household income, 2022: $111,236
- Average effective tax burden: 20.49%
- Median credit card debt: $3,980
- Population, 2022: 221,362
19. Aurora, Colorado

- Overall savings score: 40.0 out of 100
- Overall cost of living: 23.7% higher than US average
- Rent / mortgage as pct of income: rent: 37%; mortgage: 42%
- Median household income, 2022: $81,395
- Average effective tax burden: 20.66%
- Median credit card debt: $3,043
- Population, 2022: 393,319
18. Miami, Florida

- Overall savings score: 38.8 out of 100
- Overall cost of living: 18.9% higher than US average
- Rent / mortgage as pct of income: rent: 41%; mortgage: 71%
- Median household income, 2022: $60,989
- Average effective tax burden: 15.75%
- Median credit card debt: $3,106
- Population, 2022: 449,484
17. Colorado Springs, Colorado

- Overall savings score: 38.3 out of 100
- Overall cost of living: 10.3% higher than US average
- Rent / mortgage as pct of income: rent: 33%; mortgage: 40%
- Median household income, 2022: $78,568
- Average effective tax burden: 20.66%
- Median credit card debt: $3,158
- Population, 2022: 486,228
16. New York City, New York

- Overall savings score: 38.2 out of 100
- Overall cost of living: 72.5% higher than US average
- Rent / mortgage as pct of income: rent: 31%; mortgage: 55%
- Median household income, 2022: $74,694
- Average effective tax burden: 21.97%
- Median credit card debt: $3,752
- Population, 2022: 8,335,897
15. San Diego, California

- Overall savings score: 37.5 out of 100
- Overall cost of living: 54.9% higher than US average
- Rent / mortgage as pct of income: rent: 36%; mortgage: 49%
- Median household income, 2022: $100,010
- Average effective tax burden: 20.63%
- Median credit card debt: $3,142
- Population, 2022: 1,381,182
14. Yonkers, New York

- Overall savings score: 34.5 out of 100
- Overall cost of living: 57% higher than US average
- Rent / mortgage as pct of income: rent: 30%; mortgage: 54%
- Median household income, 2022: $67,456
- Average effective tax burden: 21.97%
- Median credit card debt: $3,075
- Population, 2022: 208,112
13. Newark, New Jersey

- Overall savings score: 34.2 out of 100
- Overall cost of living: 35% higher than US average
- Rent / mortgage as pct of income: rent: 37%; mortgage: 60%
- Median household income, 2022: $49,688
- Average effective tax burden: 21.71%
- Median credit card debt: $2,192
- Population, 2022: 305,339
12. Stockton, California

- Overall savings score: 32.8 out of 100
- Overall cost of living: 24.7% higher than US average
- Rent / mortgage as pct of income: rent: 34%; mortgage: 46%
- Median household income, 2022: $76,231
- Average effective tax burden: 20.63%
- Median credit card debt: $2,664
- Population, 2022: 321,796
11. Long Beach, California

- Overall savings score: 30.0 out of 100
- Overall cost of living: 61.7% higher than US average
- Rent / mortgage as pct of income: rent: 35%; mortgage: 56%
- Median household income, 2022: $80,493
- Average effective tax burden: 20.63%
- Median credit card debt: $3,083
- Population, 2022: 451,319
10. Fontana, California
- Overall savings score: 28.8 out of 100
- Overall cost of living: 18.6% higher than US average
- Rent / mortgage as pct of income: rent: 39%; mortgage: 56%
- Median household income, 2022: $93,581
- Average effective tax burden: 20.63%
- Median credit card debt: $3,010
- Population, 2022: 212,448
9. Los Angeles, California

- Overall savings score: 27.5 out of 100
- Overall cost of living: 61.7% higher than US average
- Rent / mortgage as pct of income: rent: 38%; mortgage: 68%
- Median household income, 2022: $76,135
- Average effective tax burden: 20.63%
- Median credit card debt: $3,068
- Population, 2022: 3,822,224
8. Honolulu, Hawaii

- Overall savings score: 27.0 out of 100
- Overall cost of living: 71.5% higher than US average
- Rent / mortgage as pct of income: rent: 34%; mortgage: 55%
- Median household income, 2022: $82,006
- Average effective tax burden: 22.79%
- Median credit card debt: $2,826
- Population, 2022: 343,437
7. Chula Vista, California

- Overall savings score: 26.6 out of 100
- Overall cost of living: 54.9% higher than US average
- Rent / mortgage as pct of income: rent: 40%; mortgage: 57%
- Median household income, 2022: $101,190
- Average effective tax burden: 20.63%
- Median credit card debt: $3,508
- Population, 2022: 279,158
6. Anaheim, California

- Overall savings score: 24.9 out of 100
- Overall cost of living: 64.9% higher than US average
- Rent / mortgage as pct of income: rent: 47%; mortgage: 70%
- Median household income, 2022: $85,133
- Average effective tax burden: 20.63%
- Median credit card debt: $2,665
- Population, 2022: 344,462
5. San Bernardino, California

- Overall savings score: 23.7 out of 100
- Overall cost of living: 18.6% higher than US average
- Rent / mortgage as pct of income: rent: 40%; mortgage: 59%
- Median household income, 2022: $62,801
- Average effective tax burden: 20.63%
- Median credit card debt: $2,500
- Population, 2022: 220,314
4. Riverside, California

- Overall savings score: 23.6 out of 100
- Overall cost of living: 31.2% higher than US average
- Rent / mortgage as pct of income: rent: 41%; mortgage: 52%
- Median household income, 2022: $81,228
- Average effective tax burden: 20.63%
- Median credit card debt: $2,998
- Population, 2022: 320,785
3. Moreno Valley, California

- Overall savings score: 21.7 out of 100
- Overall cost of living: 31.2% higher than US average
- Rent / mortgage as pct of income: rent: 49%; mortgage: 50%
- Median household income, 2022: $86,909
- Average effective tax burden: 20.63%
- Median credit card debt: $2,816
- Population, 2022: 211,915
2. Santa Ana, California

- Overall savings score: 21.1 out of 100
- Overall cost of living: 64.9% higher than US average
- Rent / mortgage as pct of income: rent: 54%; mortgage: 65%
- Median household income, 2022: $79,351
- Average effective tax burden: 20.63%
- Median credit card debt: $2,480
- Population, 2022: 308,203
1. Oxnard, California

- Overall savings score: 18.8 out of 100
- Overall cost of living: 54% higher than US average
- Rent / mortgage as pct of income: rent: 51%; mortgage: 63%
- Median household income, 2022: $84,941
- Average effective tax burden: 20.63%
- Median credit card debt: $2,684
- Population, 2022: 200,437
In 20 Years, I Haven’t Seen A Cash Back Card This Good
After two decades of reviewing financial products I haven’t seen anything like this. Credit card companies are at war, handing out free rewards and benefits to win the best customers.
A good cash back card can be worth thousands of dollars a year in free money, not to mention other perks like travel, insurance, and access to fancy lounges.
Our top pick today pays up to 5% cash back, a $200 bonus on top, and $0 annual fee. Click here to apply before they stop offering rewards this generous.
Flywheel Publishing has partnered with CardRatings for our coverage of credit card products. Flywheel Publishing and CardRatings may receive a commission from card issuers.
Thank you for reading! Have some feedback for us?
Contact the 24/7 Wall St. editorial team.


