
24/7 Wall St. Insights
- It’s suggested that, to maintain a similar quality-of-life, you should have at least 10 times your income saved up by retirement age.
- The best counties to retire in each state range from small rural townships to large urban or suburban areas, providing a wide spread where you can identify the best fit for you.
- Also: 2 Dividend Legends to Hold Forever
In April 2024, the U.S. Labor Department attempted to implement a fiduciary rule around the advice given to clients by financial advisors, especially when talking about retirement savings. Prior to this rule, financial advisors had to follow a “suitability” standard. This essentially means that the advice given to clients had to be suitable, but didn’t have to be the best fit for the clients. Usually, this means that the move was better for the financial advisors for making commission. However, two federal courts in Texas chose to block the rule, which means that people looking to save for retirement or roll over their 401K may struggle to receive the fair treatment they deserve. (This new survey reveals what it takes to be happy in retirement.)
Many factors go into planning for retirement. The first factor is how much you can save so that your retirement funds can grow. Financial leaders often suggest having 10-12x your income saved by age 67. As time moves on, you also must consider elements such as familial obligations, health, job satisfaction, and what town or city is the best fit for you. Again, this brings up new considerations: easy access to physical activities, healthcare accessibility, public transportation. For some, it might include a new place to call home — one that offers important amenities like easy access to physical activities and doctors. (Affordability is important too, and Hawaii is the most expensive state to retire in.)
To determine the best places to retire in every state, 24/7 Wall St. developed an index of 11 different measures related to the health and well-being of people ages 65 years and over using data from County Health Rankings and Roadmaps. The measure included air quality, access to and quality of local health care, population makeup and change, leisure activity options, and more. U.S. county or county equivalents were ranked based on the index, and the best in each state are listed here.
Why This Matters

24/7 Wall St. wants you to better understand your personal wealth and what factors might affect it. Every dollar counts when you’re budgeting for retirement. We’re covering the best places to retire in each state to help you understand if changing locations will be beneficial to you when you retire. Or, if you have already retired, this information can help you decide whether a move to a different county is in the cards.
Scroll below to see the best county to retire in your state:
Alabama: Baldwin County
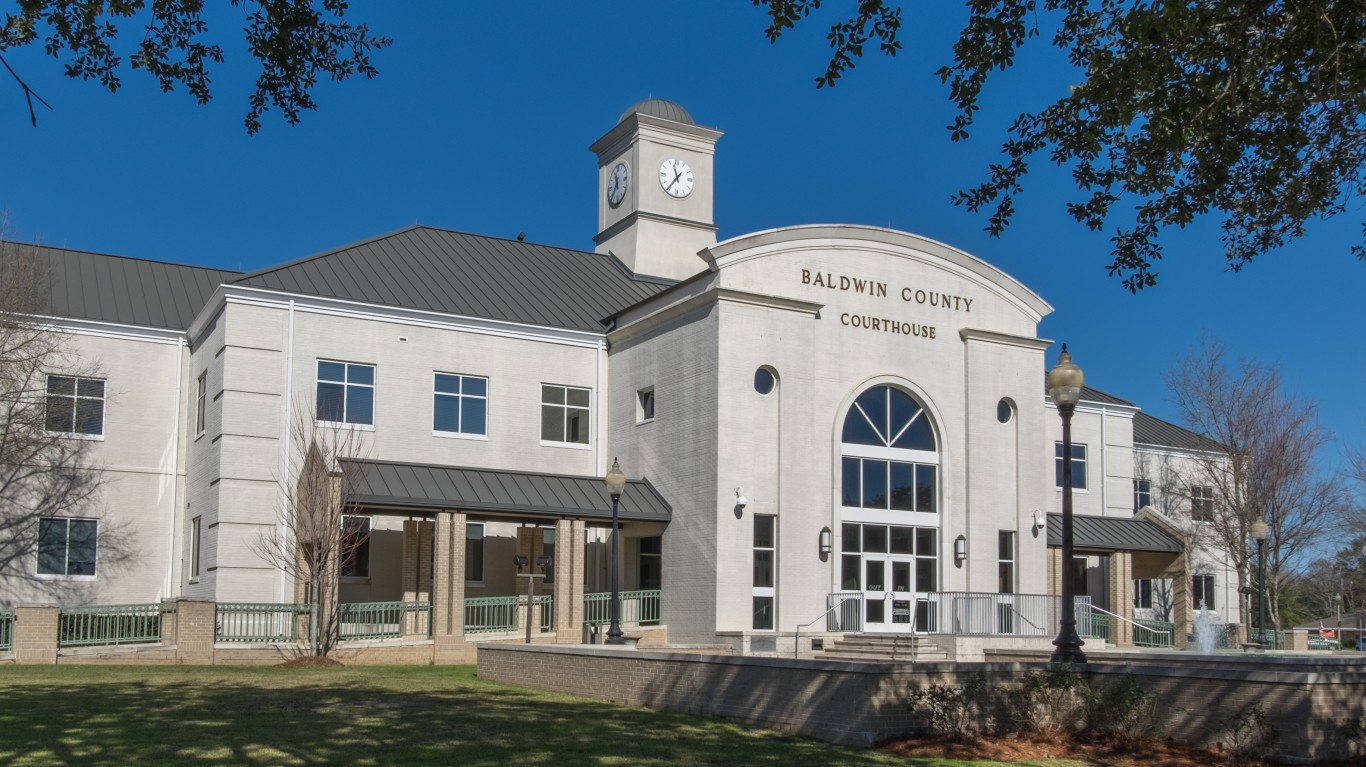
- Residents who are 65 and over: 20.6% (state: 16.9%)
- Life expectancy: 77.7 years (state: 74.8 years)
- Pop. w/ access to physical activity locations: 65.7% (state: 60.9%)
- Amount of primary care physicians: 62.7 per 100,000 (state: 64.2 per 100,000)
Alaska: Haines Borough

- Residents who are 65 and over: 20.9% (state: 12.3%)
- Life expectancy: 84.4 years (state: 78.6 years)
- Pop. w/ access to physical activity locations: 96.8% (state: 75.7%)
- Amount of primary care physicians: 289.7 per 100,000 (state: 97.3 per 100,000)
Arizona: Yavapai County

- Residents who are 65 and over: 31.9% (state: 17.6%)
- Life expectancy: 78.4 years (state: 79.1 years)
- Pop. w/ access to physical activity locations: 85.0% (state: 86.2%)
- Amount of primary care physicians: 57.4 per 100,000 (state: 66.9 per 100,000)
Arkansas: Montgomery County
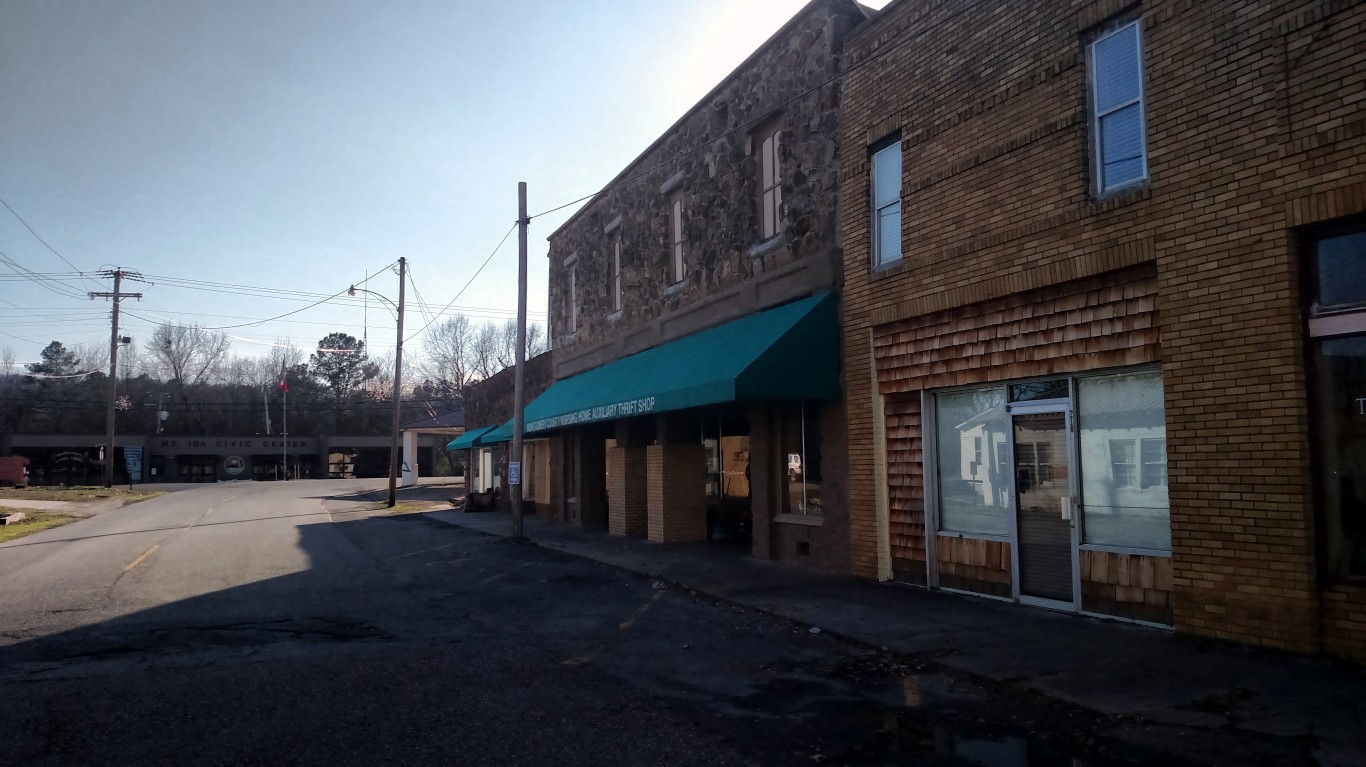
- Residents who are 65 and over: 26.8% (state: 16.8%)
- Life expectancy: 75.1 years (state: 75.5 years)
- Pop. w/ access to physical activity locations: 97.2% (state: 63.0%)
- Amount of primary care physicians: 23.2 per 100,000 (state: 68.1 per 100,000)
California: Marin County

- Residents who are 65 and over: 22.4% (state: 14.4%)
- Life expectancy: 85.2 years (state: 81.0 years)
- Pop. w/ access to physical activity locations: 97.5% (state: 94.6%)
- Amount of primary care physicians: 144.9 per 100,000 (state: 81.3 per 100,000)
Colorado: Pitkin County

- Residents who are 65 and over: 19.3% (state: 14.3%)
- Life expectancy: 92.5 years (state: 80.0 years)
- Pop. w/ access to physical activity locations: 94.6% (state: 90.4%)
- Amount of primary care physicians: 86.5 per 100,000 (state: 83.0 per 100,000)
Connecticut: Middlesex County

- Residents who are 65 and over: 20.5% (state: 17.2%)
- Life expectancy: 80.8 years (state: 80.1 years)
- Pop. w/ access to physical activity locations: 97.3% (state: 93.5%)
- Amount of primary care physicians: 78.3 per 100,000 (state: 84.4 per 100,000)
Delaware: Sussex County
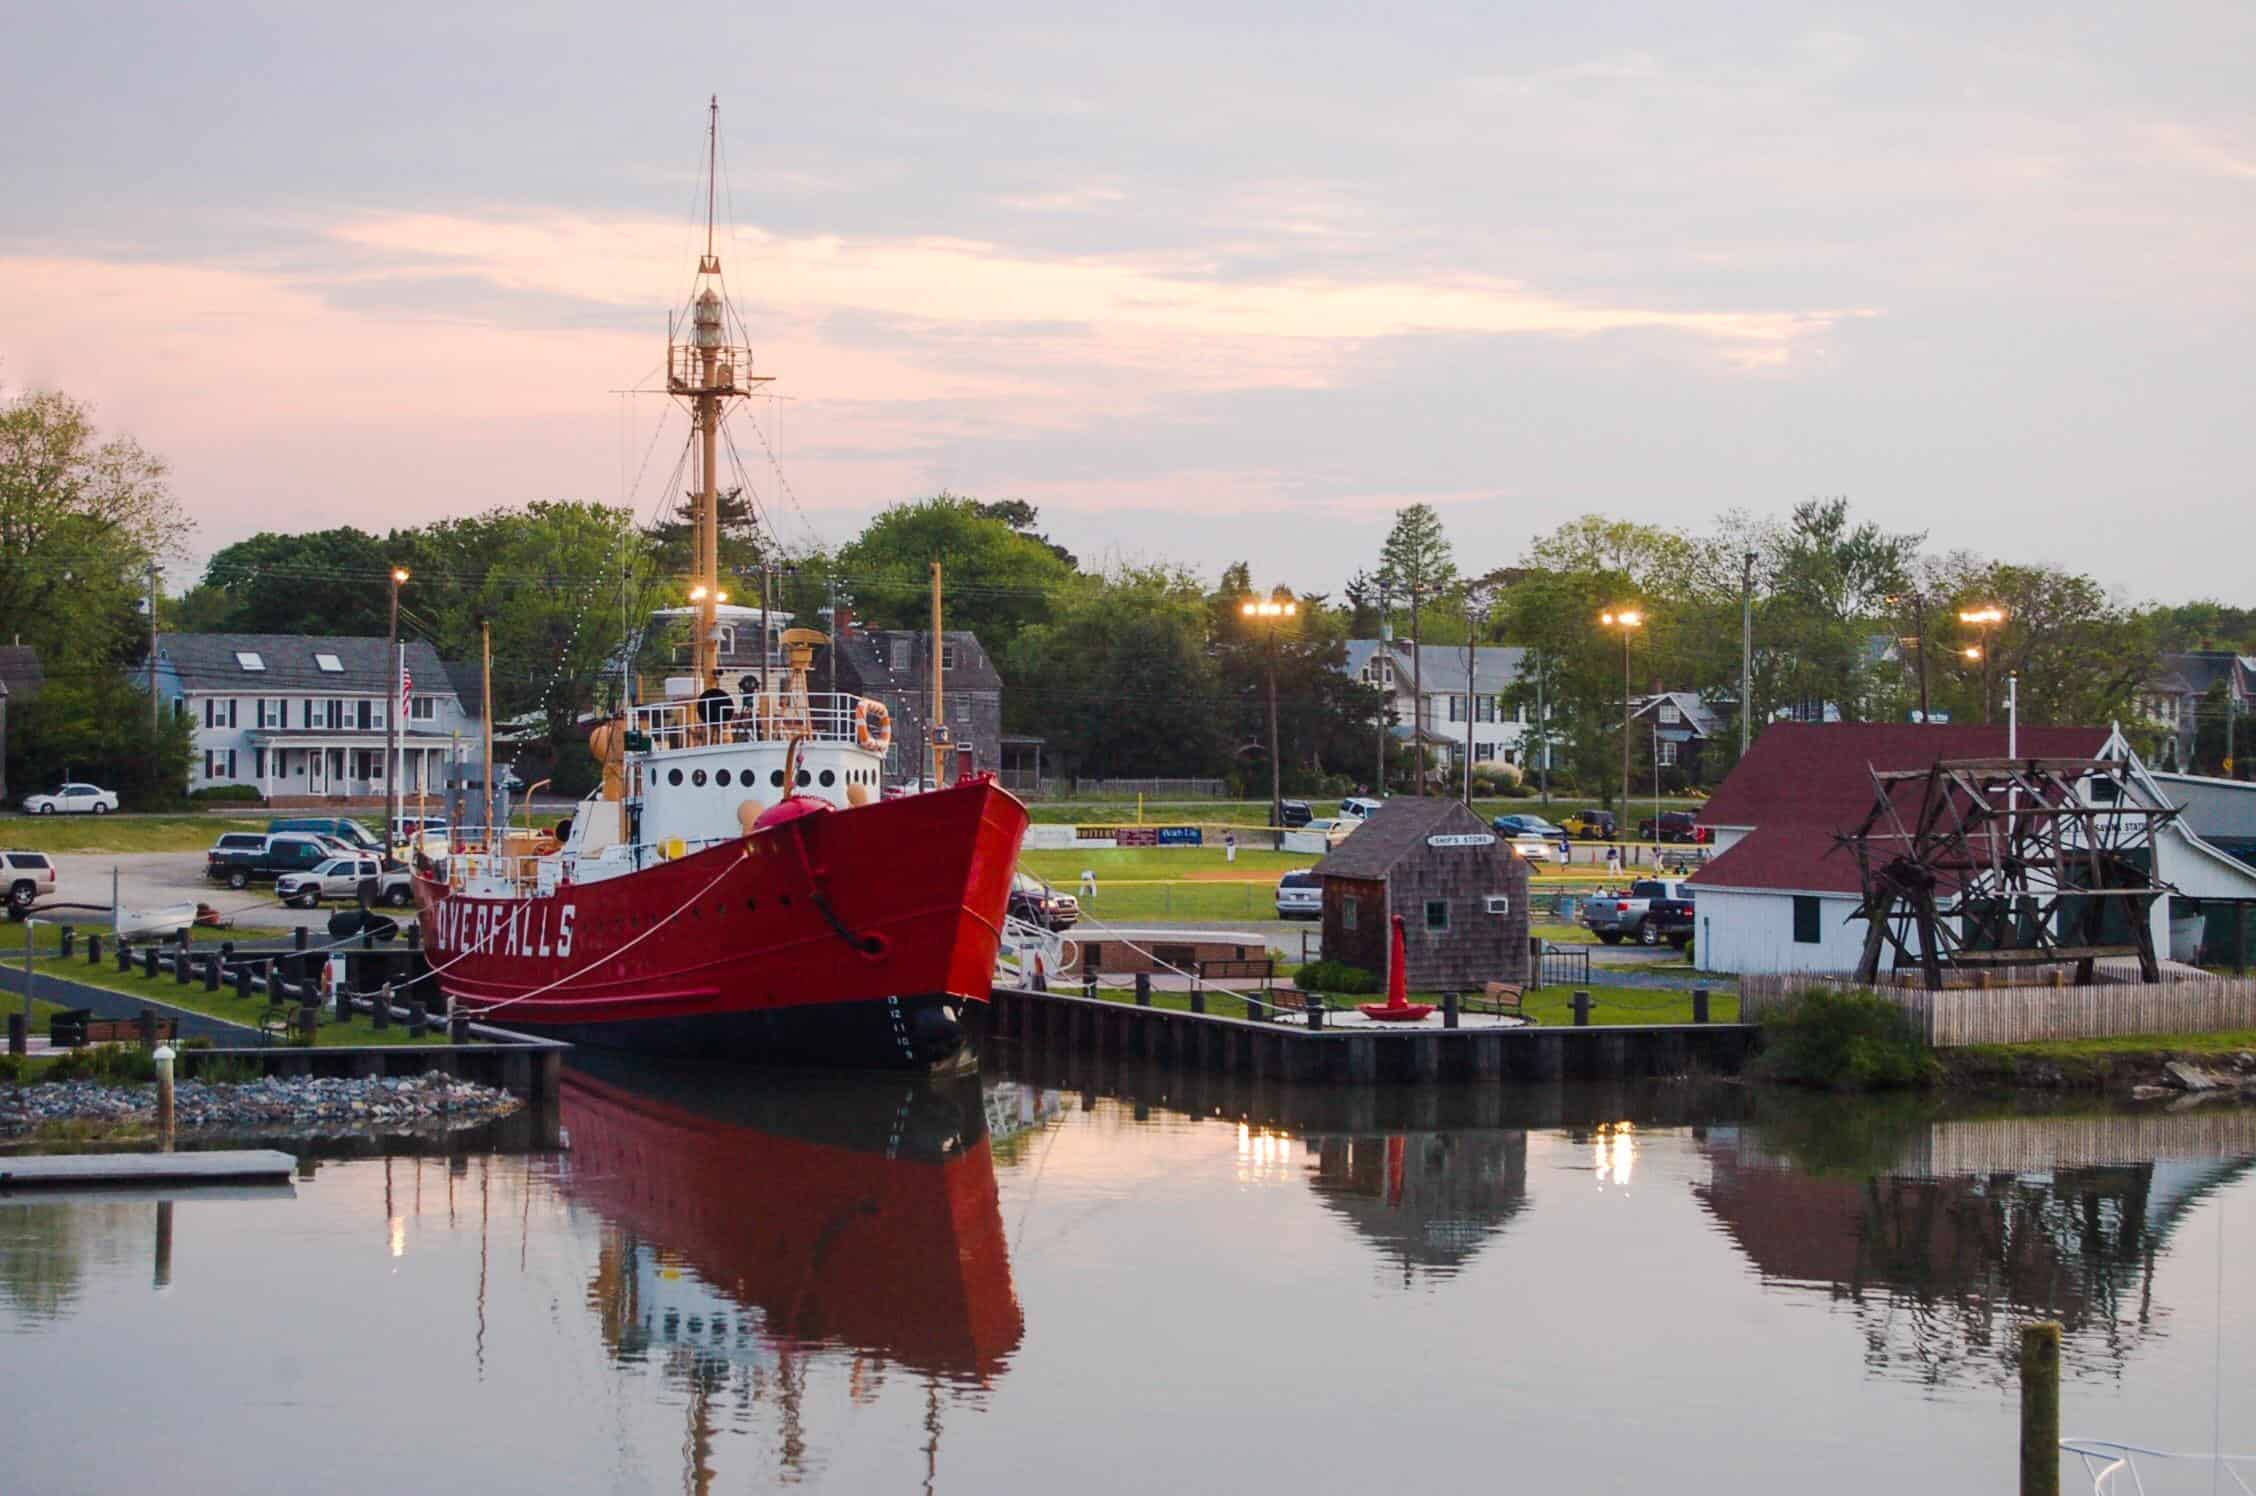
- Residents who are 65 and over: 28.3% (state: 19.0%)
- Life expectancy: 78.4 years (state: 78.0 years)
- Pop. w/ access to physical activity locations: 65.0% (state: 81.3%)
- Amount of primary care physicians: 57.8 per 100,000 (state: 73.9 per 100,000)
Florida: Sumter County

- Residents who are 65 and over: 57.6% (state: 20.4%)
- Life expectancy: 80.2 years (state: 79.7 years)
- Pop. w/ access to physical activity locations: 88.8% (state: 88.2%)
- Amount of primary care physicians: 39.8 per 100,000 (state: 72.5 per 100,000)
Georgia: Towns County
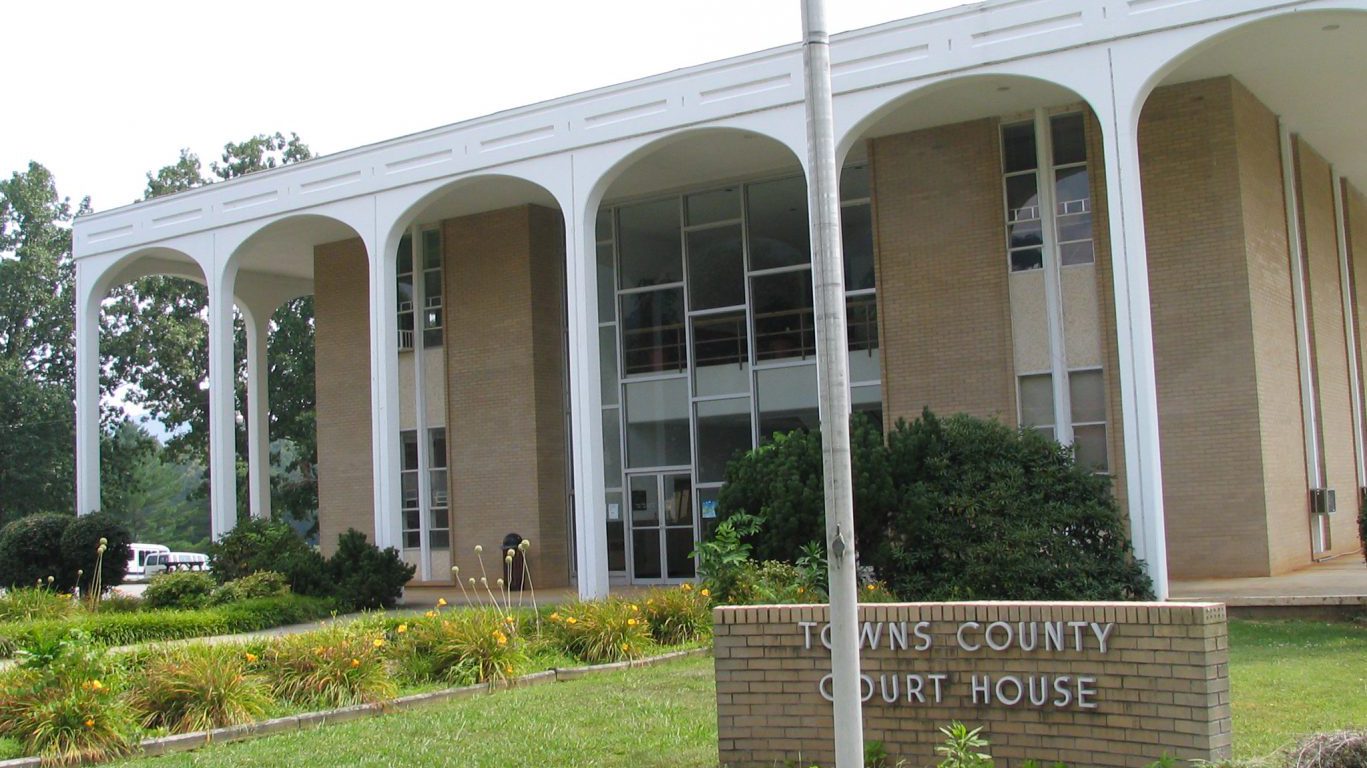
- Residents who are 65 and over: 33.7% (state: 13.9%)
- Life expectancy: 79.0 years (state: 77.3 years)
- Pop. w/ access to physical activity locations: 100.0% (state: 74.6%)
- Amount of primary care physicians: 54.4 per 100,000 (state: 66.5 per 100,000)
Hawaii: Kauai County

- Residents who are 65 and over: 20.3% (state: 18.5%)
- Life expectancy: 82.3 years (state: 82.3 years)
- Pop. w/ access to physical activity locations: 91.8% (state: 93.7%)
- Amount of primary care physicians: 81.7 per 100,000 (state: 90.5 per 100,000)
Idaho: Blaine County

- Residents who are 65 and over: 19.1% (state: 15.8%)
- Life expectancy: 85.2 years (state: 79.2 years)
- Pop. w/ access to physical activity locations: 74.5% (state: 74.7%)
- Amount of primary care physicians: 88.8 per 100,000 (state: 61.7 per 100,000)
Illinois: Monroe County
- Residents who are 65 and over: 17.7% (state: 15.7%)
- Life expectancy: 80.7 years (state: 78.6 years)
- Pop. w/ access to physical activity locations: 85.6% (state: 90.4%)
- Amount of primary care physicians: 37.2 per 100,000 (state: 80.6 per 100,000)
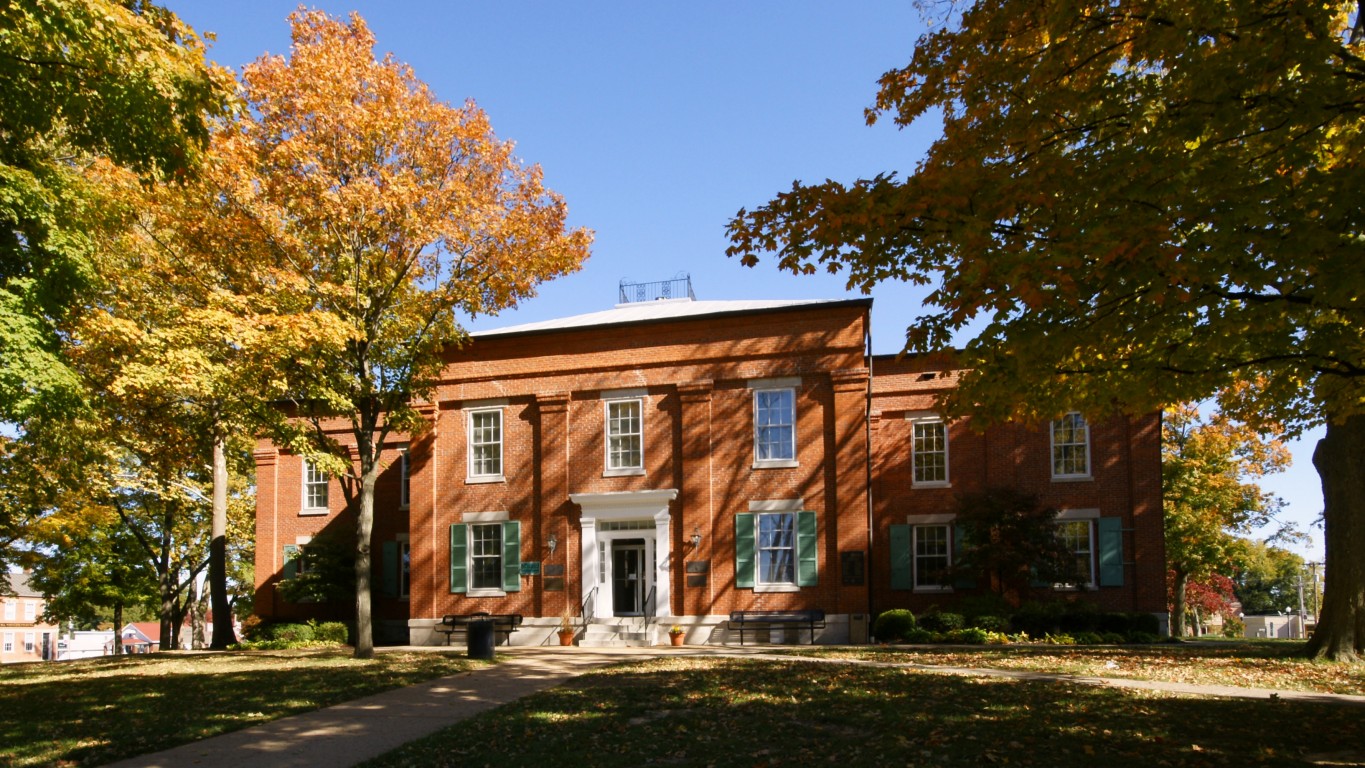
Indiana: Dubois County

- Residents who are 65 and over: 17.3% (state: 15.7%)
- Life expectancy: 79.2 years (state: 76.5 years)
- Pop. w/ access to physical activity locations: 75.5% (state: 76.8%)
- Amount of primary care physicians: 78.1 per 100,000 (state: 66.1 per 100,000)
Iowa: Dickinson County
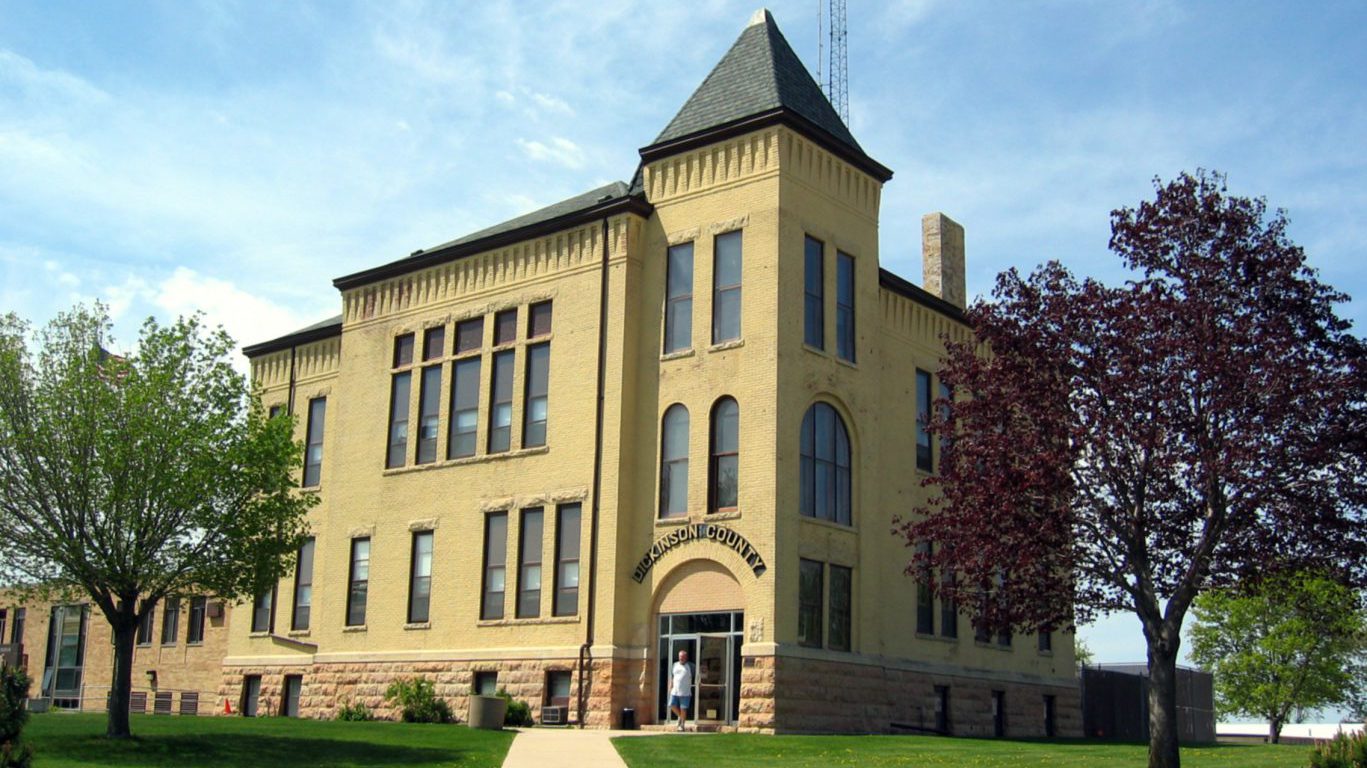
- Residents who are 65 and over: 25.9% (state: 17.0%)
- Life expectancy: 80.7 years (state: 78.7 years)
- Pop. w/ access to physical activity locations: 84.2% (state: 79.3%)
- Amount of primary care physicians: 72.8 per 100,000 (state: 73.0 per 100,000)
Kansas: Gove County

- Residents who are 65 and over: 24.8% (state: 15.8%)
- Life expectancy: 80.2 years (state: 77.8 years)
- Pop. w/ access to physical activity locations: 42.9% (state: 79.7%)
- Amount of primary care physicians: 217.8 per 100,000 (state: 78.8 per 100,000)
Kentucky: Woodford County
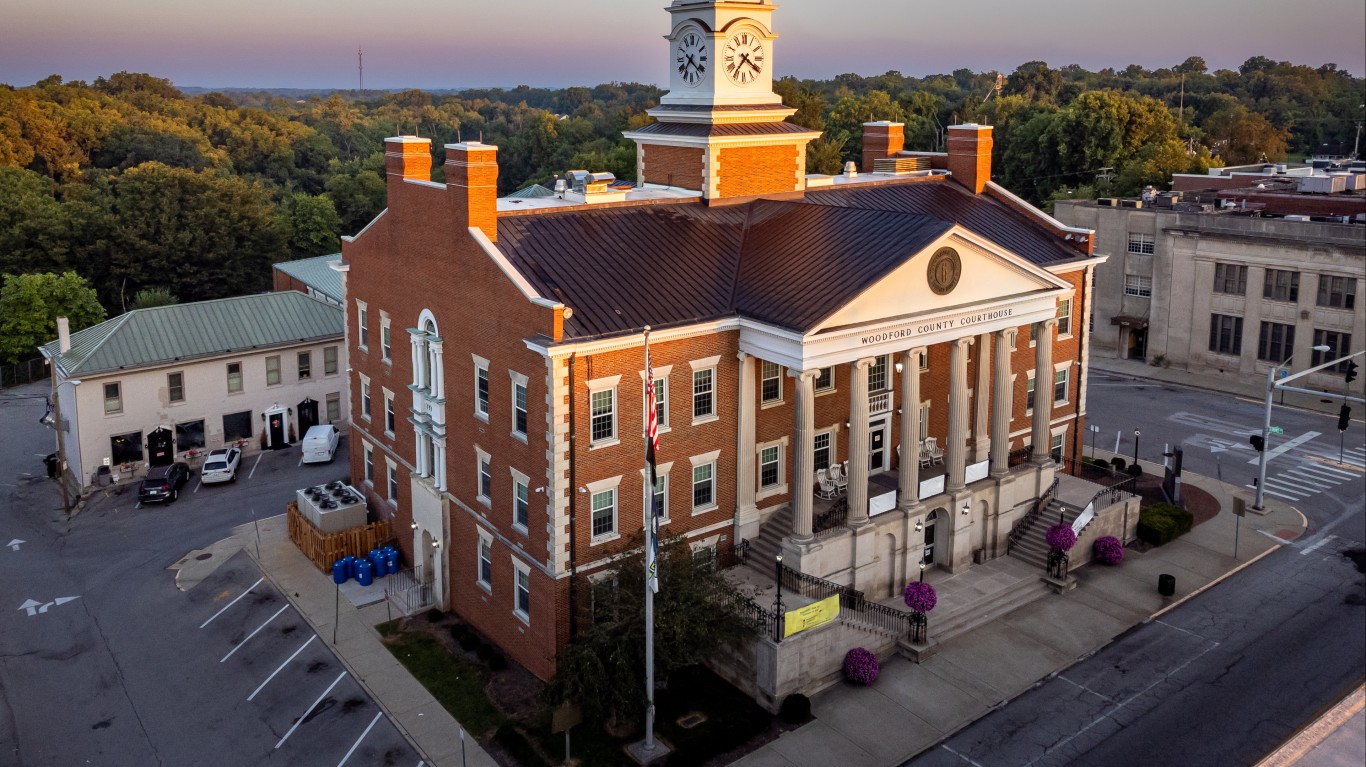
- Residents who are 65 and over: 18.5% (state: 16.4%)
- Life expectancy: 77.6 years (state: 75.1 years)
- Pop. w/ access to physical activity locations: 83.0% (state: 69.9%)
- Amount of primary care physicians: 66.5 per 100,000 (state: 64.0 per 100,000)
Louisiana: Jefferson Parish
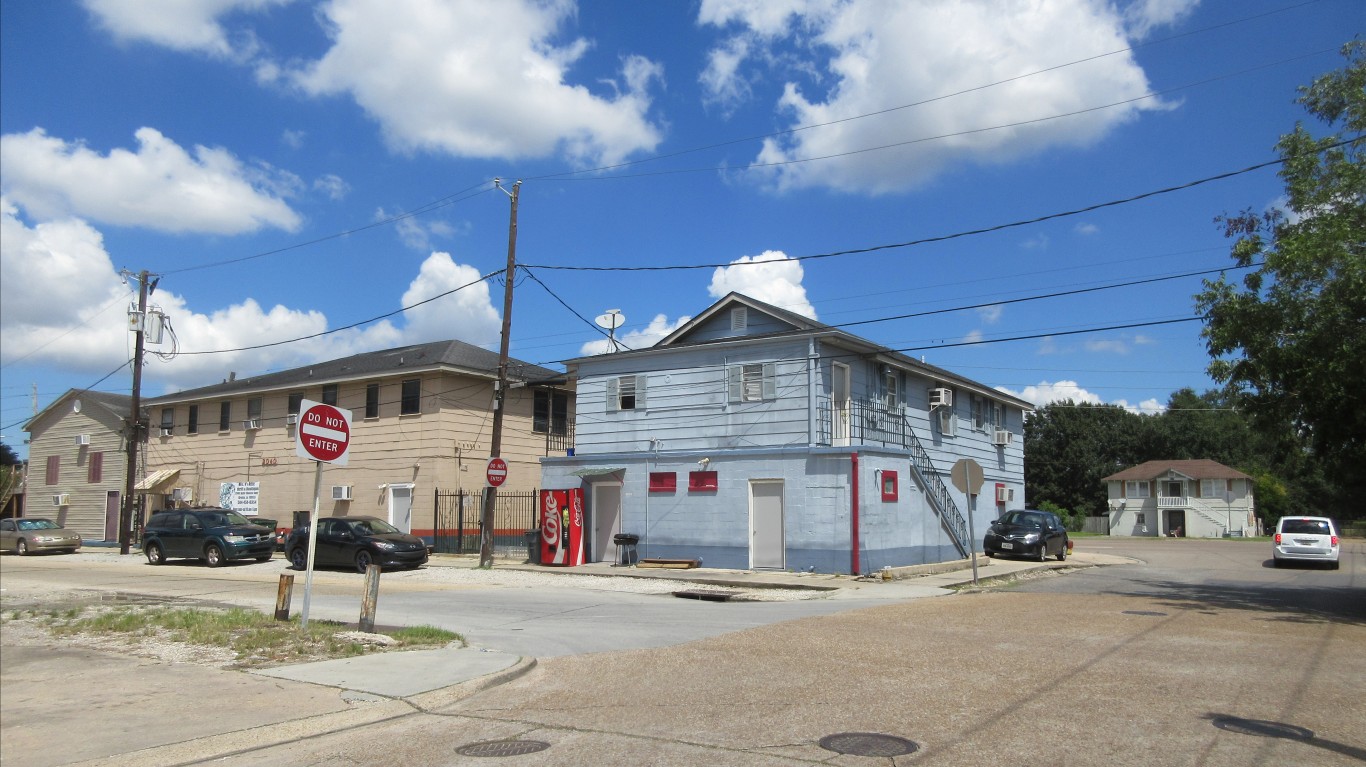
- Residents who are 65 and over: 17.3% (state: 15.5%)
- Life expectancy: 76.7 years (state: 75.2 years)
- Pop. w/ access to physical activity locations: 96.3% (state: 75.8%)
- Amount of primary care physicians: 97.8 per 100,000 (state: 70.4 per 100,000)
- County seat: Gretna
Maine: Hancock County

- Residents who are 65 and over: 25.1% (state: 20.7%)
- Life expectancy: 79.5 years (state: 78.6 years)
- Pop. w/ access to physical activity locations: 66.4% (state: 65.7%)
- Amount of primary care physicians: 115.7 per 100,000 (state: 109.3 per 100,000)
Maryland: Talbot County

- Residents who are 65 and over: 29.1% (state: 15.4%)
- Life expectancy: 79.3 years (state: 78.6 years)
- Pop. w/ access to physical activity locations: 71.6% (state: 92.1%)
- Amount of primary care physicians: 103.7 per 100,000 (state: 86.7 per 100,000)
Massachusetts: Dukes County
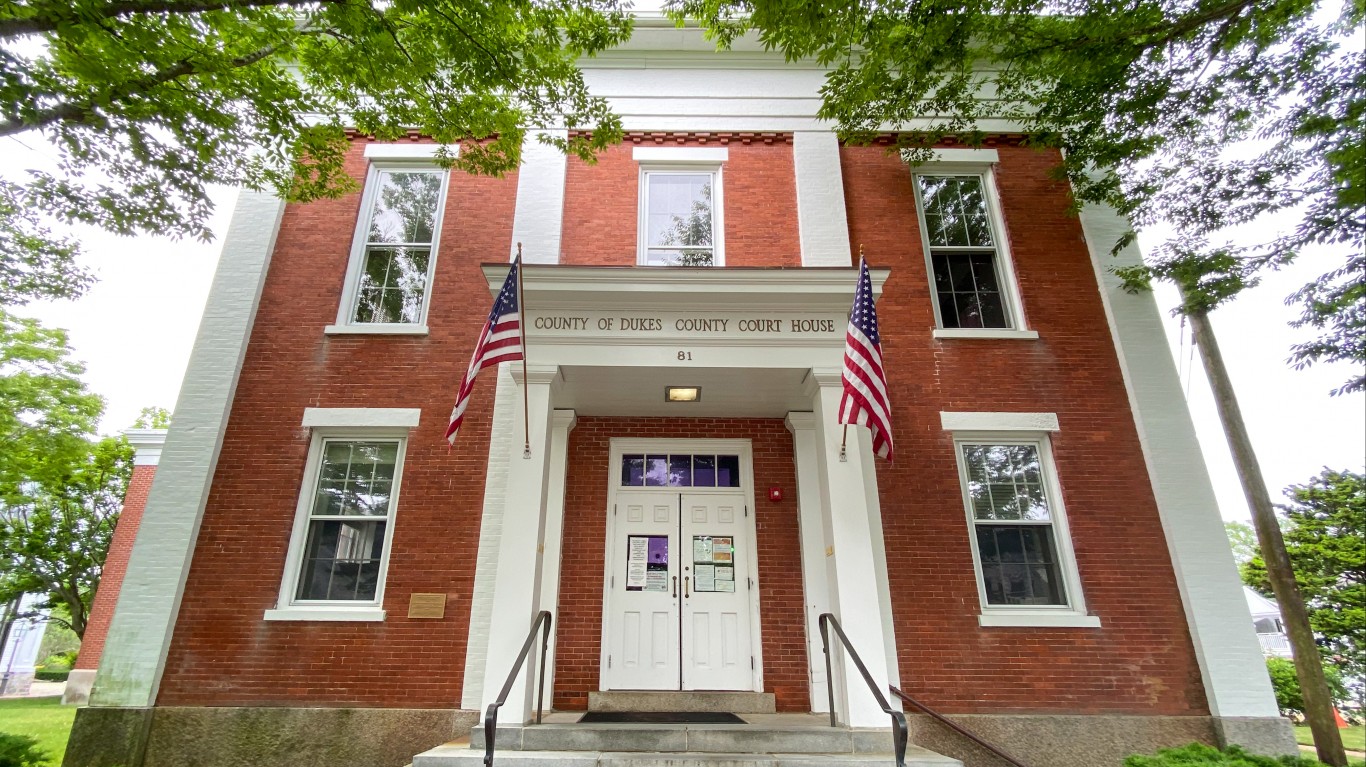
- Residents who are 65 and over: 24.0% (state: 16.5%)
- Life expectancy: 81.3 years (state: 80.2 years)
- Pop. w/ access to physical activity locations: 96.7% (state: 94.7%)
- Amount of primary care physicians: 66.4 per 100,000 (state: 102.2 per 100,000)
Michigan: Emmet County

- Residents who are 65 and over: 22.5% (state: 17.2%)
- Life expectancy: 79.3 years (state: 77.5 years)
- Pop. w/ access to physical activity locations: 82.4% (state: 85.2%)
- Amount of primary care physicians: 119.8 per 100,000 (state: 80.3 per 100,000)
Minnesota: Cook County

- Residents who are 65 and over: 28.5% (state: 15.9%)
- Life expectancy: 82.5 years (state: 80.4 years)
- Pop. w/ access to physical activity locations: 83.8% (state: 86.0%)
- Amount of primary care physicians: 142.4 per 100,000 (state: 89.3 per 100,000)
Mississippi: Franklin County
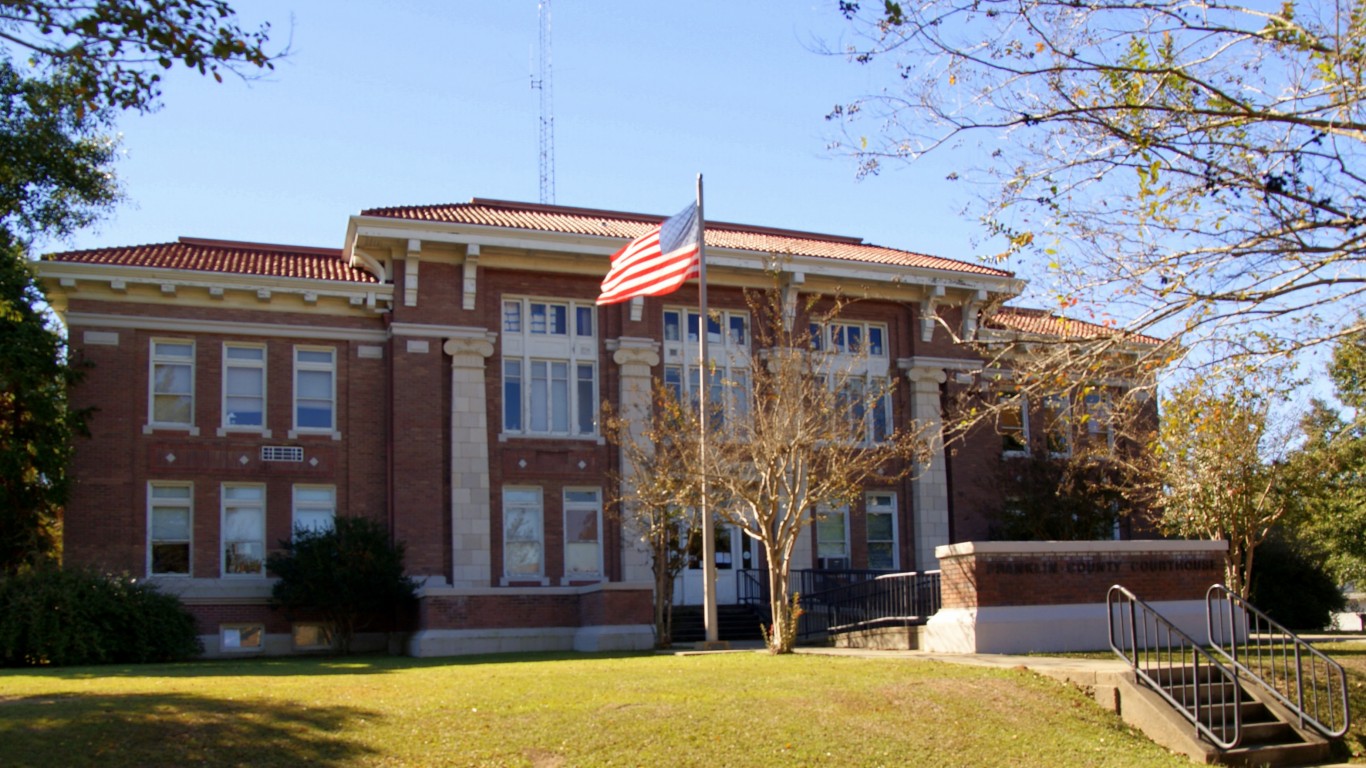
- Residents who are 65 and over: 20.1% (state: 15.9%)
- Life expectancy: 74.4 years (state: 73.9 years)
- Pop. w/ access to physical activity locations: 70.1% (state: 57.5%)
- Amount of primary care physicians: 26.1 per 100,000 (state: 54.1 per 100,000)
Missouri: St. Louis County

- Residents who are 65 and over: 18.0% (state: 16.8%)
- Life expectancy: 77.2 years (state: 76.6 years)
- Pop. w/ access to physical activity locations: 95.4% (state: 75.8%)
- Amount of primary care physicians: 126.5 per 100,000 (state: 70.8 per 100,000)
Montana: Park County
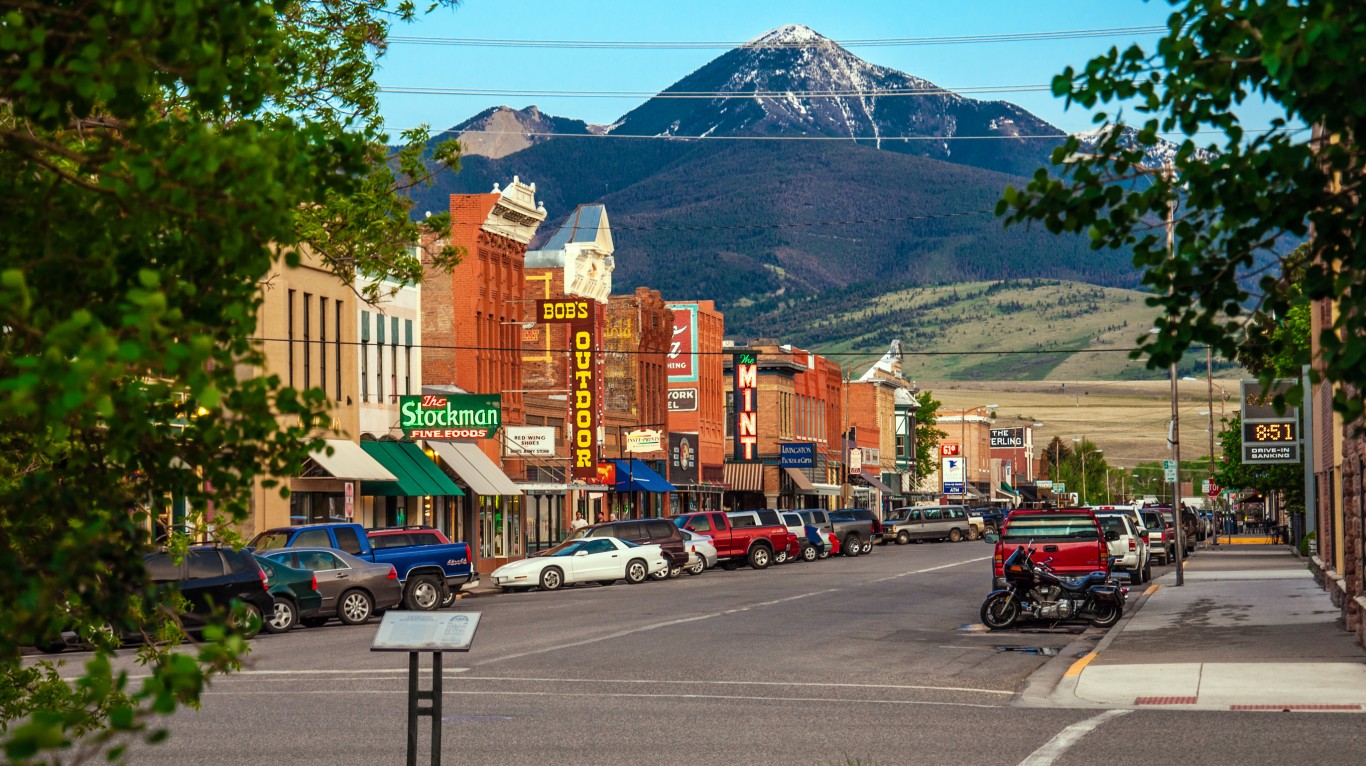
- Residents who are 65 and over: 23.0% (state: 18.8%)
- Life expectancy: 79.9 years (state: 78.4 years)
- Pop. w/ access to physical activity locations: 75.4% (state: 72.8%)
- Amount of primary care physicians: 114.5 per 100,000 (state: 80.9 per 100,000)
Nebraska: Brown County

- Residents who are 65 and over: 28.1% (state: 15.7%)
- Life expectancy: 79.1 years (state: 79.0 years)
- Pop. w/ access to physical activity locations: 79.6% (state: 83.1%)
- Amount of primary care physicians: 103.2 per 100,000 (state: 75.8 per 100,000)
Nevada: Douglas County

- Residents who are 65 and over: 29.0% (state: 15.8%)
- Life expectancy: 81.1 years (state: 78.1 years)
- Pop. w/ access to physical activity locations: 80.9% (state: 91.5%)
- Amount of primary care physicians: 52.1 per 100,000 (state: 58.8 per 100,000)
New Hampshire: Grafton County
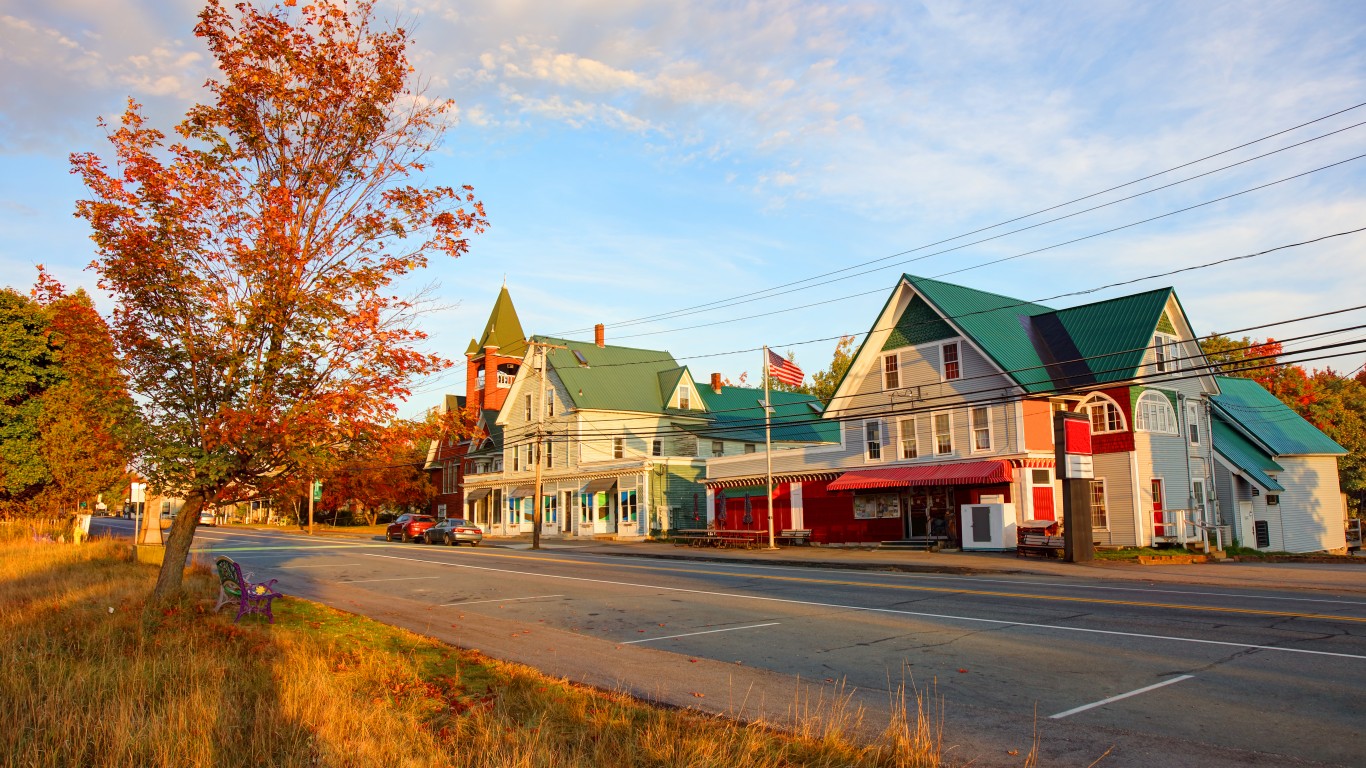
- Residents who are 65 and over: 20.8% (state: 18.2%)
- Life expectancy: 80.7 years (state: 79.6 years)
- Pop. w/ access to physical activity locations: 84.9% (state: 84.2%)
- Amount of primary care physicians: 187.6 per 100,000 (state: 88.0 per 100,000)
New Jersey: Morris County
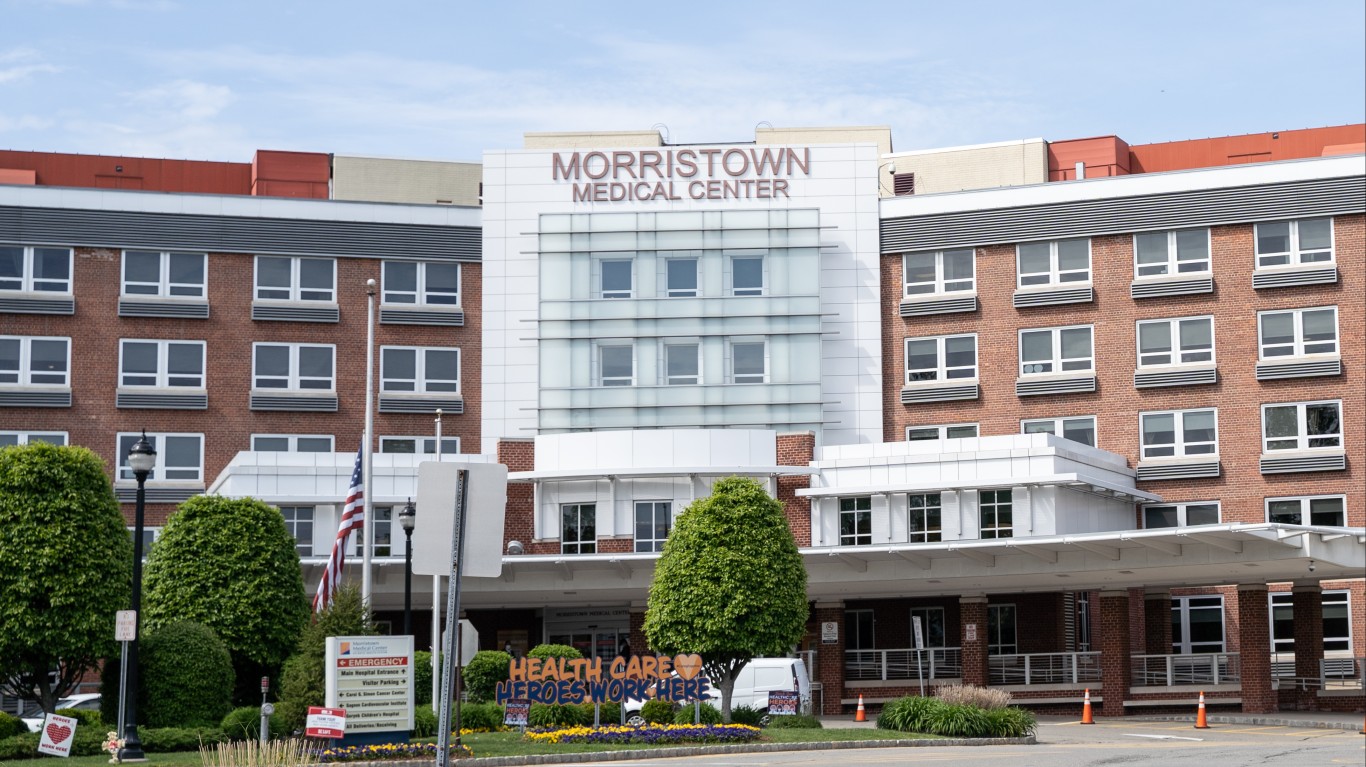
- Residents who are 65 and over: 17.0% (state: 16.2%)
- Life expectancy: 81.8 years (state: 79.5 years)
- Pop. w/ access to physical activity locations: 98.5% (state: 96.1%)
- Amount of primary care physicians: 97.1 per 100,000 (state: 81.2 per 100,000)
New Mexico: Los Alamos County
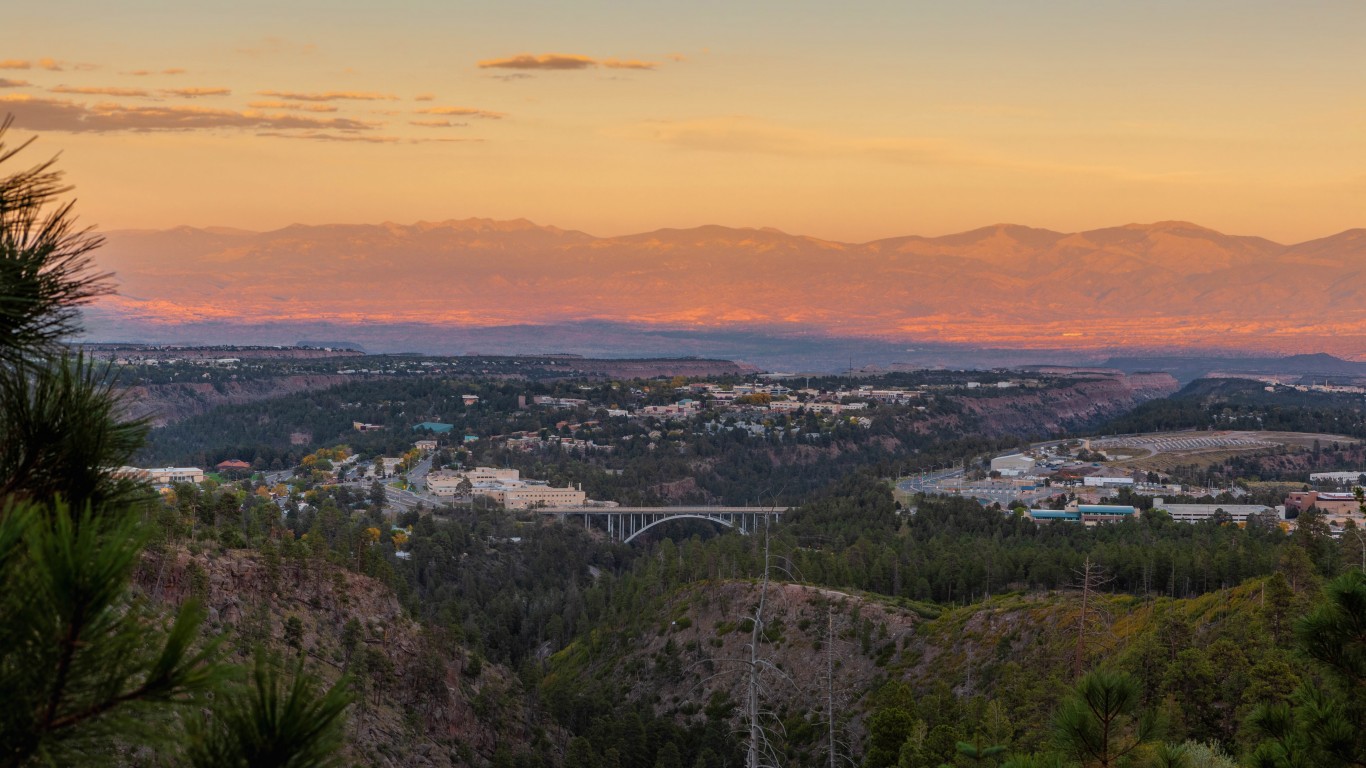
- Residents who are 65 and over: 17.4% (state: 17.5%)
- Life expectancy: 83.9 years (state: 76.9 years)
- Pop. w/ access to physical activity locations: 99.3% (state: 74.3%)
- Amount of primary care physicians: 150.0 per 100,000 (state: 74.9 per 100,000)
New York: New York County

- Residents who are 65 and over: 16.8% (state: 16.6%)
- Life expectancy: 83.7 years (state: 80.3 years)
- Pop. w/ access to physical activity locations: 100.0% (state: 93.2%)
- Amount of primary care physicians: 142.2 per 100,000 (state: 83.1 per 100,000)
- County seat: Manhattan
North Carolina: Transylvania County
- Residents who are 65 and over: 30.1% (state: 16.3%)
- Life expectancy: 81.0 years (state: 77.7 years)
- Pop. w/ access to physical activity locations: 85.0% (state: 74.5%)
- Amount of primary care physicians: 72.4 per 100,000 (state: 71.1 per 100,000)
North Dakota: Mercer County

- Residents who are 65 and over: 20.0% (state: 15.3%)
- Life expectancy: 81.9 years (state: 78.8 years)
- Pop. w/ access to physical activity locations: 79.1% (state: 72.5%)
- Amount of primary care physicians: 84.1 per 100,000 (state: 76.8 per 100,000)
Ohio: Medina County
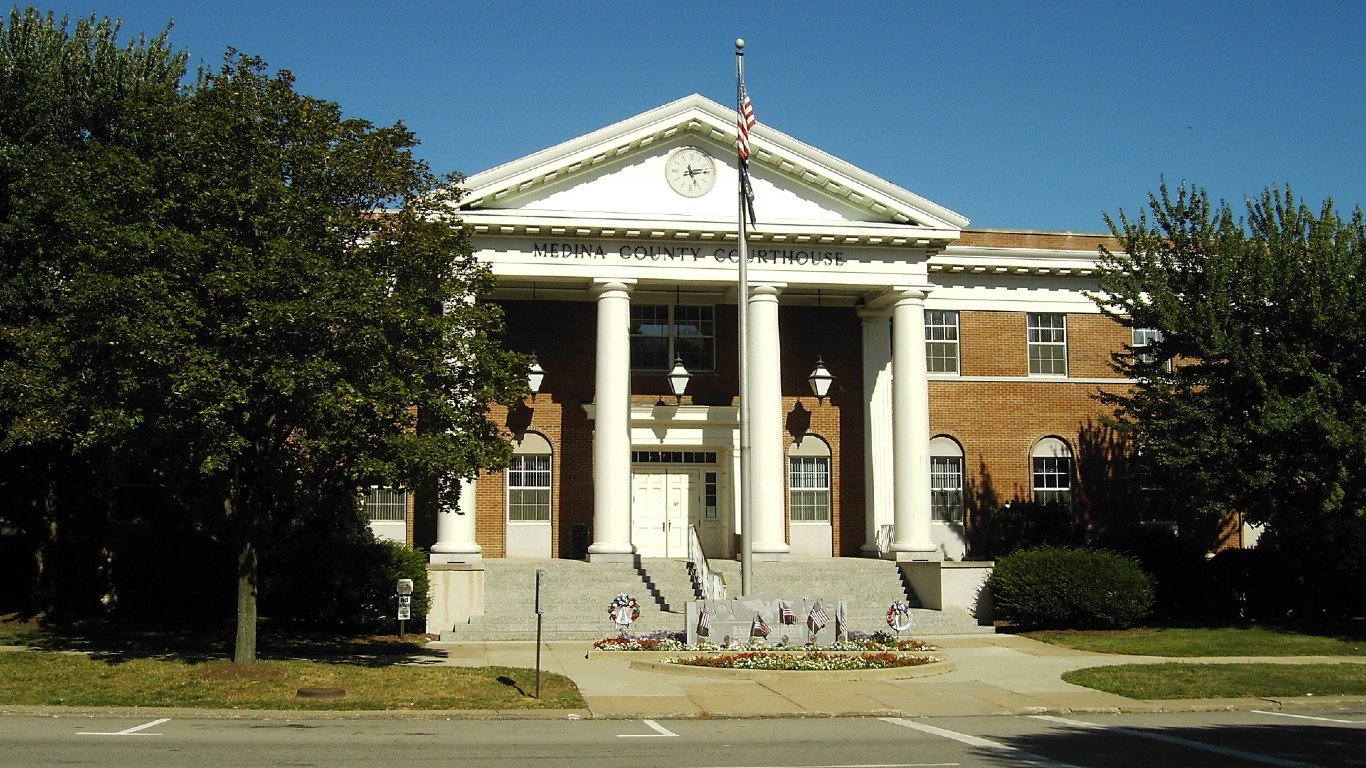
- Residents who are 65 and over: 18.0% (state: 17.0%)
- Life expectancy: 79.9 years (state: 76.5 years)
- Pop. w/ access to physical activity locations: 92.7% (state: 83.8%)
- Amount of primary care physicians: 62.8 per 100,000 (state: 76.8 per 100,000)
Oklahoma: Ellis County

- Residents who are 65 and over: 23.2% (state: 15.6%)
- Life expectancy: 76.2 years (state: 75.5 years)
- Pop. w/ access to physical activity locations: 37.1% (state: 71.3%)
- Amount of primary care physicians: 53.2 per 100,000 (state: 60.4 per 100,000)
Oregon: Wallowa County

- Residents who are 65 and over: 29.3% (state: 17.7%)
- Life expectancy: 82.0 years (state: 79.7 years)
- Pop. w/ access to physical activity locations: 58.5% (state: 87.9%)
- Amount of primary care physicians: 145.8 per 100,000 (state: 94.1 per 100,000)
Pennsylvania: Montgomery County

- Residents who are 65 and over: 17.7% (state: 18.2%)
- Life expectancy: 80.5 years (state: 78.0 years)
- Pop. w/ access to physical activity locations: 96.4% (state: 85.8%)
- Amount of primary care physicians: 132.8 per 100,000 (state: 81.1 per 100,000)
Rhode Island: Bristol County

- Residents who are 65 and over: 19.7% (state: 17.3%)
- Life expectancy: 81.2 years (state: 79.4 years)
- Pop. w/ access to physical activity locations: 99.5% (state: 95.5%)
- Amount of primary care physicians: 192.8 per 100,000 (state: 97.2 per 100,000)
South Carolina: Beaufort County

- Residents who are 65 and over: 27.4% (state: 17.7%)
- Life expectancy: 82.6 years (state: 76.4 years)
- Pop. w/ access to physical activity locations: 86.0% (state: 70.3%)
- Amount of primary care physicians: 71.4 per 100,000 (state: 67.9 per 100,000)
South Dakota: Fall River County
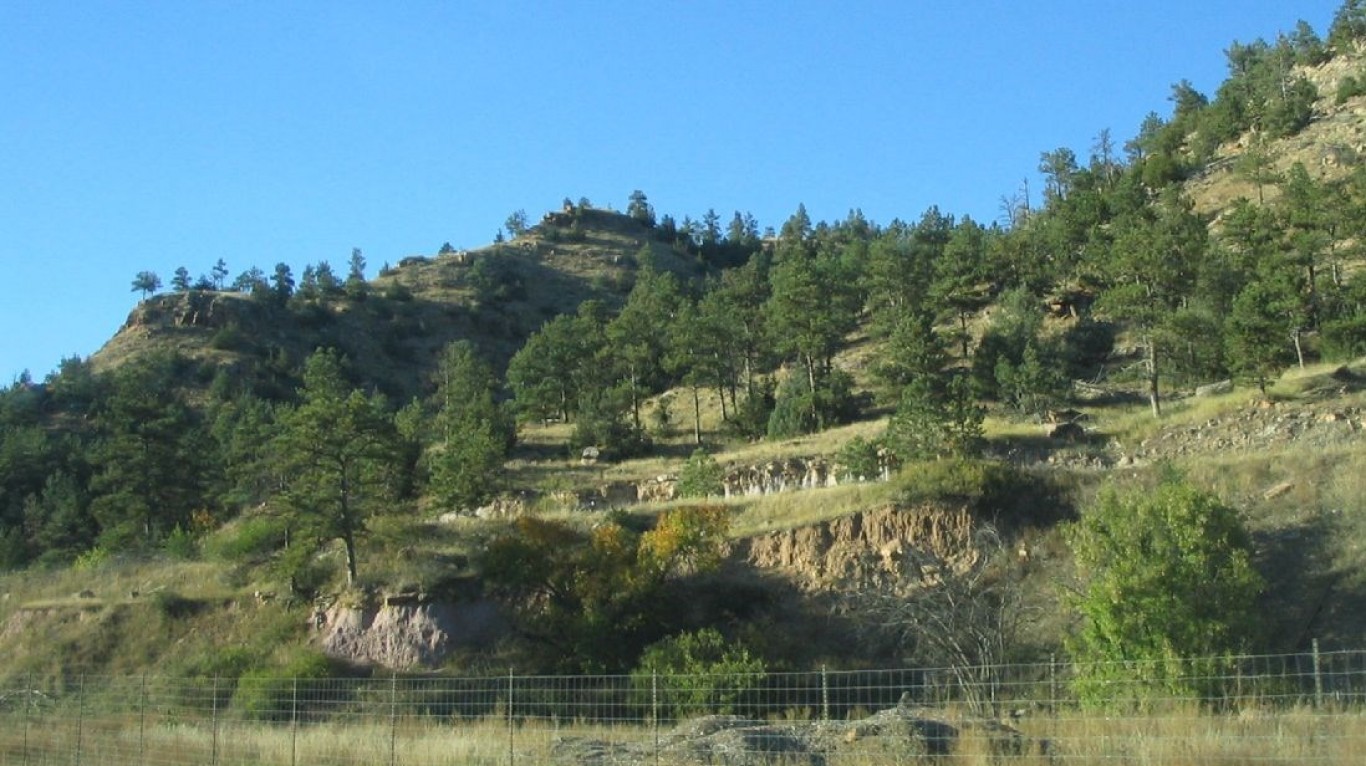
- Residents who are 65 and over: 29.9% (state: 16.6%)
- Life expectancy: 74.7 years (state: 78.2 years)
- Pop. w/ access to physical activity locations: 86.4% (state: 70.6%)
- Amount of primary care physicians: 69.4 per 100,000 (state: 80.2 per 100,000)
Tennessee: Johnson County

- Residents who are 65 and over: 22.8% (state: 16.3%)
- Life expectancy: 74.0 years (state: 75.3 years)
- Pop. w/ access to physical activity locations: 100.0% (state: 67.6%)
- Amount of primary care physicians: 33.0 per 100,000 (state: 70.4 per 100,000)
Texas: Jeff Davis County
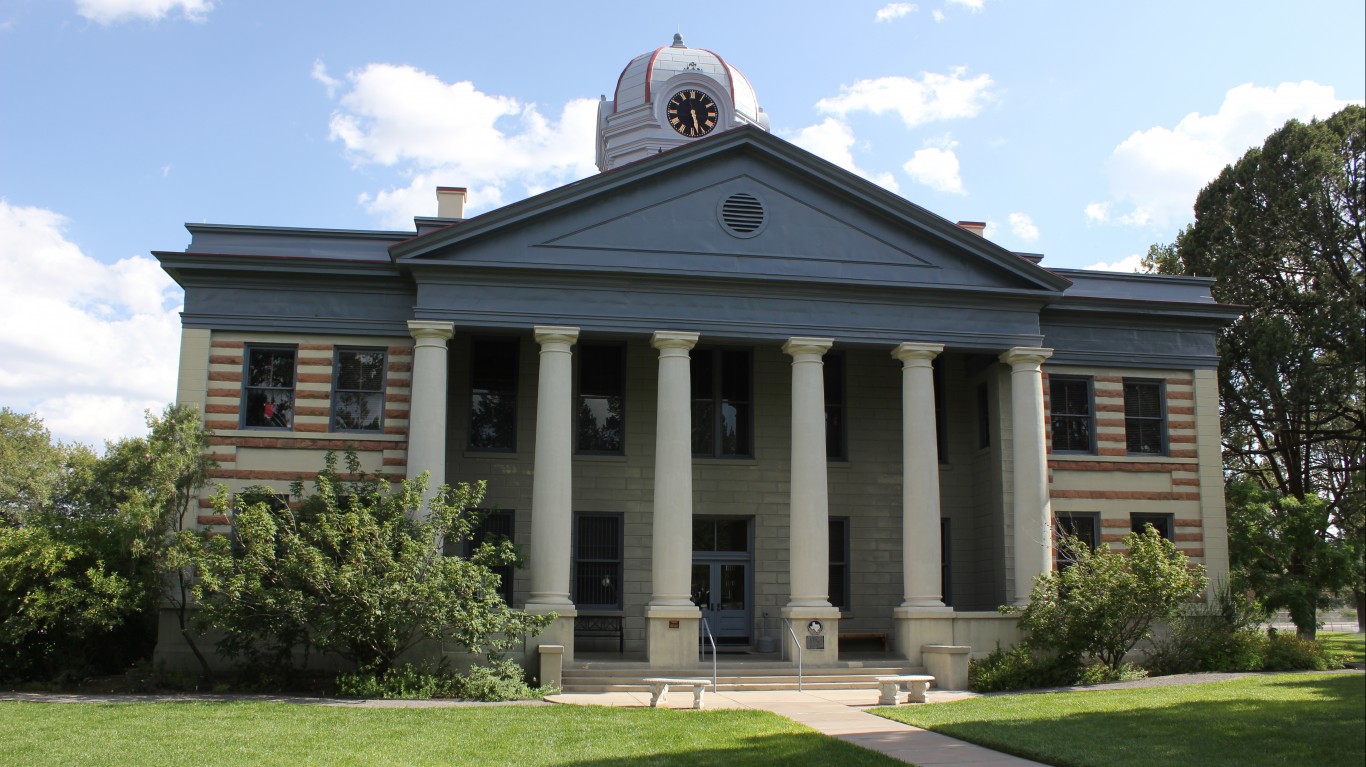
- Residents who are 65 and over: 36.9% (state: 12.5%)
- Life expectancy: 84.4 years (state: 78.4 years)
- Pop. w/ access to physical activity locations: 44.3% (state: 81.7%)
- Amount of primary care physicians: 51.3 per 100,000 (state: 60.6 per 100,000)
Utah: Grand County

- Residents who are 65 and over: 20.4% (state: 11.1%)
- Life expectancy: 79.4 years (state: 79.7 years)
- Pop. w/ access to physical activity locations: 94.5% (state: 84.2%)
- Amount of primary care physicians: 134.5 per 100,000 (state: 55.9 per 100,000)
Vermont: Washington County

- Residents who are 65 and over: 19.7% (state: 19.5%)
- Life expectancy: 79.8 years (state: 79.7 years)
- Pop. w/ access to physical activity locations: 73.4% (state: 70.6%)
- Amount of primary care physicians: 100.1 per 100,000 (state: 112.9 per 100,000)
Virginia: James City County

- Residents who are 65 and over: 25.2% (state: 15.5%)
- Life expectancy: 81.6 years (state: 79.1 years)
- Pop. w/ access to physical activity locations: 97.5% (state: 83.4%)
- Amount of primary care physicians: 111.4 per 100,000 (state: 75.0 per 100,000)
Washington: San Juan County

- Residents who are 65 and over: 33.7% (state: 15.5%)
- Life expectancy: 86.3 years (state: 80.2 years)
- Pop. w/ access to physical activity locations: 86.2% (state: 86.0%)
- Amount of primary care physicians: 70.1 per 100,000 (state: 83.9 per 100,000)
West Virginia: Tucker County

- Residents who are 65 and over: 26.3% (state: 19.9%)
- Life expectancy: 75.5 years (state: 74.3 years)
- Pop. w/ access to physical activity locations: 98.7% (state: 57.8%)
- Amount of primary care physicians: 60.0 per 100,000 (state: 78.6 per 100,000)
Wisconsin: Ozaukee County
- Residents who are 65 and over: 19.8% (state: 17.0%)
- Life expectancy: 81.9 years (state: 78.9 years)
- Pop. w/ access to physical activity locations: 97.3% (state: 83.5%)
- Amount of primary care physicians: 141.6 per 100,000 (state: 79.7 per 100,000)
Wyoming: Park County

- Residents who are 65 and over: 23.3% (state: 16.7%)
- Life expectancy: 80.5 years (state: 78.1 years)
- Pop. w/ access to physical activity locations: 72.5% (state: 77.5%)
- Amount of primary care physicians: 122.9 per 100,000 (state: 70.1 per 100,000)