Key Points
- Upward economic mobility has been growing increasingly difficult in the U.S. in recent decades — particularly for those at the lower end of the income spectrum.
- Nationwide, Americans born into a low-income household in the early 1990s earn an average of about $1,300 less at age 27 than those who were born into similar households in the late 1970s.
- In some parts of the country, economic opportunity for low-income residents has diminished far faster than average.
One of the core tenets of the American Dream is that, through hard work, any child born in the U.S. can climb the socioeconomic ladder and achieve their own version of success. However, by this yardstick, the American Dream is fading fast.
According to Opportunity Insights, a Harvard-based research organization, over 90% of Americans born in the 1940s earned more in adulthood than their parents did. Now, after decades of declining economic mobility, fewer than 50% of all Americans born in the 1980s earn more than their parents at a comparable age.
The macroeconomic forces behind this trend are varied — but declining Gross Domestic Product growth rates and rising inequality of wealth distribution are among the most commonly cited culprits. The effects of this trend, meanwhile, are felt in the everyday lives of millions of Americans — particularly those at the lower end of the income spectrum, for whom upward mobility has become increasingly difficult.
A study conducted by Opportunity Insights found that the average income of an American born in 1992 — into a household in the lowest earning quartile — had an average household income of just $30,235 by age 27. Meanwhile, an American born into a low-income household in 1978, earned an average income of $31,552 at age 27. These figures are both adjusted to 2023 dollars, and reflect a 4.2% decline in earnings for Americans born into the bottom 25% of households.
In many parts of the United States, the opportunity for upward mobility has diminished to a far greater degree.
Using data from Opportunity Insights, 24/7 Wall St. identified the counties where the American Dream is dead. We reviewed data at the county and county equivalent level on the average household income for Americans born into households in the bottom 25% of the income spectrum in both 1978 and 1992. Counties are ranked on the percent change in inflation-adjusted average household income among each cohort at age 27. A full complete methodological breakdown is available here.
In each of the 49 counties and county equivalents on this list, average household earnings at age 27 has declined by at least 20.5% from those born into low-income households in 1978 compared to those born into low-income households in 1992. In more practical terms, Americans who were born in these places in 1978 earned an average of anywhere from $4,640 to $19,100 more at age 27 than those who were born in 1992. (Here is a look at the income you need to live comfortably in each state.)
The largest share of counties on this list — 23 out of 49 — are located in the South. Another 17 are in the West and nine are in the Midwest. None of these counties are located in the Northeast. (Here is a look at the worst county to live in each state.)
As upward economic mobility has gotten more difficult for lower income Americans in recent decades, it is perhaps not surprising that many of the places on this list are home to relatively large populations facing serious financial hardship. In most counties on this list, the share of residents living below the poverty line exceeds the 12.5% national poverty rate, according to five-year estimates from the U.S. Census Bureau’s 2022 American Community Survey.
Why It Matters

The ability to achieve success and financial stability through hard work has long been a cornerstone of the American Dream. But in communities across the country, those born into financially disadvantaged households are earning far less as adults than those born into similar circumstances decades earlier. While the American Dream may be slowly fading nationwide, in parts of the country, it has already all but disappeared.
49. Union County, Florida

- Long-term change in avg. earnings for 27 year-olds born into low-income households: -20.5% (-$6,778)
- Avg. earnings among 27 year-olds born in 1978 into low-income households: $33,081 (inflation-adjusted)
- Avg. earnings among 27 year-olds born in 1992 into low-income households: $26,303 (inflation-adjusted)
- 2023 unemployment rate: 3.0%
- Homeownership rate in 2022: 69.7%
- Poverty rate in 2022: 15.9%
- Total population: 15,524
48. Baker County, Florida

- Long-term change in avg. earnings for 27 year-olds born into low-income households: -20.5% (-$6,680)
- Avg. earnings among 27 year-olds born in 1978 into low-income households: $32,566 (inflation-adjusted)
- Avg. earnings among 27 year-olds born in 1992 into low-income households: $25,886 (inflation-adjusted)
- 2023 unemployment rate: 2.9%
- Homeownership rate in 2022: 79.8%
- Poverty rate in 2022: 13.7%
- Total population: 27,969
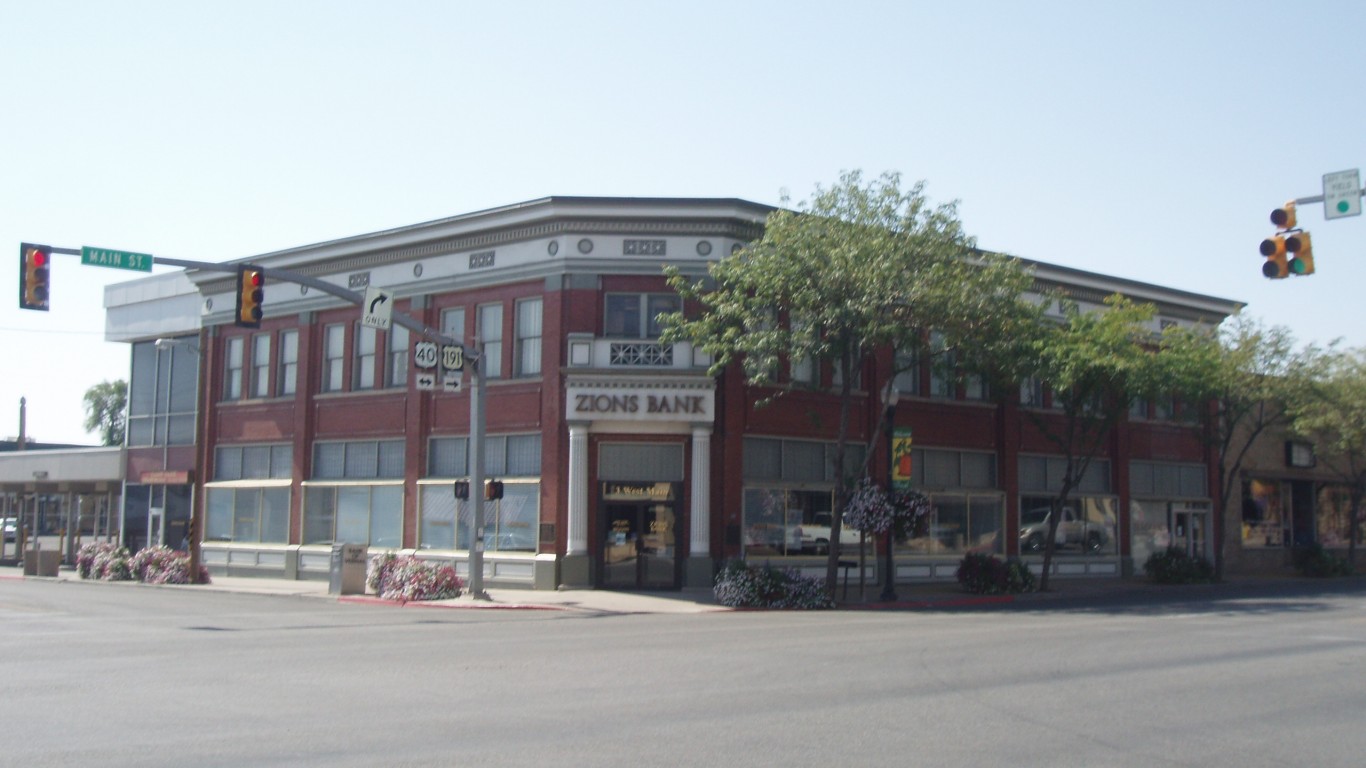
47. Carbon County, Utah
- Long-term change in avg. earnings for 27 year-olds born into low-income households: -20.6% (-$8,152)
- Avg. earnings among 27 year-olds born in 1978 into low-income households: $39,664 (inflation-adjusted)
- Avg. earnings among 27 year-olds born in 1992 into low-income households: $31,512 (inflation-adjusted)
- 2023 unemployment rate: 3.7%
- Homeownership rate in 2022: 67.0%
- Poverty rate in 2022: 16.6%
- Total population: 20,338
46. Campbell County, Wyoming

- Long-term change in avg. earnings for 27 year-olds born into low-income households: -20.6% (-$9,436)
- Avg. earnings among 27 year-olds born in 1978 into low-income households: $45,896 (inflation-adjusted)
- Avg. earnings among 27 year-olds born in 1992 into low-income households: $36,460 (inflation-adjusted)
- 2023 unemployment rate: 2.7%
- Homeownership rate in 2022: 78.3%
- Poverty rate in 2022: 9.5%
- Total population: 46,857
45. Poquoson city, Virginia

- Long-term change in avg. earnings for 27 year-olds born into low-income households: -20.6% (-$8,029)
- Avg. earnings among 27 year-olds born in 1978 into low-income households: $39,001 (inflation-adjusted)
- Avg. earnings among 27 year-olds born in 1992 into low-income households: $30,972 (inflation-adjusted)
- 2023 unemployment rate: 2.5%
- Homeownership rate in 2022: 82.1%
- Poverty rate in 2022: 4.5%
- Total population: 12,479
44. Northwest Arctic Borough, Alaska

- Long-term change in avg. earnings for 27 year-olds born into low-income households: -20.9% (-$4,637)
- Avg. earnings among 27 year-olds born in 1978 into low-income households: $22,145 (inflation-adjusted)
- Avg. earnings among 27 year-olds born in 1992 into low-income households: $17,509 (inflation-adjusted)
- 2023 unemployment rate: 9.6%
- Homeownership rate in 2022: 61.0%
- Poverty rate in 2022: 18.5%
- Total population: 7,682
43. Hopewell city, Virginia

- Long-term change in avg. earnings for 27 year-olds born into low-income households: -21.0% (-$6,208)
- Avg. earnings among 27 year-olds born in 1978 into low-income households: $29,597 (inflation-adjusted)
- Avg. earnings among 27 year-olds born in 1992 into low-income households: $23,389 (inflation-adjusted)
- 2023 unemployment rate: 4.4%
- Homeownership rate in 2022: 53.6%
- Poverty rate in 2022: 21.3%
- Total population: 23,046
42. Dickenson County, Virginia

- Long-term change in avg. earnings for 27 year-olds born into low-income households: -21.2% (-$8,424)
- Avg. earnings among 27 year-olds born in 1978 into low-income households: $39,661 (inflation-adjusted)
- Avg. earnings among 27 year-olds born in 1992 into low-income households: $31,237 (inflation-adjusted)
- 2023 unemployment rate: 4.4%
- Homeownership rate in 2022: 77.2%
- Poverty rate in 2022: 22.5%
- Total population: 14,089
41. Caldwell Parish, Louisiana

- Long-term change in avg. earnings for 27 year-olds born into low-income households: -21.6% (-$9,132)
- Avg. earnings among 27 year-olds born in 1978 into low-income households: $42,370 (inflation-adjusted)
- Avg. earnings among 27 year-olds born in 1992 into low-income households: $33,237 (inflation-adjusted)
- 2023 unemployment rate: 4.0%
- Homeownership rate in 2022: 69.6%
- Poverty rate in 2022: 24.9%
- Total population: 9,658
40. Pawnee County, Kansas

- Long-term change in avg. earnings for 27 year-olds born into low-income households: -21.7% (-$9,045)
- Avg. earnings among 27 year-olds born in 1978 into low-income households: $41,599 (inflation-adjusted)
- Avg. earnings among 27 year-olds born in 1992 into low-income households: $32,554 (inflation-adjusted)
- 2023 unemployment rate: 2.6%
- Homeownership rate in 2022: 61.7%
- Poverty rate in 2022: 11.9%
- Total population: 6,288
39. Converse County, Wyoming

- Long-term change in avg. earnings for 27 year-olds born into low-income households: -22.3% (-$10,153)
- Avg. earnings among 27 year-olds born in 1978 into low-income households: $45,483 (inflation-adjusted)
- Avg. earnings among 27 year-olds born in 1992 into low-income households: $35,330 (inflation-adjusted)
- 2023 unemployment rate: 2.3%
- Homeownership rate in 2022: 80.5%
- Poverty rate in 2022: 11.0%
- Total population: 13,729
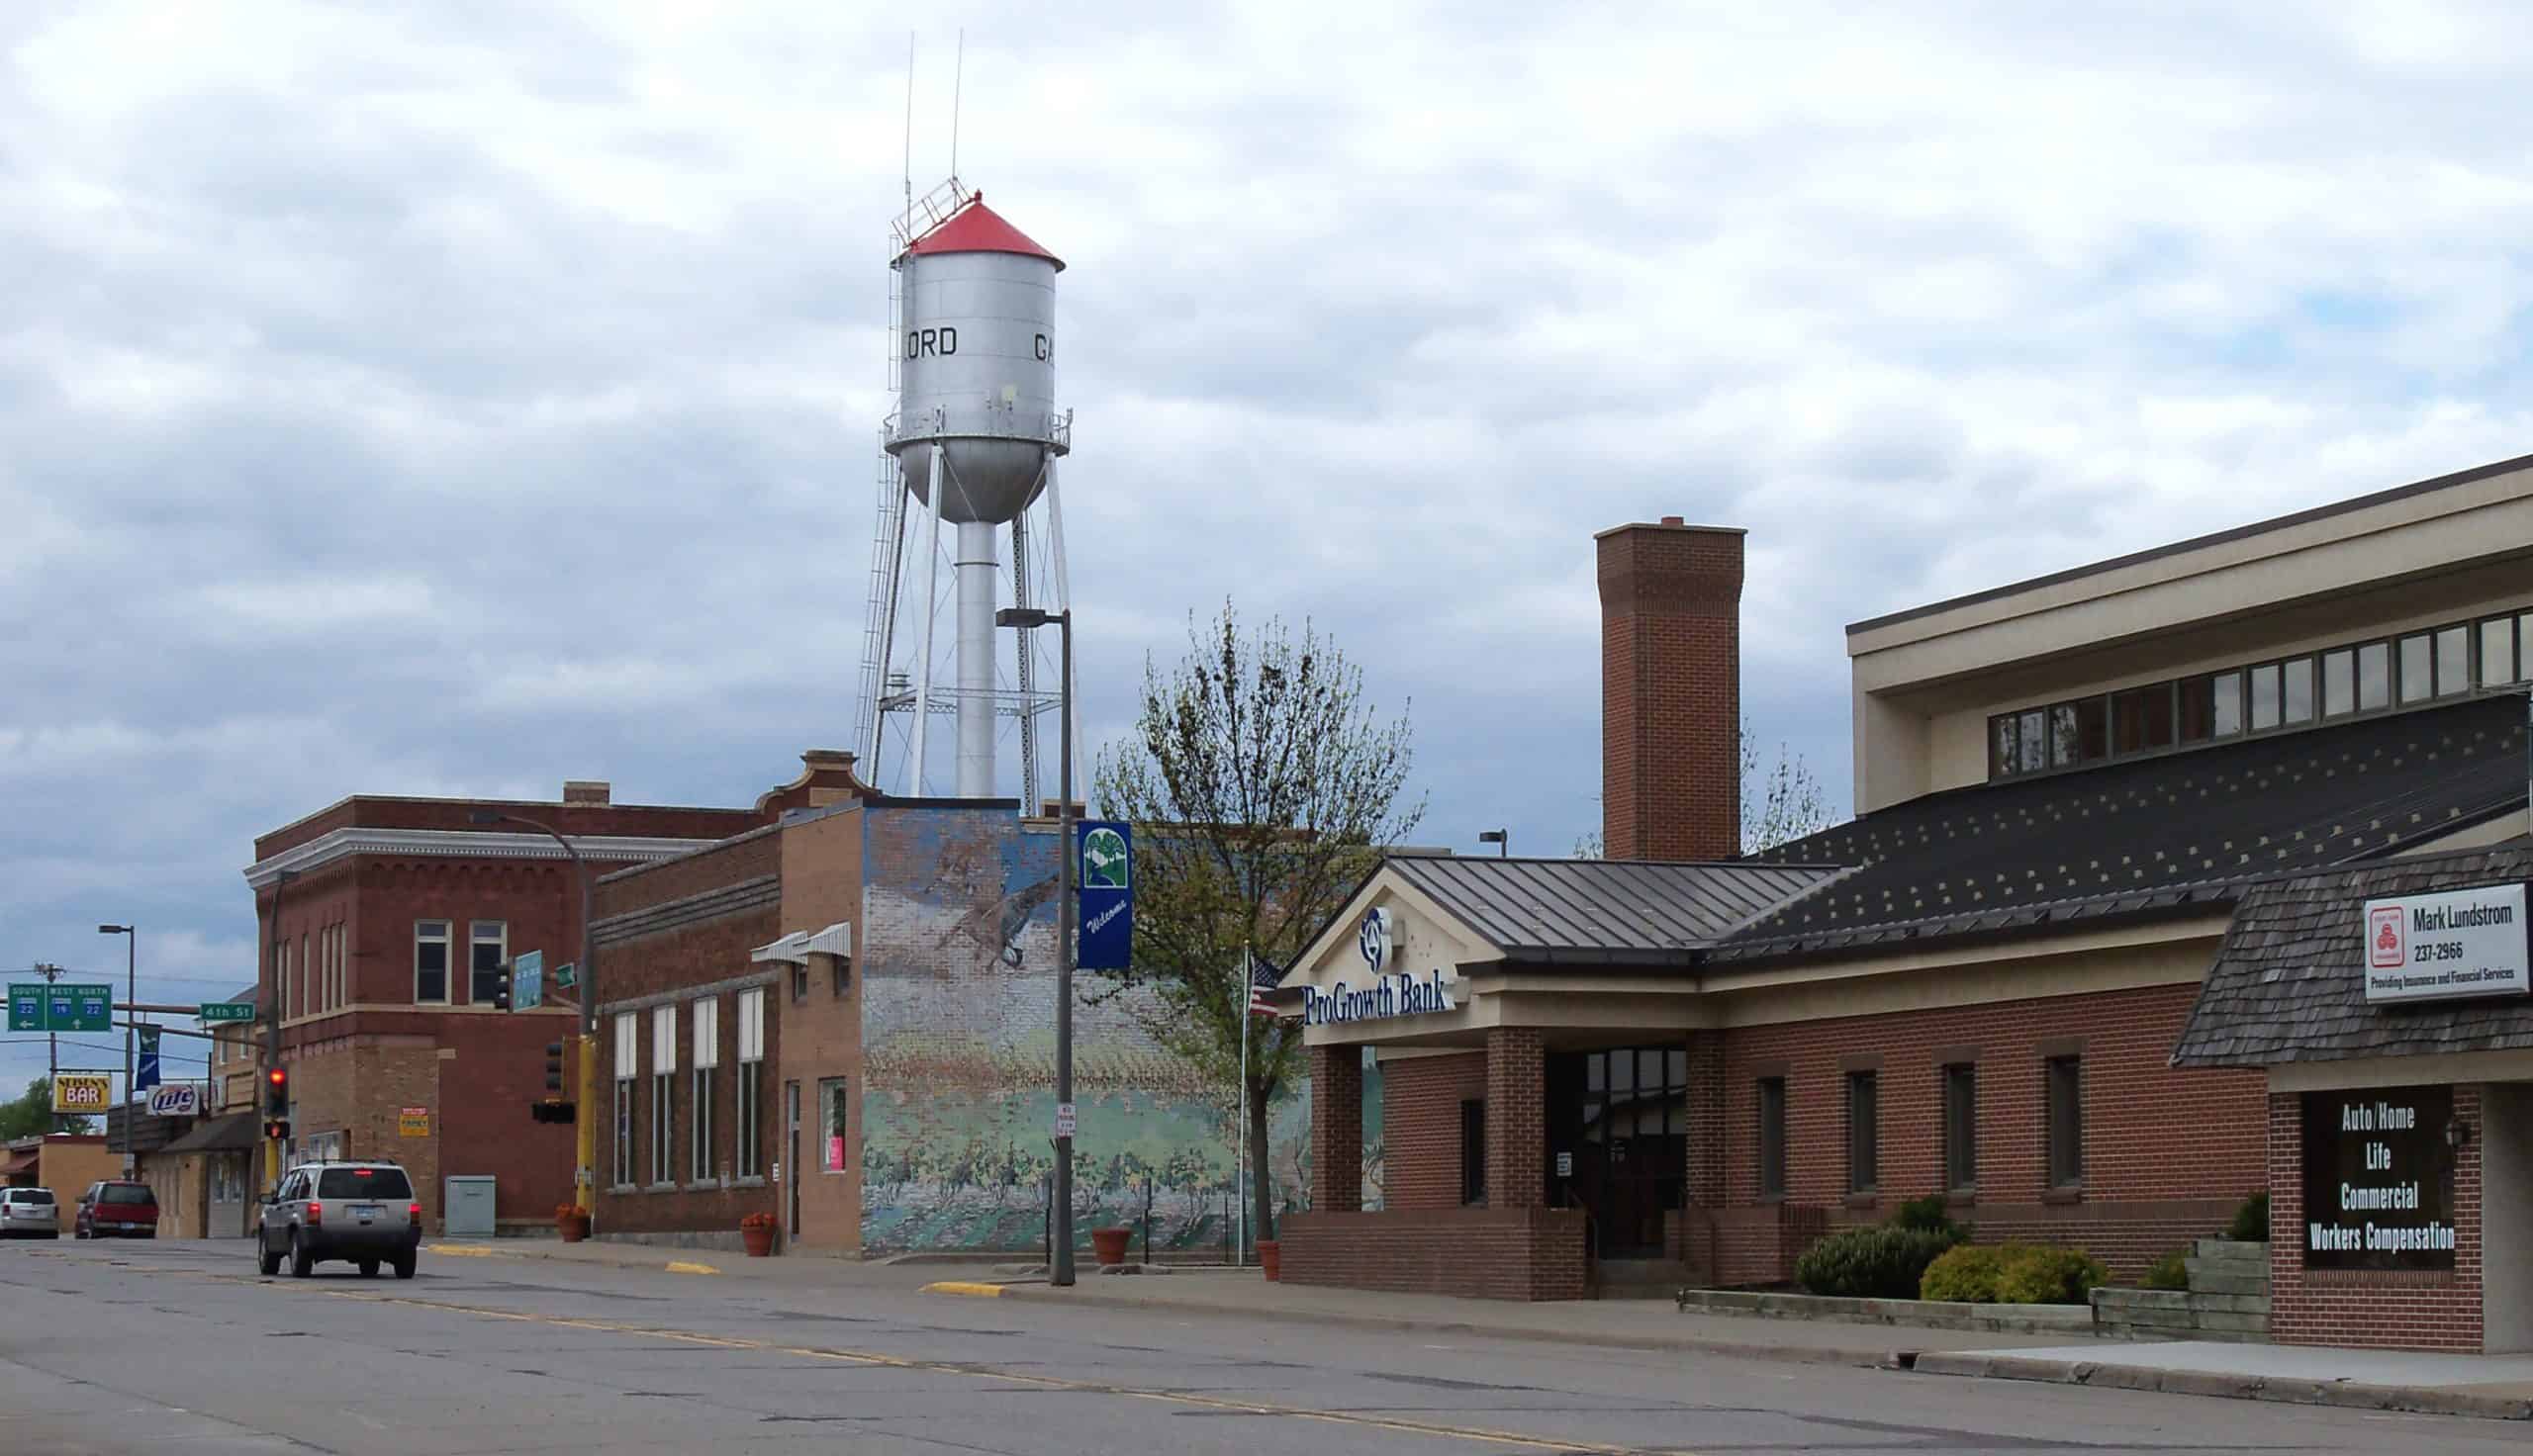
38. Swift County, Minnesota

- Long-term change in avg. earnings for 27 year-olds born into low-income households: -22.5% (-$10,158)
- Avg. earnings among 27 year-olds born in 1978 into low-income households: $45,141 (inflation-adjusted)
- Avg. earnings among 27 year-olds born in 1992 into low-income households: $34,983 (inflation-adjusted)
- 2023 unemployment rate: 3.1%
- Homeownership rate in 2022: 73.7%
- Poverty rate in 2022: 10.7%
- Total population: 9,806
37. Kane County, Utah

- Long-term change in avg. earnings for 27 year-olds born into low-income households: -22.7% (-$9,440)
- Avg. earnings among 27 year-olds born in 1978 into low-income households: $41,582 (inflation-adjusted)
- Avg. earnings among 27 year-olds born in 1992 into low-income households: $32,142 (inflation-adjusted)
- 2023 unemployment rate: 2.7%
- Homeownership rate in 2022: 78.0%
- Poverty rate in 2022: 12.9%
- Total population: 7,814
36. Doniphan County, Kansas
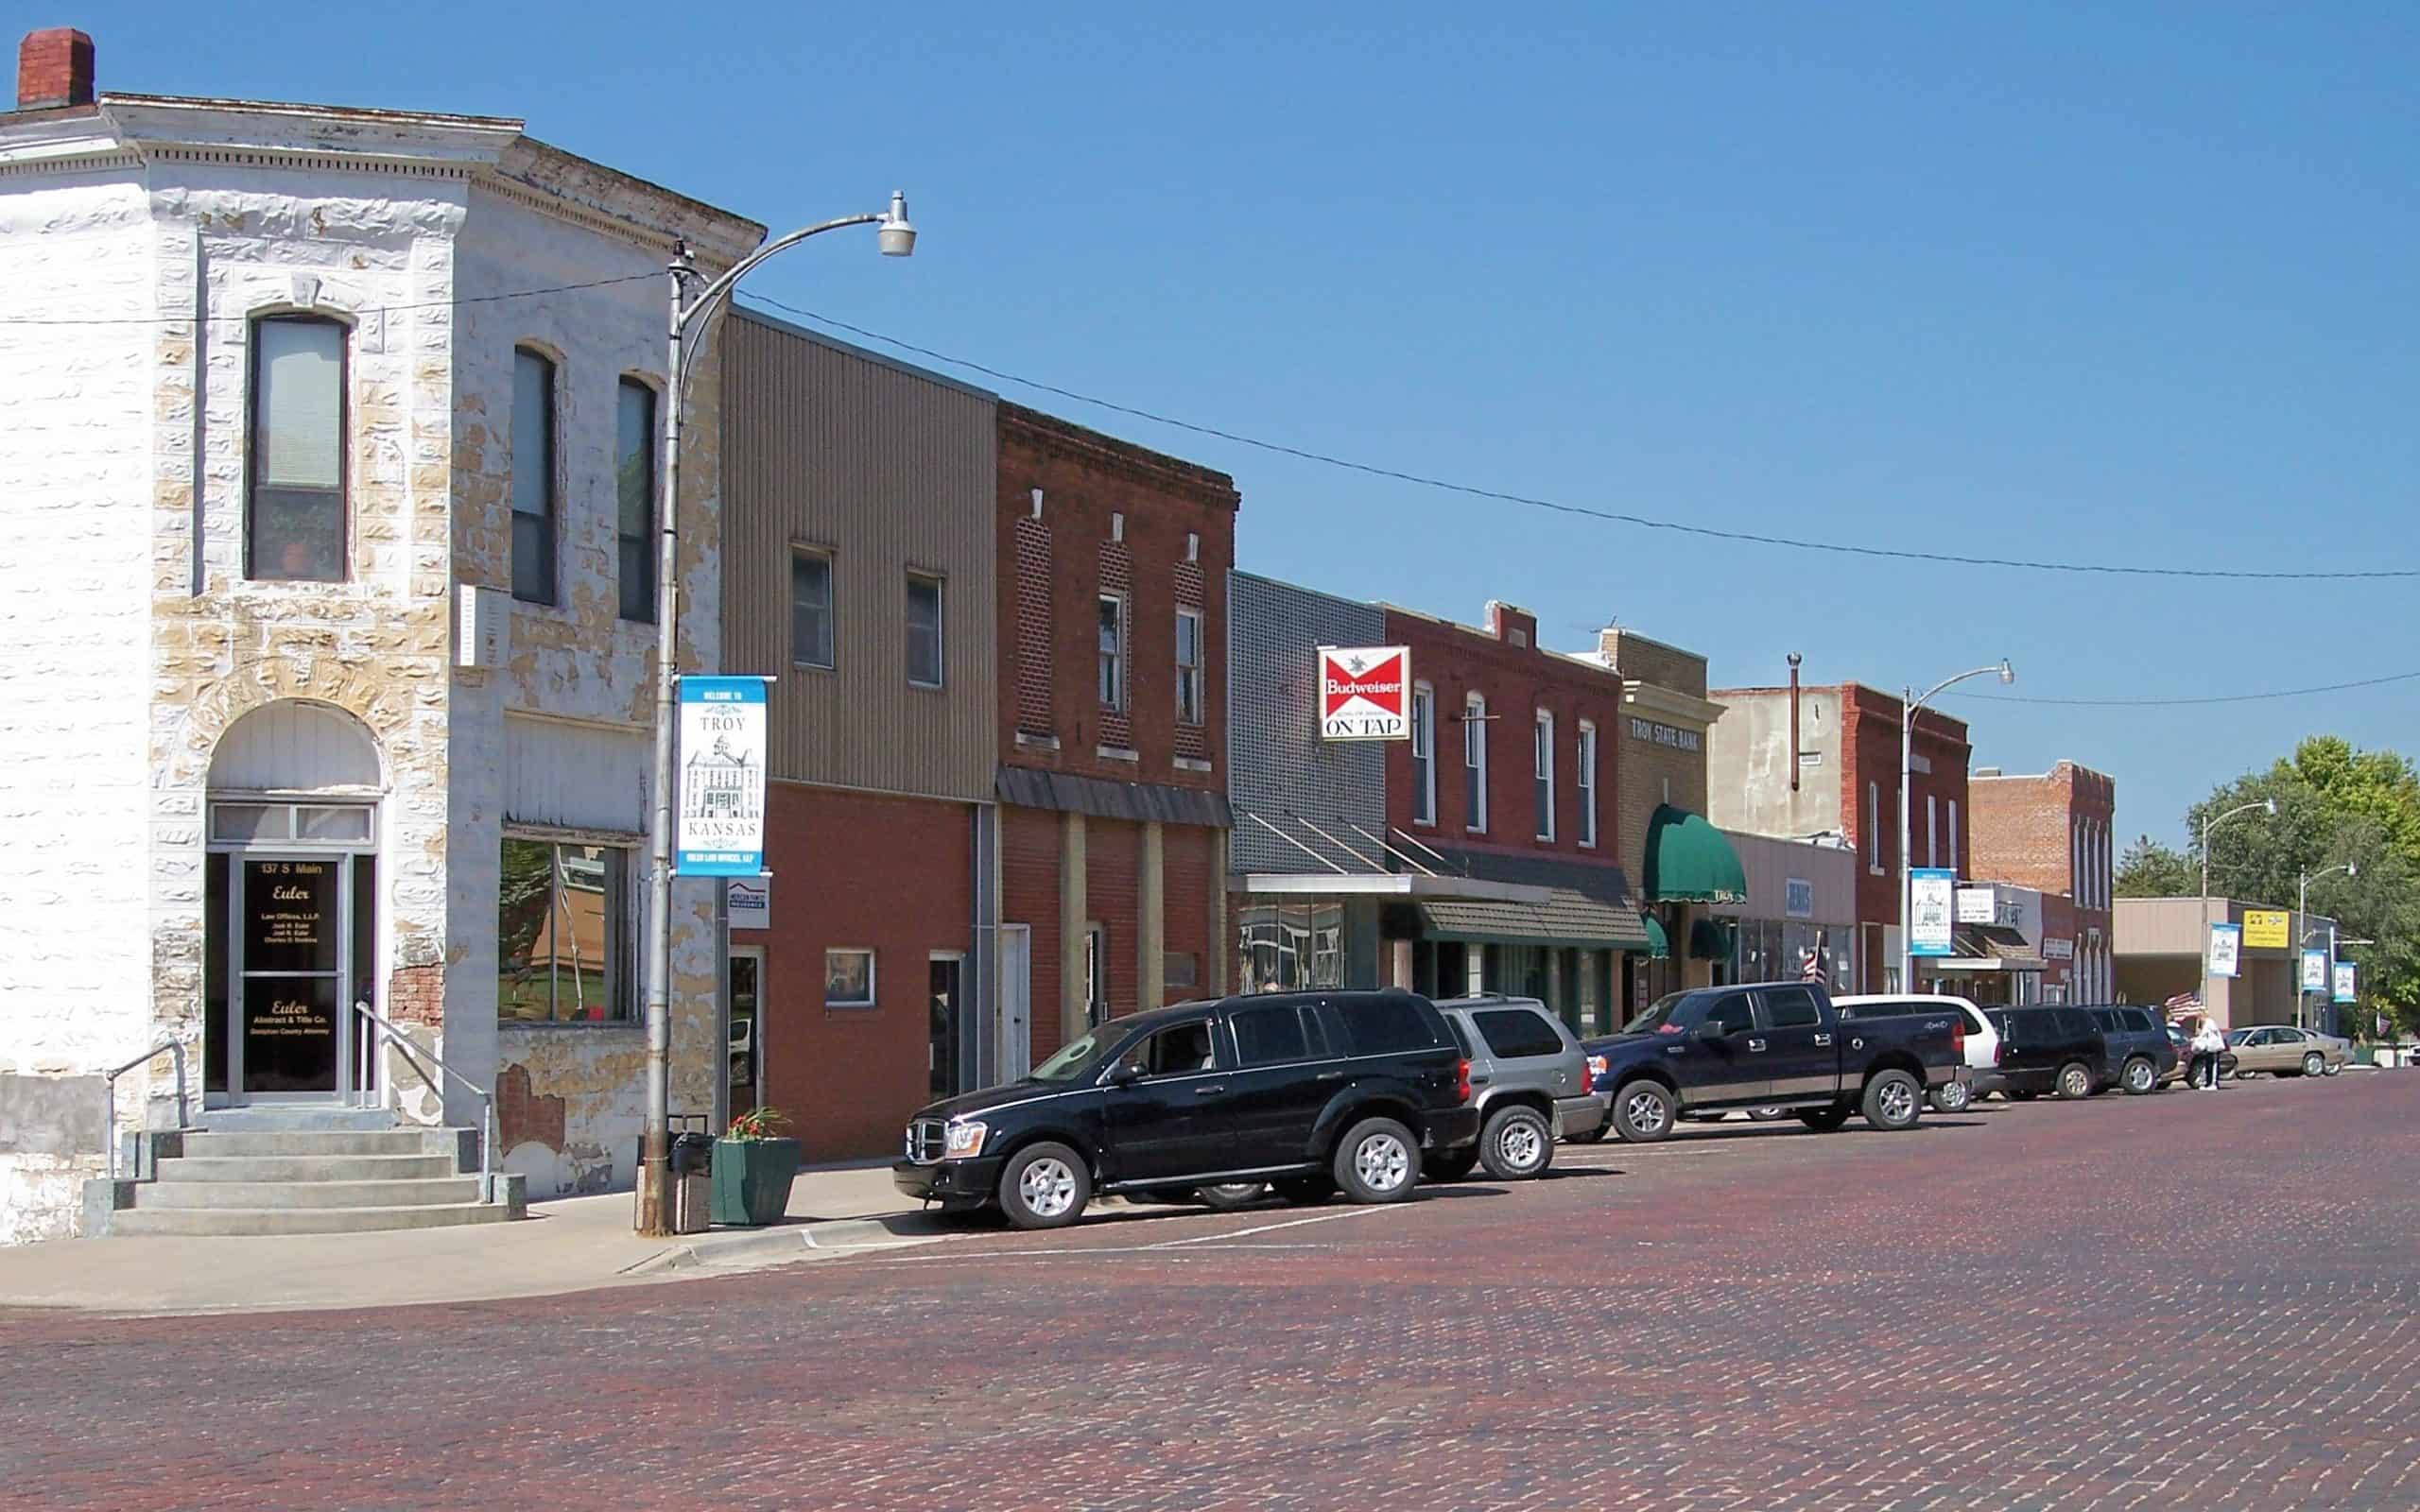
- Long-term change in avg. earnings for 27 year-olds born into low-income households: -23.1% (-$9,892)
- Avg. earnings among 27 year-olds born in 1978 into low-income households: $42,896 (inflation-adjusted)
- Avg. earnings among 27 year-olds born in 1992 into low-income households: $33,004 (inflation-adjusted)
- 2023 unemployment rate: 2.5%
- Homeownership rate in 2022: 80.1%
- Poverty rate in 2022: 11.4%
- Total population: 7,501
35. Glades County, Florida

- Long-term change in avg. earnings for 27 year-olds born into low-income households: -23.1% (-$8,037)
- Avg. earnings among 27 year-olds born in 1978 into low-income households: $34,793 (inflation-adjusted)
- Avg. earnings among 27 year-olds born in 1992 into low-income households: $26,757 (inflation-adjusted)
- 2023 unemployment rate: 3.8%
- Homeownership rate in 2022: 78.4%
- Poverty rate in 2022: 21.9%
- Total population: 12,179
34. Mariposa County, California

- Long-term change in avg. earnings for 27 year-olds born into low-income households: -23.1% (-$9,274)
- Avg. earnings among 27 year-olds born in 1978 into low-income households: $40,107 (inflation-adjusted)
- Avg. earnings among 27 year-olds born in 1992 into low-income households: $30,833 (inflation-adjusted)
- 2023 unemployment rate: 5.1%
- Homeownership rate in 2022: 73.8%
- Poverty rate in 2022: 16.0%
- Total population: 17,130
33. Haskell County, Oklahoma

- Long-term change in avg. earnings for 27 year-olds born into low-income households: -23.2% (-$9,072)
- Avg. earnings among 27 year-olds born in 1978 into low-income households: $39,064 (inflation-adjusted)
- Avg. earnings among 27 year-olds born in 1992 into low-income households: $29,992 (inflation-adjusted)
- 2023 unemployment rate: 4.8%
- Homeownership rate in 2022: 75.1%
- Poverty rate in 2022: 21.4%
- Total population: 11,651
32. Sibley County, Minnesota
- Long-term change in avg. earnings for 27 year-olds born into low-income households: -23.3% (-$11,846)
- Avg. earnings among 27 year-olds born in 1978 into low-income households: $50,852 (inflation-adjusted)
- Avg. earnings among 27 year-olds born in 1992 into low-income households: $39,005 (inflation-adjusted)
- 2023 unemployment rate: 3.3%
- Homeownership rate in 2022: 81.3%
- Poverty rate in 2022: 8.6%
- Total population: 14,950
31. Liberty County, Florida

- Long-term change in avg. earnings for 27 year-olds born into low-income households: -23.5% (-$8,668)
- Avg. earnings among 27 year-olds born in 1978 into low-income households: $36,824 (inflation-adjusted)
- Avg. earnings among 27 year-olds born in 1992 into low-income households: $28,157 (inflation-adjusted)
- 2023 unemployment rate: 3.3%
- Homeownership rate in 2022: 80.6%
- Poverty rate in 2022: 21.8%
- Total population: 7,704
30. Greenlee County, Arizona

- Long-term change in avg. earnings for 27 year-olds born into low-income households: -23.6% (-$9,607)
- Avg. earnings among 27 year-olds born in 1978 into low-income households: $40,709 (inflation-adjusted)
- Avg. earnings among 27 year-olds born in 1992 into low-income households: $31,102 (inflation-adjusted)
- 2023 unemployment rate: 2.9%
- Homeownership rate in 2022: 56.2%
- Poverty rate in 2022: 12.8%
- Total population: 9,483
29. Charles County, Maryland

- Long-term change in avg. earnings for 27 year-olds born into low-income households: -23.9% (-$8,626)
- Avg. earnings among 27 year-olds born in 1978 into low-income households: $36,116 (inflation-adjusted)
- Avg. earnings among 27 year-olds born in 1992 into low-income households: $27,490 (inflation-adjusted)
- 2023 unemployment rate: 2.2%
- Homeownership rate in 2022: 79.8%
- Poverty rate in 2022: 5.9%
- Total population: 167,035
28. Morgan County, West Virginia
- Long-term change in avg. earnings for 27 year-olds born into low-income households: -24.0% (-$8,454)
- Avg. earnings among 27 year-olds born in 1978 into low-income households: $35,205 (inflation-adjusted)
- Avg. earnings among 27 year-olds born in 1992 into low-income households: $26,751 (inflation-adjusted)
- 2023 unemployment rate: 3.1%
- Homeownership rate in 2022: 84.3%
- Poverty rate in 2022: 10.6%
- Total population: 17,237
27. Colfax County, New Mexico
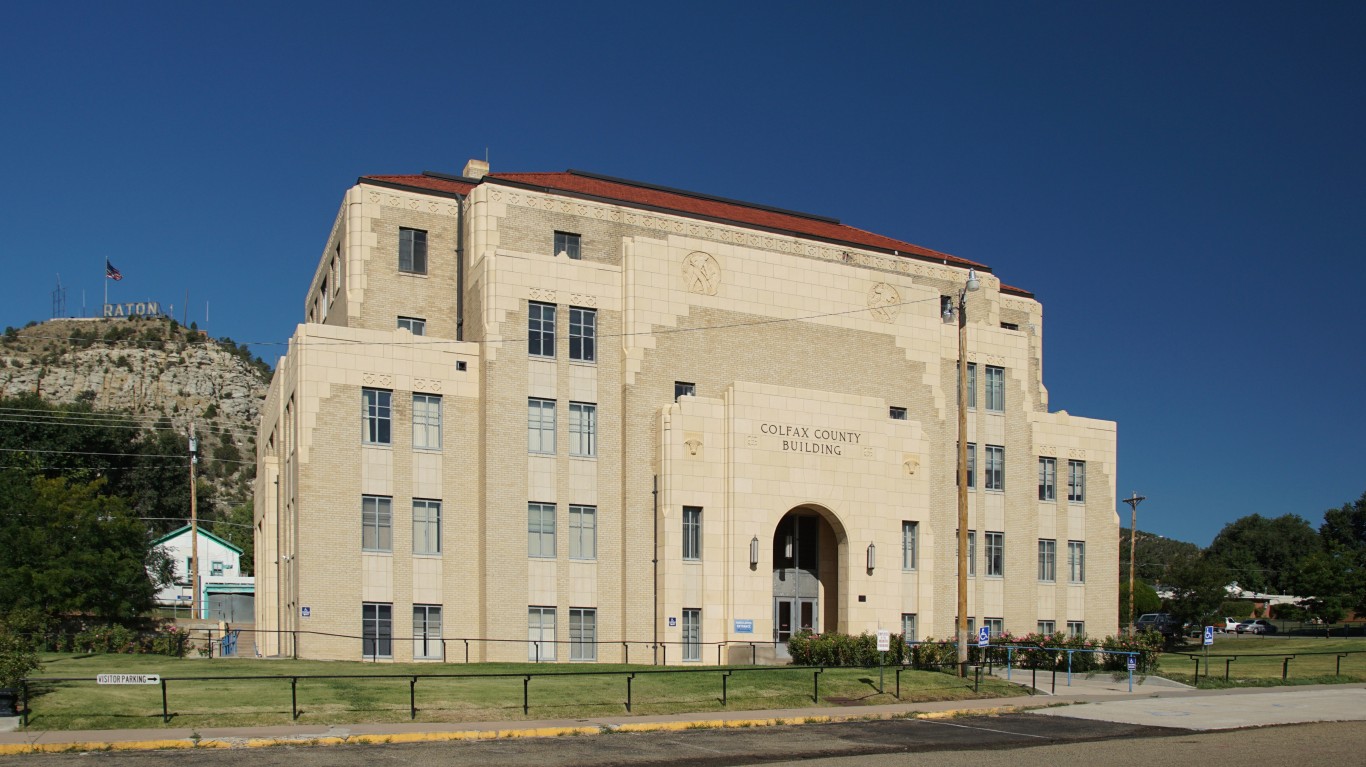
- Long-term change in avg. earnings for 27 year-olds born into low-income households: -24.1% (-$7,972)
- Avg. earnings among 27 year-olds born in 1978 into low-income households: $33,129 (inflation-adjusted)
- Avg. earnings among 27 year-olds born in 1992 into low-income households: $25,158 (inflation-adjusted)
- 2023 unemployment rate: 3.4%
- Homeownership rate in 2022: 71.7%
- Poverty rate in 2022: 18.1%
- Total population: 12,370
26. LaSalle Parish, Louisiana

- Long-term change in avg. earnings for 27 year-olds born into low-income households: -24.2% (-$10,465)
- Avg. earnings among 27 year-olds born in 1978 into low-income households: $43,331 (inflation-adjusted)
- Avg. earnings among 27 year-olds born in 1992 into low-income households: $32,867 (inflation-adjusted)
- 2023 unemployment rate: 3.0%
- Homeownership rate in 2022: 83.1%
- Poverty rate in 2022: 15.2%
- Total population: 14,764
25. Duchesne County, Utah

- Long-term change in avg. earnings for 27 year-olds born into low-income households: -24.3% (-$12,555)
- Avg. earnings among 27 year-olds born in 1978 into low-income households: $51,738 (inflation-adjusted)
- Avg. earnings among 27 year-olds born in 1992 into low-income households: $39,183 (inflation-adjusted)
- 2023 unemployment rate: 2.9%
- Homeownership rate in 2022: 77.3%
- Poverty rate in 2022: 13.5%
- Total population: 19,779
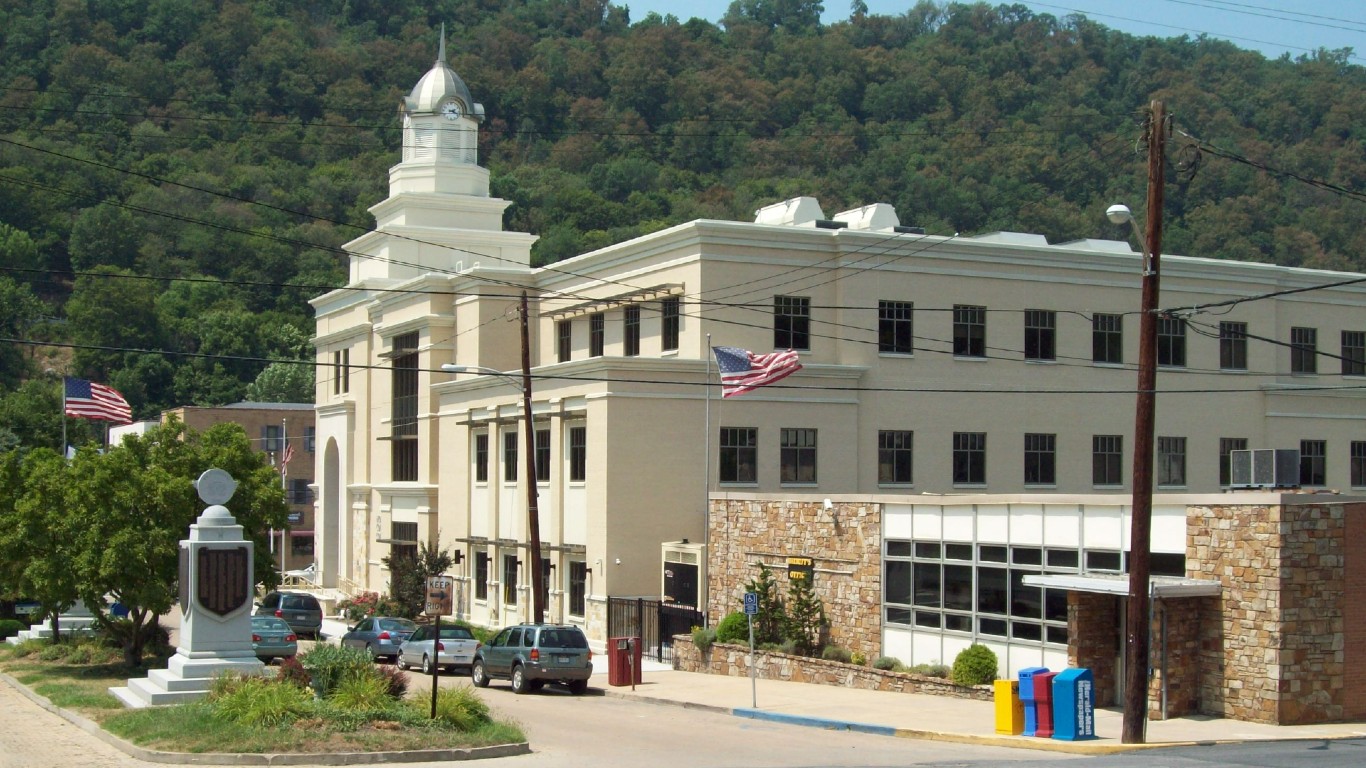
24. Buena Vista city, Virginia

- Long-term change in avg. earnings for 27 year-olds born into low-income households: -24.5% (-$8,466)
- Avg. earnings among 27 year-olds born in 1978 into low-income households: $34,596 (inflation-adjusted)
- Avg. earnings among 27 year-olds born in 1992 into low-income households: $26,130 (inflation-adjusted)
- 2023 unemployment rate: 2.7%
- Homeownership rate in 2022: 57.7%
- Poverty rate in 2022: 21.9%
- Total population: 6,639
23. Gallatin County, Kentucky

- Long-term change in avg. earnings for 27 year-olds born into low-income households: -24.8% (-$9,205)
- Avg. earnings among 27 year-olds born in 1978 into low-income households: $37,130 (inflation-adjusted)
- Avg. earnings among 27 year-olds born in 1992 into low-income households: $27,926 (inflation-adjusted)
- 2023 unemployment rate: 4.0%
- Homeownership rate in 2022: 70.5%
- Poverty rate in 2022: 16.8%
- Total population: 8,720
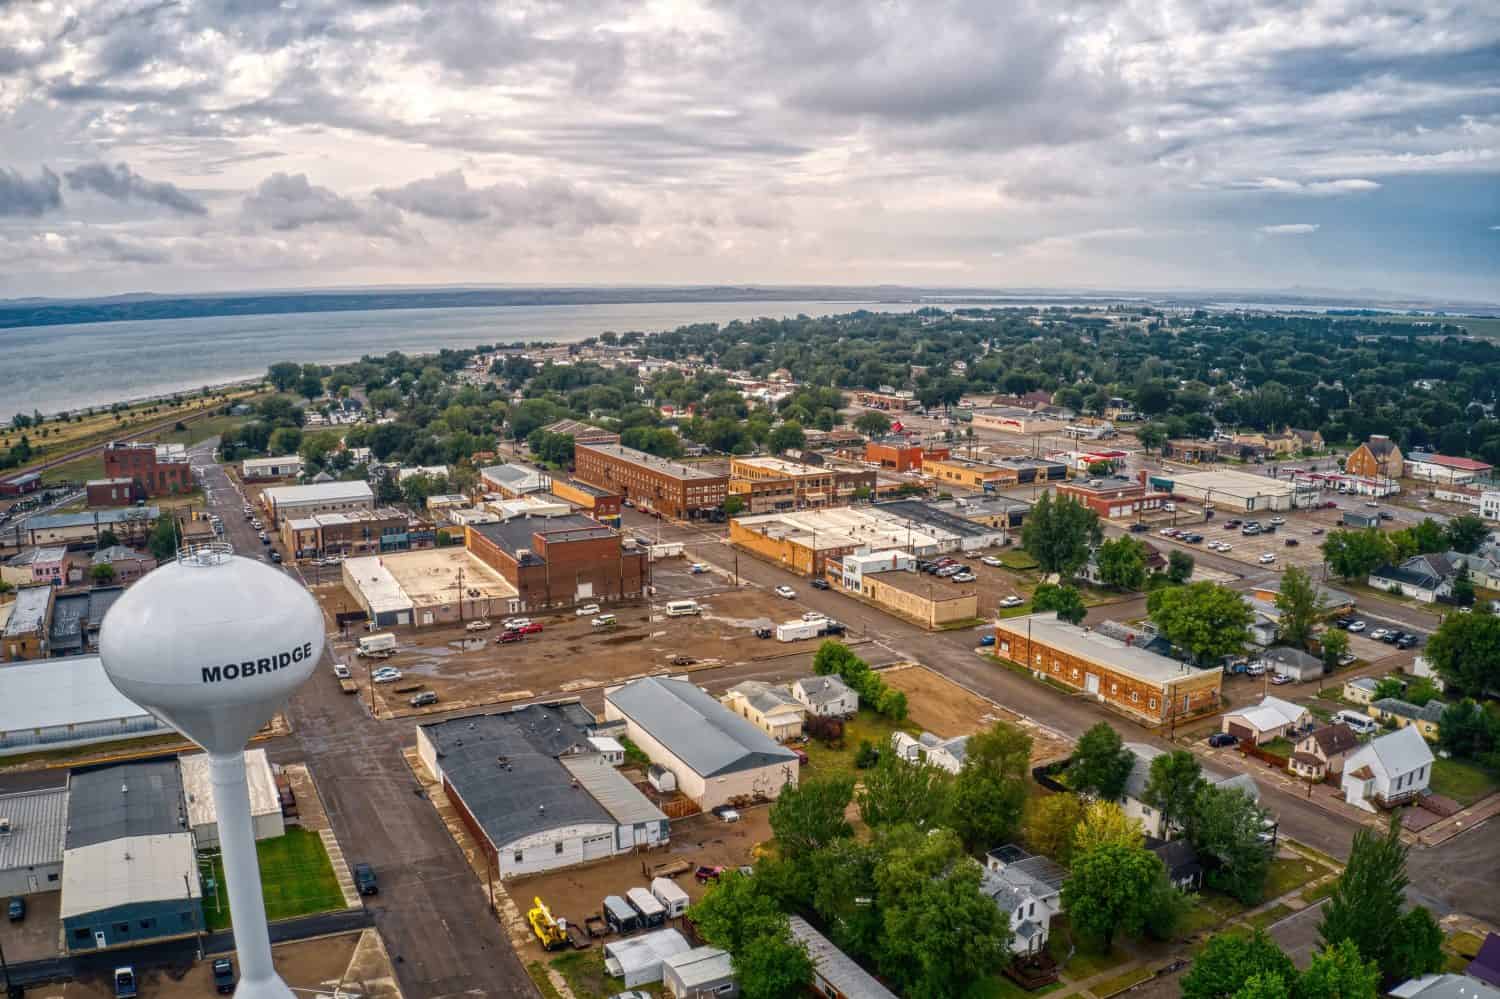
22. Moody County, South Dakota

- Long-term change in avg. earnings for 27 year-olds born into low-income households: -25.0% (-$11,285)
- Avg. earnings among 27 year-olds born in 1978 into low-income households: $45,083 (inflation-adjusted)
- Avg. earnings among 27 year-olds born in 1992 into low-income households: $33,799 (inflation-adjusted)
- 2023 unemployment rate: 2.0%
- Homeownership rate in 2022: 69.6%
- Poverty rate in 2022: 9.6%
- Total population: 6,346
21. Cleveland County, Arkansas

- Long-term change in avg. earnings for 27 year-olds born into low-income households: -25.1% (-$10,210)
- Avg. earnings among 27 year-olds born in 1978 into low-income households: $40,704 (inflation-adjusted)
- Avg. earnings among 27 year-olds born in 1992 into low-income households: $30,494 (inflation-adjusted)
- 2023 unemployment rate: 3.5%
- Homeownership rate in 2022: 83.6%
- Poverty rate in 2022: 13.6%
- Total population: 7,548
20. West Carroll Parish, Louisiana

- Long-term change in avg. earnings for 27 year-olds born into low-income households: -25.1% (-$10,192)
- Avg. earnings among 27 year-olds born in 1978 into low-income households: $40,537 (inflation-adjusted)
- Avg. earnings among 27 year-olds born in 1992 into low-income households: $30,345 (inflation-adjusted)
- 2023 unemployment rate: 6.2%
- Homeownership rate in 2022: 75.4%
- Poverty rate in 2022: 19.2%
- Total population: 9,800
19. Fremont County, Wyoming

- Long-term change in avg. earnings for 27 year-olds born into low-income households: -25.3% (-$10,266)
- Avg. earnings among 27 year-olds born in 1978 into low-income households: $40,586 (inflation-adjusted)
- Avg. earnings among 27 year-olds born in 1992 into low-income households: $30,320 (inflation-adjusted)
- 2023 unemployment rate: 3.4%
- Homeownership rate in 2022: 70.7%
- Poverty rate in 2022: 13.9%
- Total population: 39,402
18. Lyon County, Kentucky

- Long-term change in avg. earnings for 27 year-olds born into low-income households: -25.4% (-$9,490)
- Avg. earnings among 27 year-olds born in 1978 into low-income households: $37,404 (inflation-adjusted)
- Avg. earnings among 27 year-olds born in 1992 into low-income households: $27,914 (inflation-adjusted)
- 2023 unemployment rate: 4.4%
- Homeownership rate in 2022: 81.9%
- Poverty rate in 2022: 10.0%
- Total population: 8,721
17. Toole County, Montana
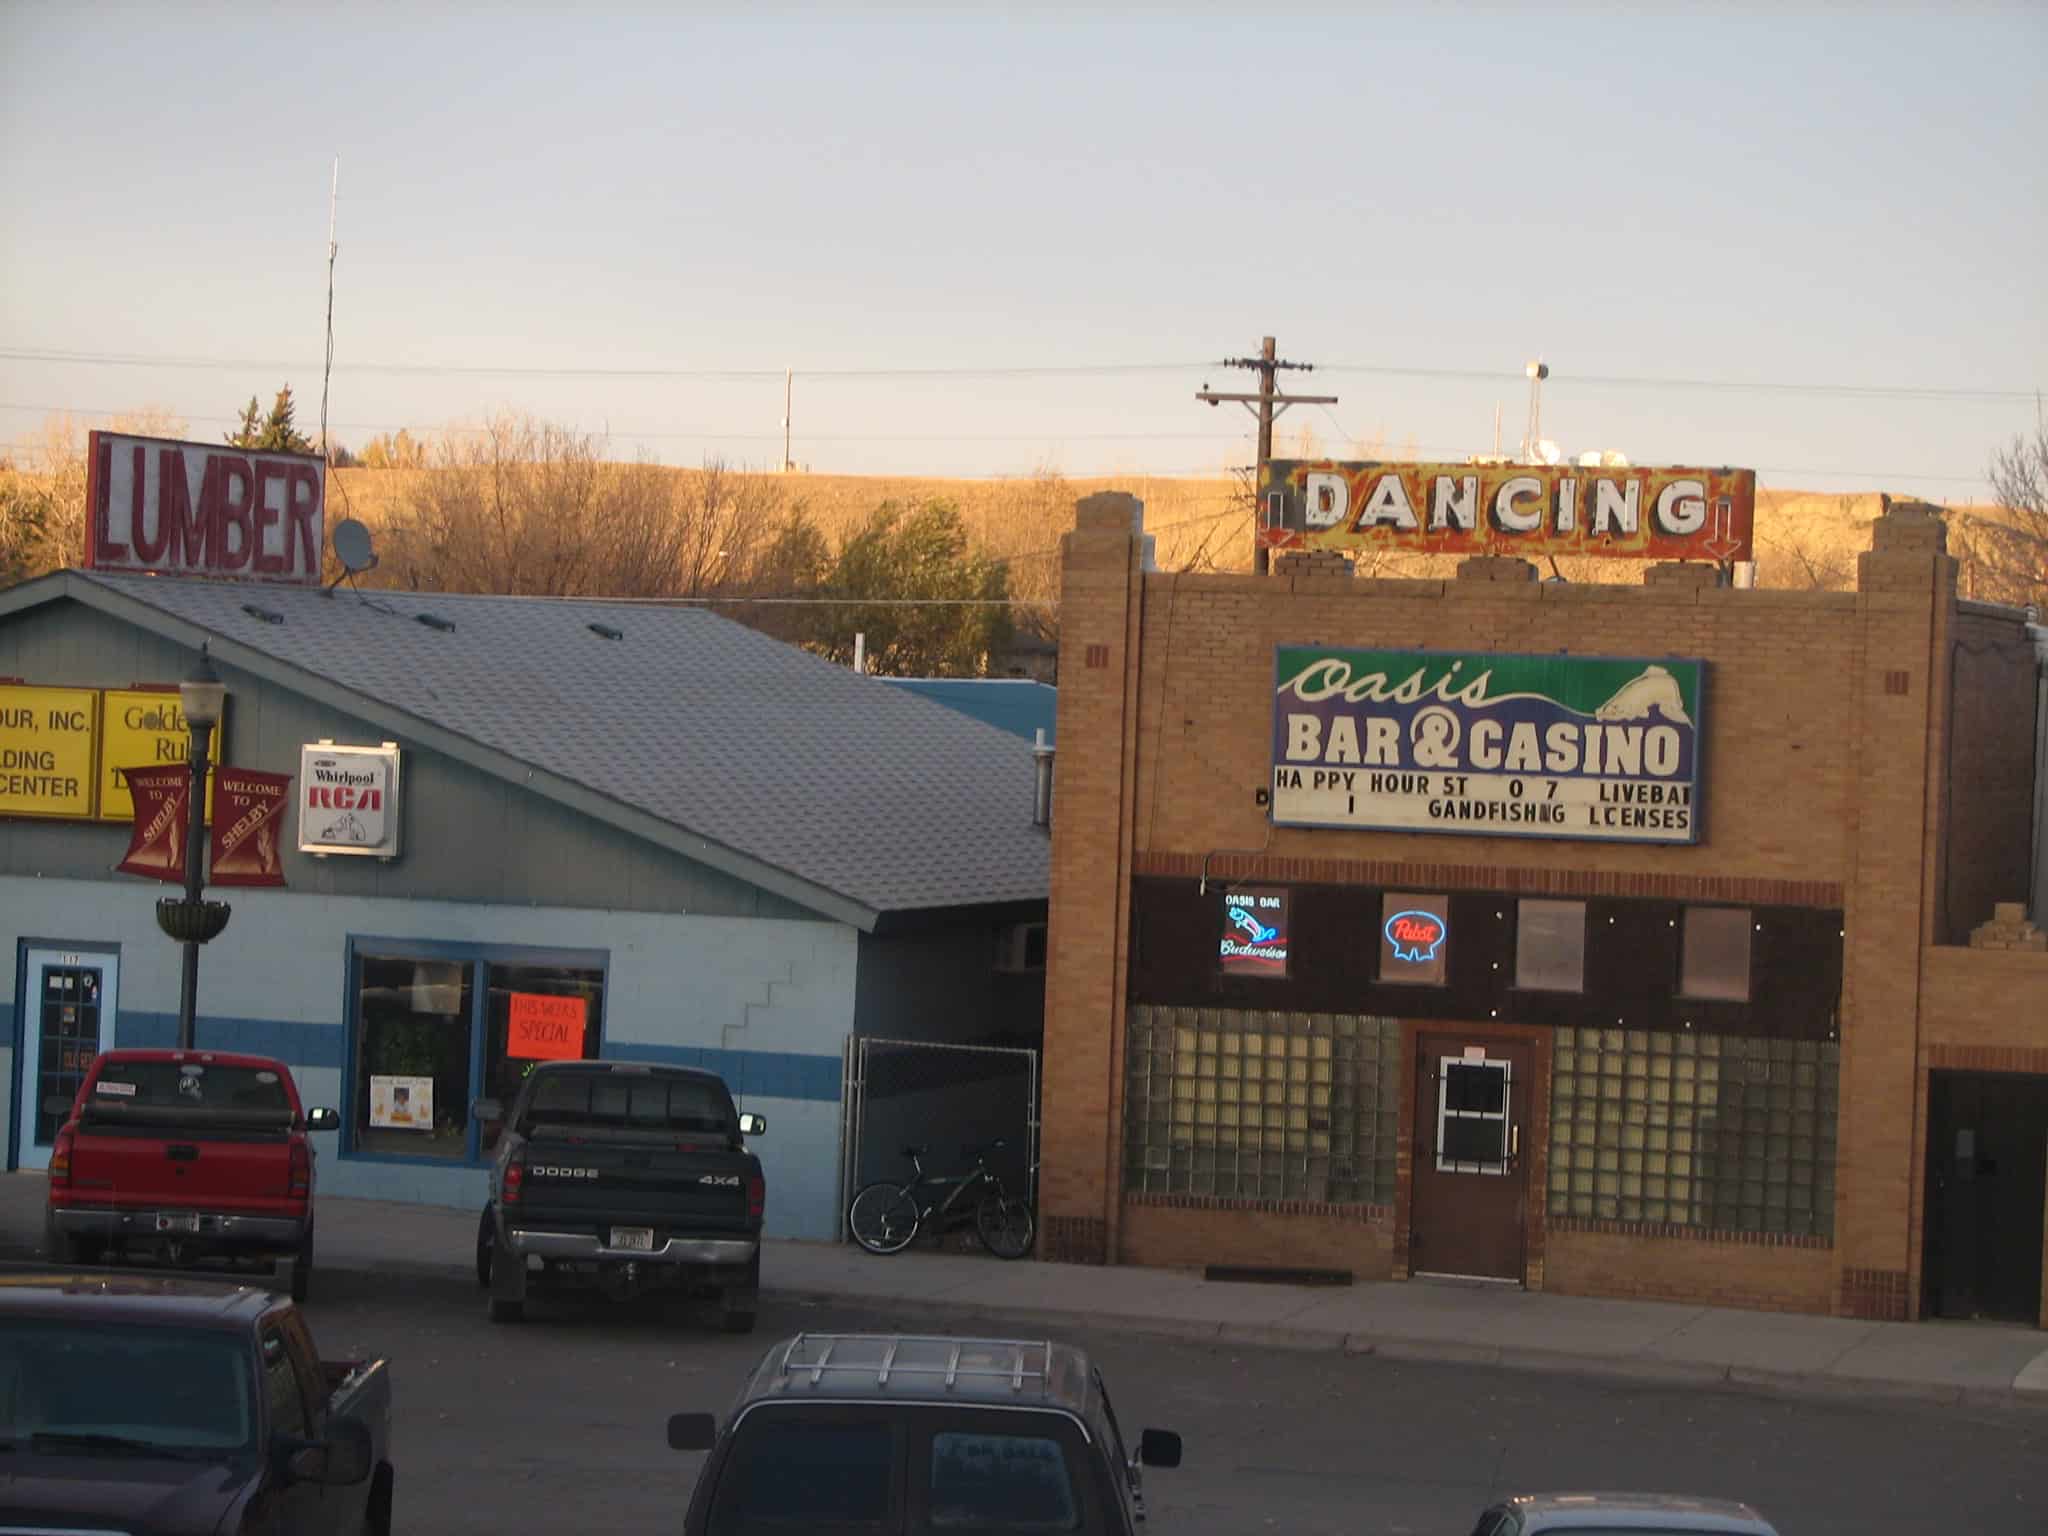
- Long-term change in avg. earnings for 27 year-olds born into low-income households: -25.8% (-$10,920)
- Avg. earnings among 27 year-olds born in 1978 into low-income households: $42,325 (inflation-adjusted)
- Avg. earnings among 27 year-olds born in 1992 into low-income households: $31,404 (inflation-adjusted)
- 2023 unemployment rate: 2.2%
- Homeownership rate in 2022: 64.9%
- Poverty rate in 2022: 10.6%
- Total population: 5,018
16. Ketchikan Gateway Borough, Alaska

- Long-term change in avg. earnings for 27 year-olds born into low-income households: -25.9% (-$9,978)
- Avg. earnings among 27 year-olds born in 1978 into low-income households: $38,464 (inflation-adjusted)
- Avg. earnings among 27 year-olds born in 1992 into low-income households: $28,486 (inflation-adjusted)
- 2023 unemployment rate: 3.7%
- Homeownership rate in 2022: 65.7%
- Poverty rate in 2022: 9.7%
- Total population: 13,910
15. Haskell County, Texas

- Long-term change in avg. earnings for 27 year-olds born into low-income households: -25.9% (-$11,017)
- Avg. earnings among 27 year-olds born in 1978 into low-income households: $42,461 (inflation-adjusted)
- Avg. earnings among 27 year-olds born in 1992 into low-income households: $31,443 (inflation-adjusted)
- 2023 unemployment rate: 3.8%
- Homeownership rate in 2022: 70.0%
- Poverty rate in 2022: 15.0%
- Total population: 5,408
14. Kenai Peninsula Borough, Alaska

- Long-term change in avg. earnings for 27 year-olds born into low-income households: -26.5% (-$10,626)
- Avg. earnings among 27 year-olds born in 1978 into low-income households: $40,172 (inflation-adjusted)
- Avg. earnings among 27 year-olds born in 1992 into low-income households: $29,546 (inflation-adjusted)
- 2023 unemployment rate: 4.7%
- Homeownership rate in 2022: 76.8%
- Poverty rate in 2022: 12.5%
- Total population: 59,235
13. Musselshell County, Montana

- Long-term change in avg. earnings for 27 year-olds born into low-income households: -26.5% (-$11,697)
- Avg. earnings among 27 year-olds born in 1978 into low-income households: $44,121 (inflation-adjusted)
- Avg. earnings among 27 year-olds born in 1992 into low-income households: $32,423 (inflation-adjusted)
- 2023 unemployment rate: 3.1%
- Homeownership rate in 2022: 80.8%
- Poverty rate in 2022: 11.8%
- Total population: 4,924
12. Latimer County, Oklahoma

- Long-term change in avg. earnings for 27 year-olds born into low-income households: -27.0% (-$10,713)
- Avg. earnings among 27 year-olds born in 1978 into low-income households: $39,736 (inflation-adjusted)
- Avg. earnings among 27 year-olds born in 1992 into low-income households: $29,024 (inflation-adjusted)
- 2023 unemployment rate: 4.7%
- Homeownership rate in 2022: 69.4%
- Poverty rate in 2022: 16.7%
- Total population: 9,537
11. Matanuska-Susitna Borough, Alaska

- Long-term change in avg. earnings for 27 year-olds born into low-income households: -27.7% (-$10,873)
- Avg. earnings among 27 year-olds born in 1978 into low-income households: $39,236 (inflation-adjusted)
- Avg. earnings among 27 year-olds born in 1992 into low-income households: $28,363 (inflation-adjusted)
- 2023 unemployment rate: 4.8%
- Homeownership rate in 2022: 76.5%
- Poverty rate in 2022: 10.2%
- Total population: 108,661
10. Colonial Heights city, Virginia

- Long-term change in avg. earnings for 27 year-olds born into low-income households: -28.4% (-$10,522)
- Avg. earnings among 27 year-olds born in 1978 into low-income households: $37,006 (inflation-adjusted)
- Avg. earnings among 27 year-olds born in 1992 into low-income households: $26,484 (inflation-adjusted)
- 2023 unemployment rate: 3.1%
- Homeownership rate in 2022: 66.4%
- Poverty rate in 2022: 10.2%
- Total population: 18,158
9. Uintah County, Utah
- Long-term change in avg. earnings for 27 year-olds born into low-income households: -29.1% (-$14,431)
- Avg. earnings among 27 year-olds born in 1978 into low-income households: $49,672 (inflation-adjusted)
- Avg. earnings among 27 year-olds born in 1992 into low-income households: $35,241 (inflation-adjusted)
- 2023 unemployment rate: 3.3%
- Homeownership rate in 2022: 73.7%
- Poverty rate in 2022: 11.6%
- Total population: 35,951
8. Walworth County, South Dakota
- Long-term change in avg. earnings for 27 year-olds born into low-income households: -29.4% (-$12,733)
- Avg. earnings among 27 year-olds born in 1978 into low-income households: $43,321 (inflation-adjusted)
- Avg. earnings among 27 year-olds born in 1992 into low-income households: $30,589 (inflation-adjusted)
- 2023 unemployment rate: 3.2%
- Homeownership rate in 2022: 73.4%
- Poverty rate in 2022: 13.2%
- Total population: 5,317
7. Dixie County, Florida

- Long-term change in avg. earnings for 27 year-olds born into low-income households: -29.6% (-$10,531)
- Avg. earnings among 27 year-olds born in 1978 into low-income households: $35,563 (inflation-adjusted)
- Avg. earnings among 27 year-olds born in 1992 into low-income households: $25,032 (inflation-adjusted)
- 2023 unemployment rate: 3.6%
- Homeownership rate in 2022: 83.0%
- Poverty rate in 2022: 16.1%
- Total population: 16,737
6. Roberts County, South Dakota
- Long-term change in avg. earnings for 27 year-olds born into low-income households: -30.0% (-$11,434)
- Avg. earnings among 27 year-olds born in 1978 into low-income households: $38,127 (inflation-adjusted)
- Avg. earnings among 27 year-olds born in 1992 into low-income households: $26,693 (inflation-adjusted)
- 2023 unemployment rate: 3.1%
- Homeownership rate in 2022: 67.9%
- Poverty rate in 2022: 20.8%
- Total population: 10,242
5. Letcher County, Kentucky

- Long-term change in avg. earnings for 27 year-olds born into low-income households: -30.2% (-$11,375)
- Avg. earnings among 27 year-olds born in 1978 into low-income households: $37,717 (inflation-adjusted)
- Avg. earnings among 27 year-olds born in 1992 into low-income households: $26,342 (inflation-adjusted)
- 2023 unemployment rate: 6.3%
- Homeownership rate in 2022: 74.0%
- Poverty rate in 2022: 29.0%
- Total population: 21,490
4. Thurston County, Nebraska

- Long-term change in avg. earnings for 27 year-olds born into low-income households: -32.5% (-$10,506)
- Avg. earnings among 27 year-olds born in 1978 into low-income households: $32,320 (inflation-adjusted)
- Avg. earnings among 27 year-olds born in 1992 into low-income households: $21,814 (inflation-adjusted)
- 2023 unemployment rate: 2.7%
- Homeownership rate in 2022: 60.9%
- Poverty rate in 2022: 19.0%
- Total population: 6,716
3. Leslie County, Kentucky

- Long-term change in avg. earnings for 27 year-olds born into low-income households: -34.7% (-$13,923)
- Avg. earnings among 27 year-olds born in 1978 into low-income households: $40,151 (inflation-adjusted)
- Avg. earnings among 27 year-olds born in 1992 into low-income households: $26,227 (inflation-adjusted)
- 2023 unemployment rate: 6.9%
- Homeownership rate in 2022: 86.8%
- Poverty rate in 2022: 33.6%
- Total population: 10,468
2. Charles Mix County, South Dakota

- Long-term change in avg. earnings for 27 year-olds born into low-income households: -38.2% (-$19,107)
- Avg. earnings among 27 year-olds born in 1978 into low-income households: $50,051 (inflation-adjusted)
- Avg. earnings among 27 year-olds born in 1992 into low-income households: $30,944 (inflation-adjusted)
- 2023 unemployment rate: 2.2%
- Homeownership rate in 2022: 73.9%
- Poverty rate in 2022: 22.9%
- Total population: 9,302
1. Bethel Census Area, Alaska

- Long-term change in avg. earnings for 27 year-olds born into low-income households: -48.4% (-$12,290)
- Avg. earnings among 27 year-olds born in 1978 into low-income households: $25,383 (inflation-adjusted)
- Avg. earnings among 27 year-olds born in 1992 into low-income households: $13,093 (inflation-adjusted)
- 2023 unemployment rate: 9.7%
- Homeownership rate in 2022: 59.0%
- Poverty rate in 2022: 25.3%
- Total population: 18,538