Investing
Despite S&P 500 Earnings Drag of Energy & Materials, Market Still No Bargain After Sell-Off

Published:
Last Updated:

Now that earnings season is well into its second half, 24/7 Wall St. wanted to look at some of the core earnings power of the S&P 500 based on actual earnings seen so far. A majority of the S&P 500 has given earnings for the fourth calendar quarter, so we have a good snapshot of what earnings season will really tell for 2016. Things look truly awful here, but the real pressure has been from the energy and materials sectors. Without those severe drops, the S&P earnings trends actually would be positive. Another issue to consider is that the recent sell-off just has not taken the stock market into bargain territory.
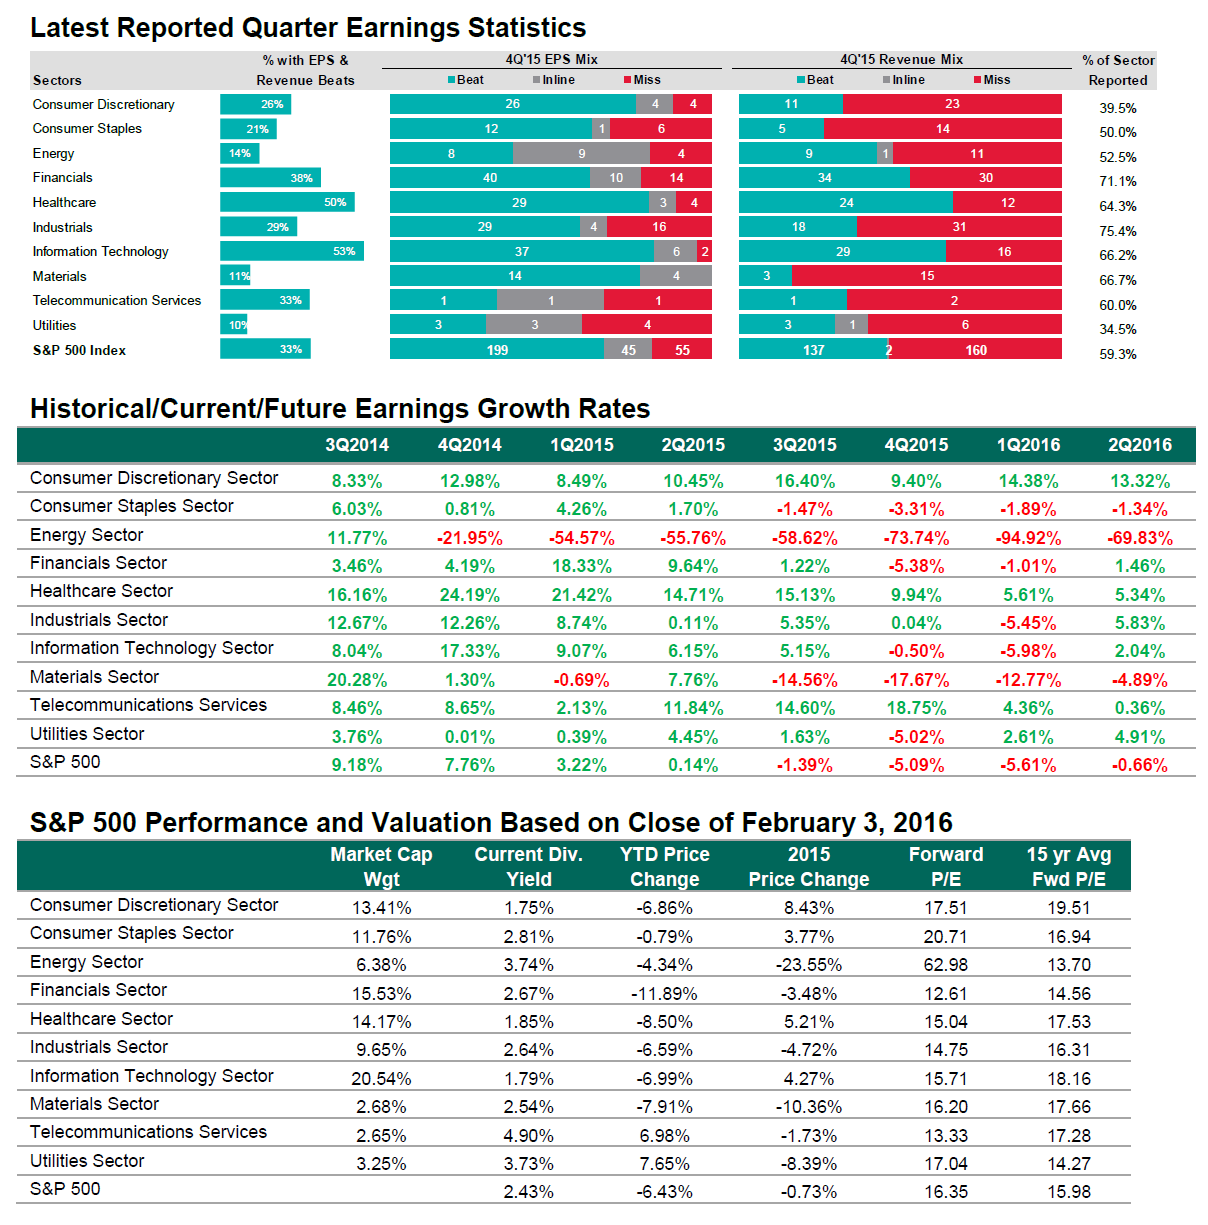
S&P Global Market Intelligence sent us some great data for fourth-quarter earnings trends. All in all, the S&P 500’s aggregate earnings per share (EPS) of $29.00 for the fourth quarter was down 5.09% from the fourth quarter of 2014. Still, this represents a 128 basis point improvement from where growth bottomed on January 27.
On a sector by sector view, energy has been the biggest part of the decline, with a drop of 73.7% in EPS, and the materials sector was down by 17.7% from the prior year. Telecom services rose the most, with an 18.75% gain.
Only four of the 10 S&P sectors are expected to post positive earnings growth for the fourth quarter. In reality, this should be only three of 10 that are up worth noticing. Telecom’s 18.8% growth is expected to be followed by health care at 9.9% and consumer discretionary at 9.4%. The gain of 0.04% expected in industrials just seems too small to even count as positive.
Earnings were expected to be negative for energy and materials, with other drops as follows: financials (-5.4%), utilities (-5.0%) and consumer staples (-3.3%). Information tech is expected to be -0.5%.
S&P Global Market Intelligence now says that the S&P 500 is trading at about 16.35 times its forward 12 month price-to-earnings (P/E) ratio with 2016 estimates at $120.36 EPS (versus $116.91 EPS for 2015, for a trailing 16.14 P/E). Unfortunately, the selling hasn’t made the market cheap yet either. S&P Capital IQ pointed out that the 16.4 multiple is still a slight premium to its 15-year average of almost 16 (actually 15.98).
If we take what S&P said by sector as gospel, this market is only cheap if earnings power comes back fast in energy and materials. The harsh reality is that finding very many energy and materials bulls for real sector recoveries versus equity trading bounces is just no easy task at this time.
Still, there are some concerns for 2016’s estimates. S&P Global Market Intelligence sees revenues falling 5.7% for energy in 2016 after a 35% drop in 2015. The materials sector is expected to see revenues drop 3.8% in 2016 versus a drop of 13.8% in 2015. The energy sector’s EPS are expected to drop to $7.28 in 2016 from $17.90 in 2015, and the materials sector is expected to see earnings actually tick back up to $16.25 per share in 2016 from $15.93 in 2015. What if these expectations both prove to be too rosy in 2016?
Maybe the market is not expensive at this time. It just isn’t cheap enough to get investors very excited, particularly if the recession predictions start to get a little more vocal. Now think about these issues:

The thought of burdening your family with a financial disaster is most Americans’ nightmare. However, recent studies show that over 100 million Americans still don’t have proper life insurance in the event they pass away.
Life insurance can bring peace of mind – ensuring your loved ones are safeguarded against unforeseen expenses and debts. With premiums often lower than expected and a variety of plans tailored to different life stages and health conditions, securing a policy is more accessible than ever.
A quick, no-obligation quote can provide valuable insight into what’s available and what might best suit your family’s needs. Life insurance is a simple step you can take today to help secure peace of mind for your loved ones tomorrow.
Click here to learn how to get a quote in just a few minutes.
Thank you for reading! Have some feedback for us?
Contact the 24/7 Wall St. editorial team.