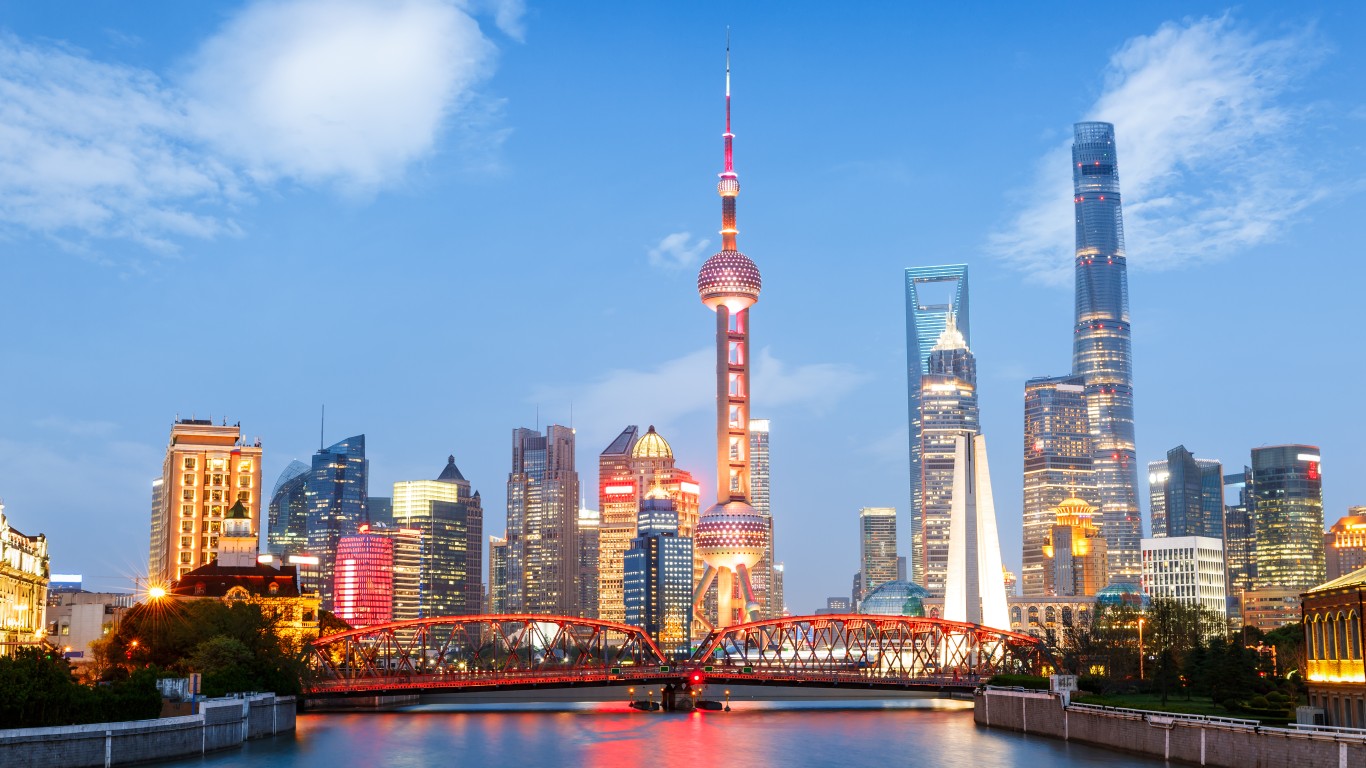
The last two decades have marked a period of swift economic advancement in China. From 2001 to 2021, China’s gross domestic product expanded by over 1,200%, soaring from $1.34 trillion to $17.73 trillion in current U.S. dollars. Simultaneously, the percentage of the Chinese populace living in poverty – defined as earning less than $5.50 U.S. dollars daily – dwindled from 86.9% to under 25%..
The momentum in Chinese GDP growth stemmed from a sequence of economic overhauls instigated in 1979. These adjustments led to heightened capital investment and enhancements in efficiency. However, despite positioning itself among the globe’s speediest expanding economies, China remains notably distant from the United States in GDP per capita, one gauge of personal prosperity.
Even in China’s most affluent metropolises, the quality of life significantly trails that of America’s most prosperous cities, although several cities are starting to narrow the gap.
Using data from Sina Finance, the China Statistical Yearbook 2022, and the U.S. Bureau of Economic Analysis, 24/7 Wall St. compared GDP in the 20 wealthiest Chinese and the 20 wealthiest American metropolitan. GDP is expressed in 2021 U.S. dollars. 24/7 Wall St. also calculated GDP per capita for each city.
Each of the 20 wealthiest U.S. cities by GDP has greater overall economic output than its Chinese counterpart, by anywhere from about 21% to nearly 200% higher. Additionally, with only a handful of exceptions, the 20 wealthiest American cities have a smaller population base than the comparably ranked Chinese city. (Here is a look at the richest county in every state.)
As a result, Americans living in the wealthiest U.S. cities are, on average, more prosperous than the Chinese residing in China’s wealthiest cities. Among the 20 U.S. cities on this list, GDP per capita ranges from $45,815 to $210,236. Meanwhile, GDP per capita in the 20 Chinese cities on this list ranges from $17,638 to $65,466.
Only two of China’s wealthiest cities have a higher GDP per capita than their comparably ranked American metro. Fuzhou, Fujian, the 20th wealthiest city in China, and Wuxi, Jiangsu, the 14th wealthiest Chinese city, have a higher GDP per capita than Riverside-San Bernardino-Ontario, California and Phoenix-Mesa-Chandler, Arizona, the 20th and 14th wealthiest American cities, respectively. (Here is a look at the 27 poorest nations on Earth.)
Click here to see how the richest Chinese cities compare to US.
Click here to read our detailed methodology.

20. Fuzhou, Fujian
> GDP, 2021: $175.5 billion – 20th highest in China
> Population, 2021: 3,764,559
> GDP per capita: $46,631
[in-text-ad]
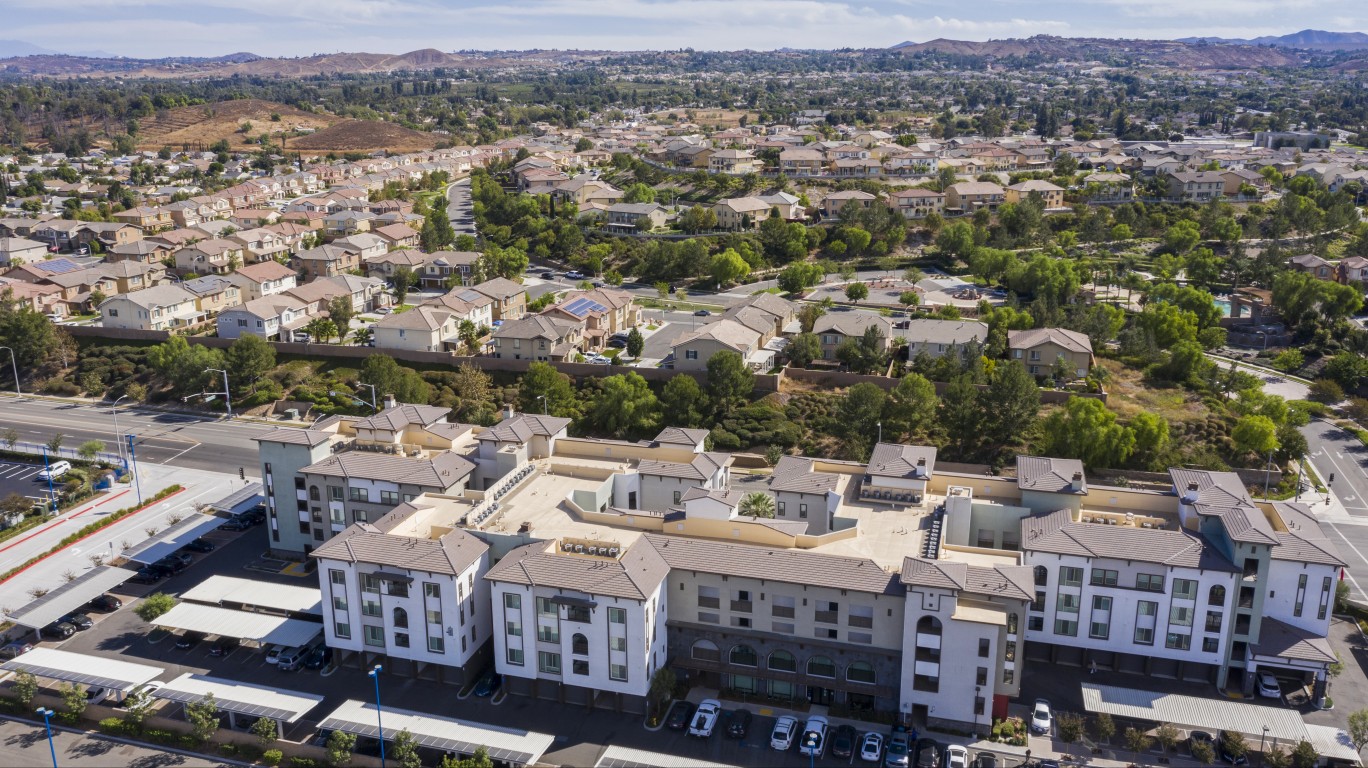
20. Riverside-San Bernardino-Ontario, CA
> GDP, 2021: $213.2 billion – 20th highest in the US
> Population, 2021: 4,653,105
> GDP per capita: $45,815
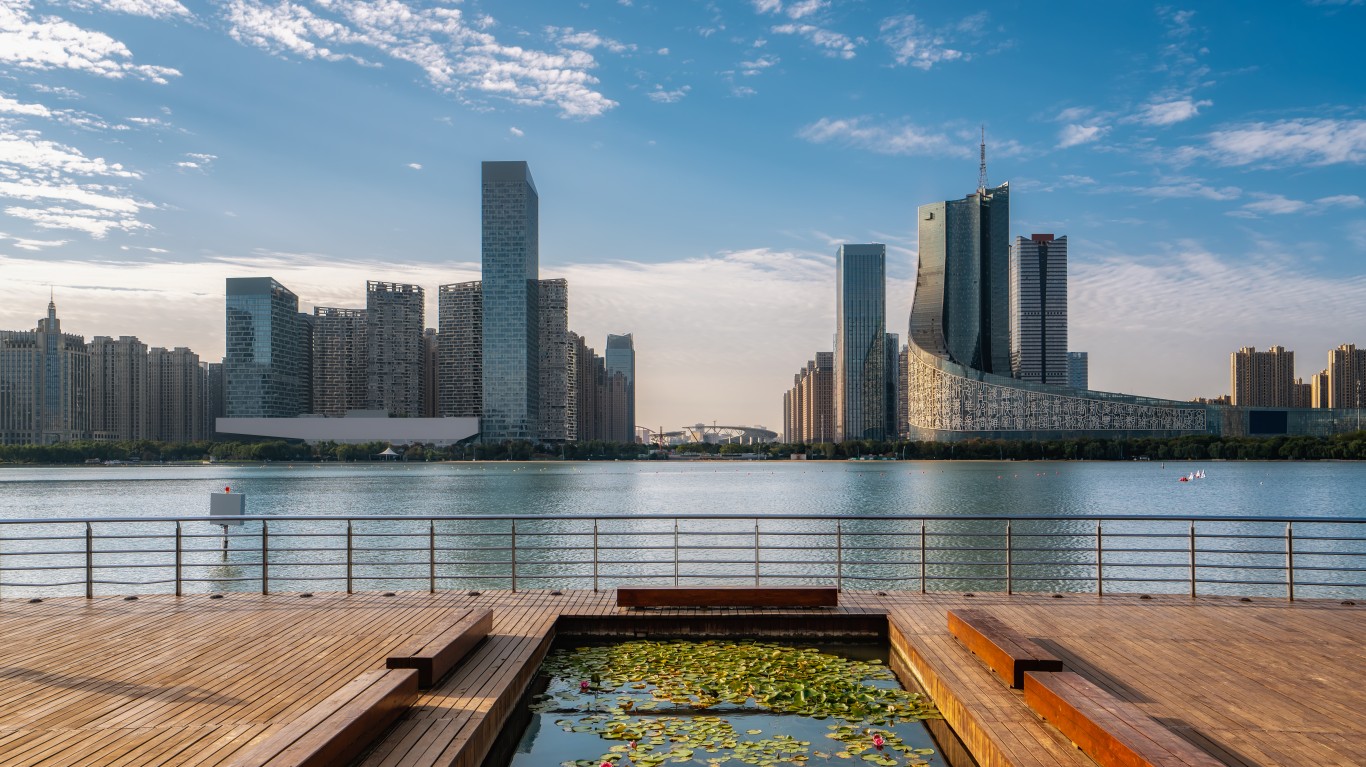
19. Hefei, Anhui
> GDP, 2021: $176.9 billion – 19th highest in China
> Population, 2021: 4,371,005
> GDP per capita: $40,477
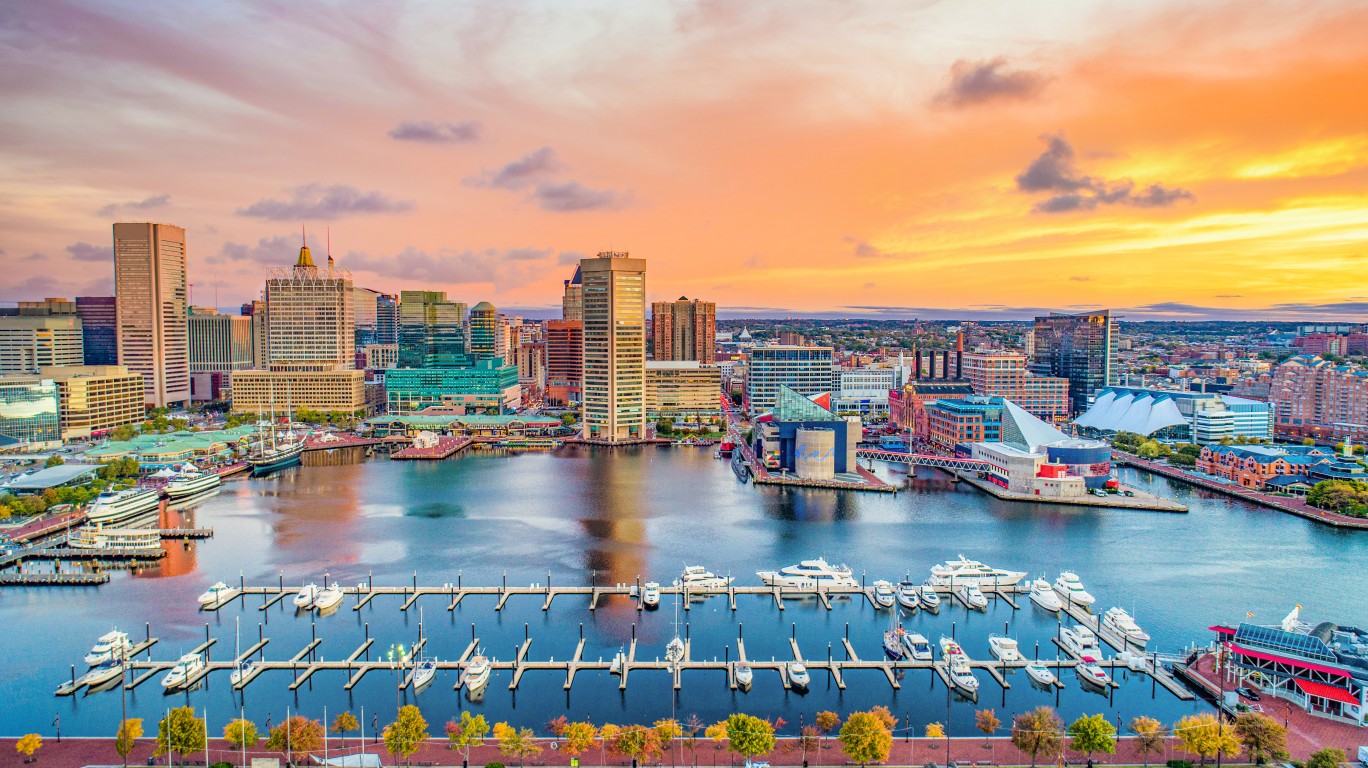
19. Baltimore-Columbia-Towson, MD
> GDP, 2021: $223.0 billion – 19th highest in the US
> Population, 2021: 2,838,327
> GDP per capita: $78,556
[in-text-ad-2]
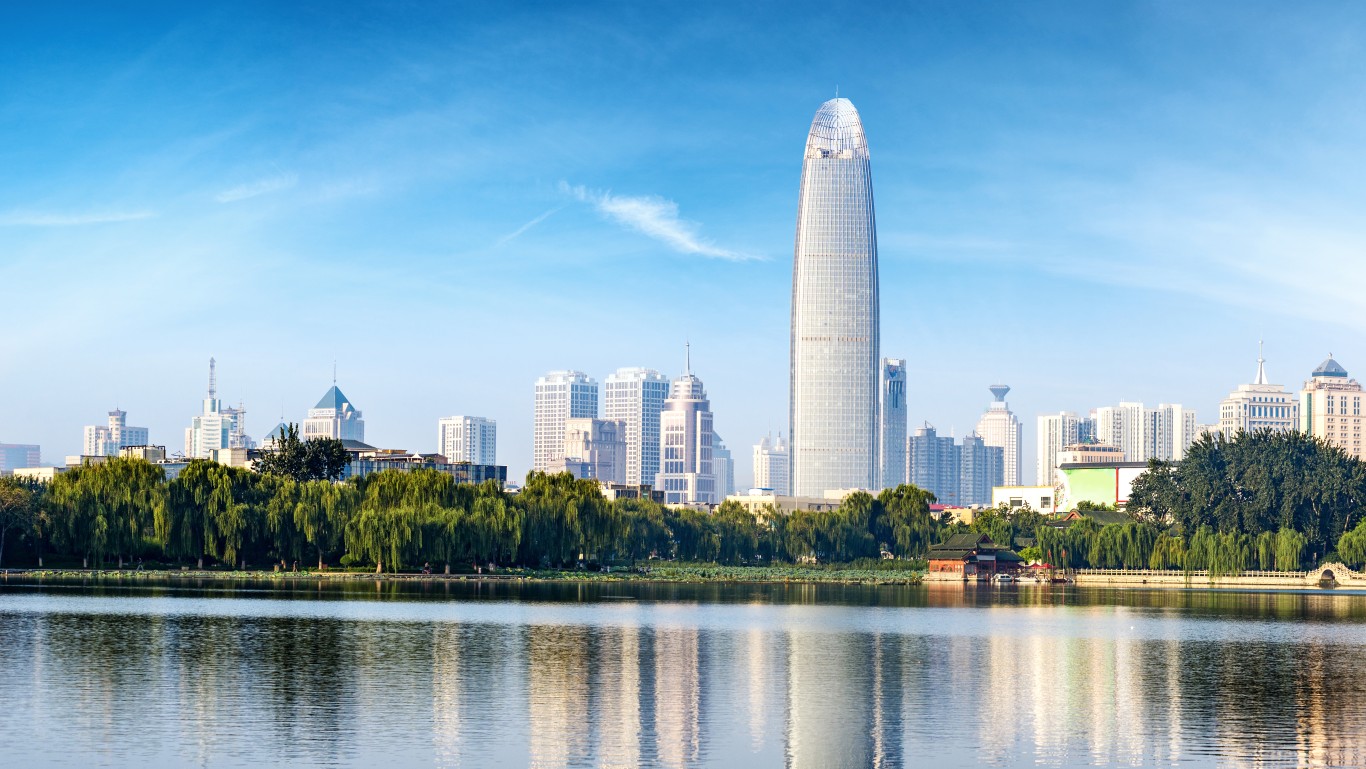
18. Jinan, Shandong
> GDP, 2021: $177.2 billion – 18th highest in China
> Population, 2021: 5,513,597
> GDP per capita: $32,142

18. Denver-Aurora-Lakewood, CO
> GDP, 2021: $253.4 billion – 18th highest in the US
> Population, 2021: 2,972,567
> GDP per capita: $85,246
[in-text-ad]
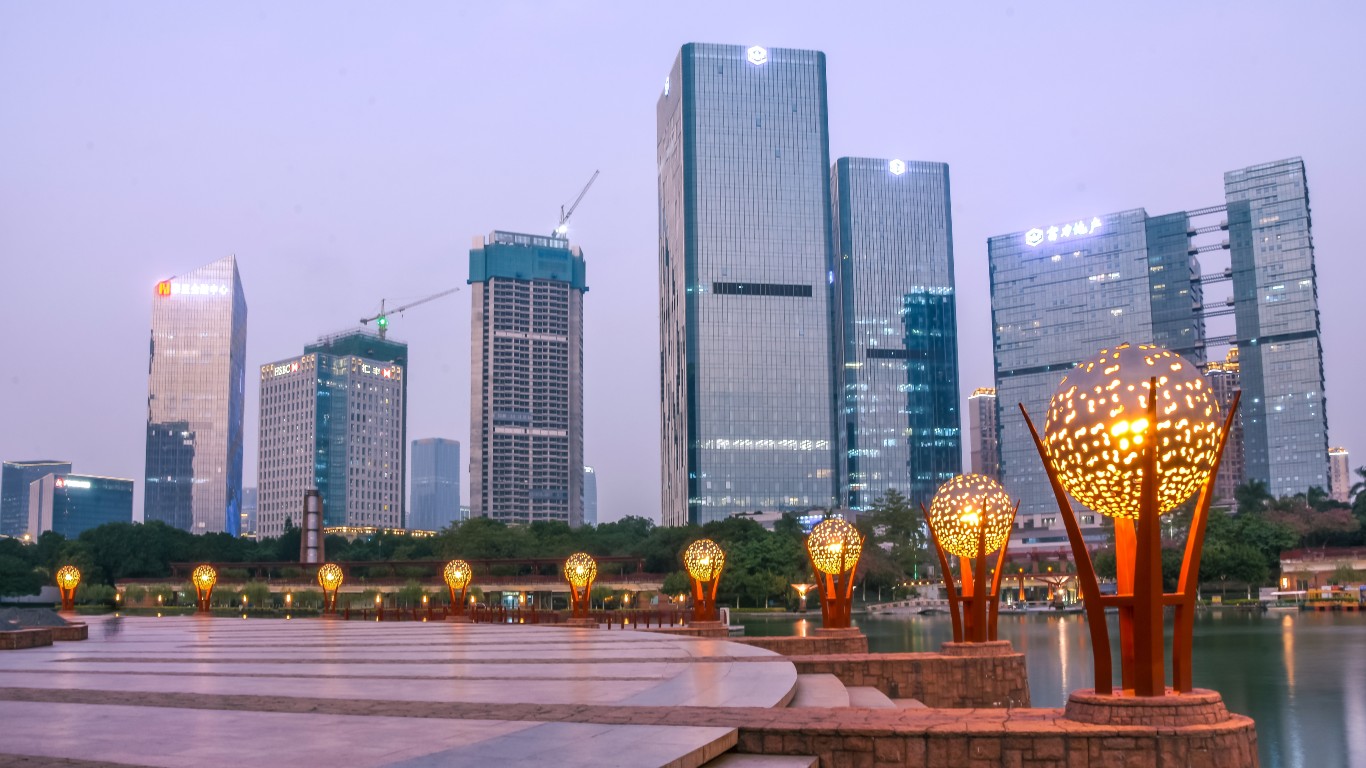
17. Foshan, Guangdong
> GDP, 2021: $188.5 billion – 17th highest in China
> Population, 2021: 7,406,751
> GDP per capita: $25,450
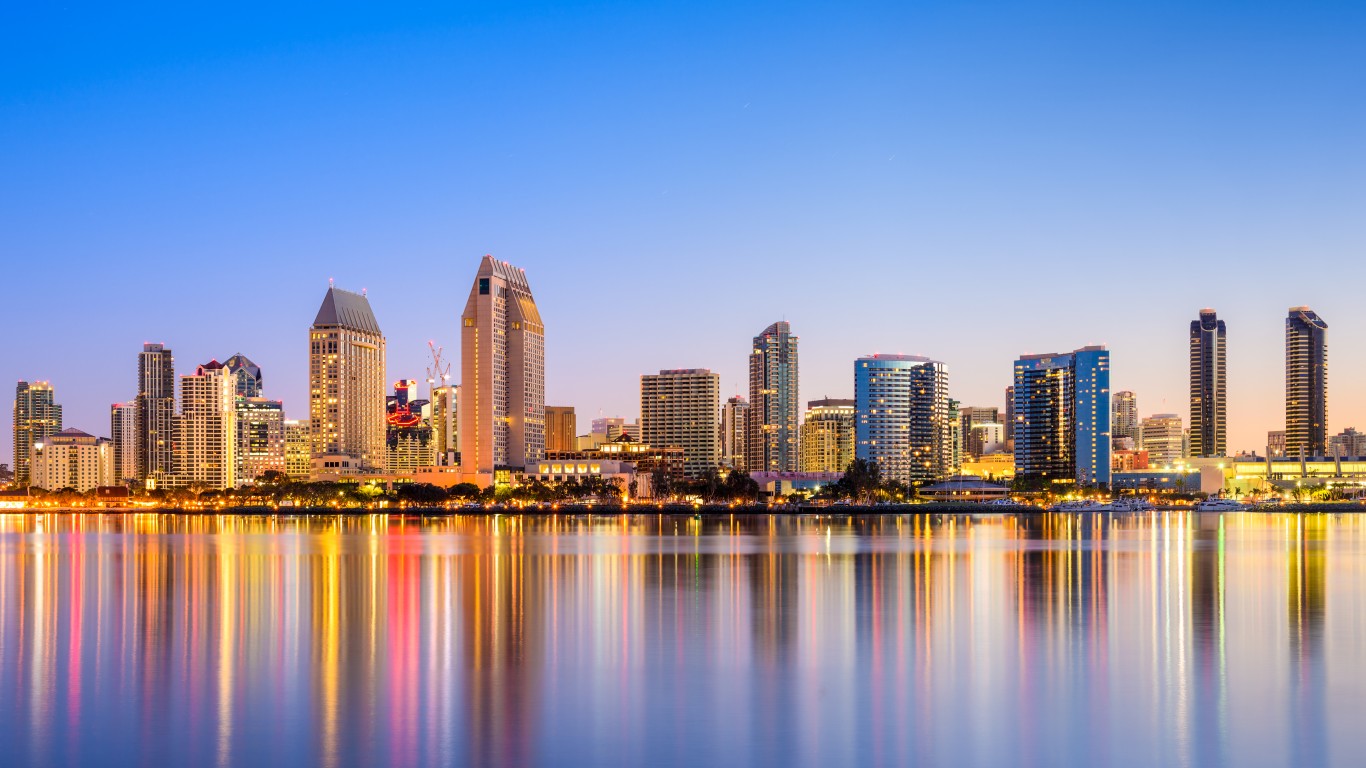
17. San Diego-Chula Vista-Carlsbad, CA
> GDP, 2021: $268.0 billion – 17th highest in the US
> Population, 2021: 3,286,069
> GDP per capita: $81,548
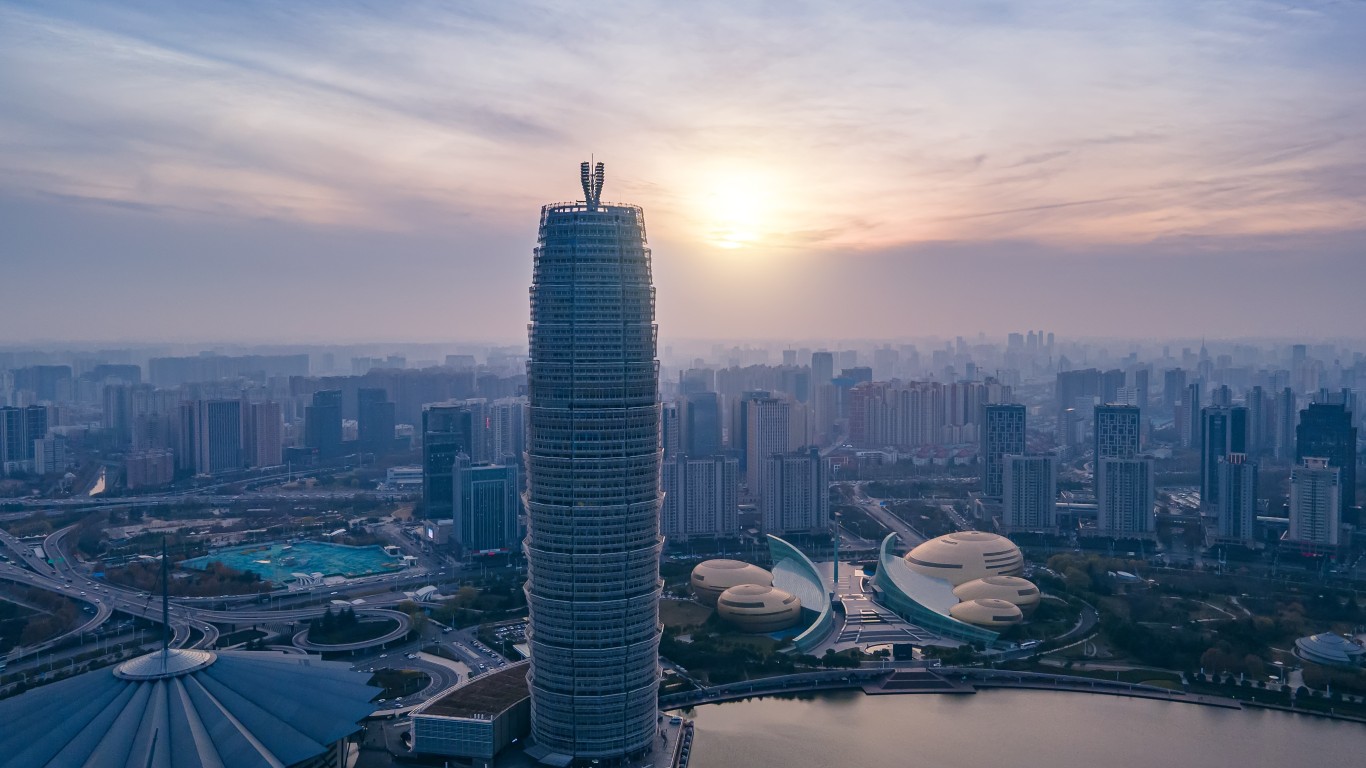
16. Zhengzhou, Henan
> GDP, 2021: $196.7 billion – 16th highest in China
> Population, 2021: 5,510,341
> GDP per capita: $35,703
[in-text-ad-2]
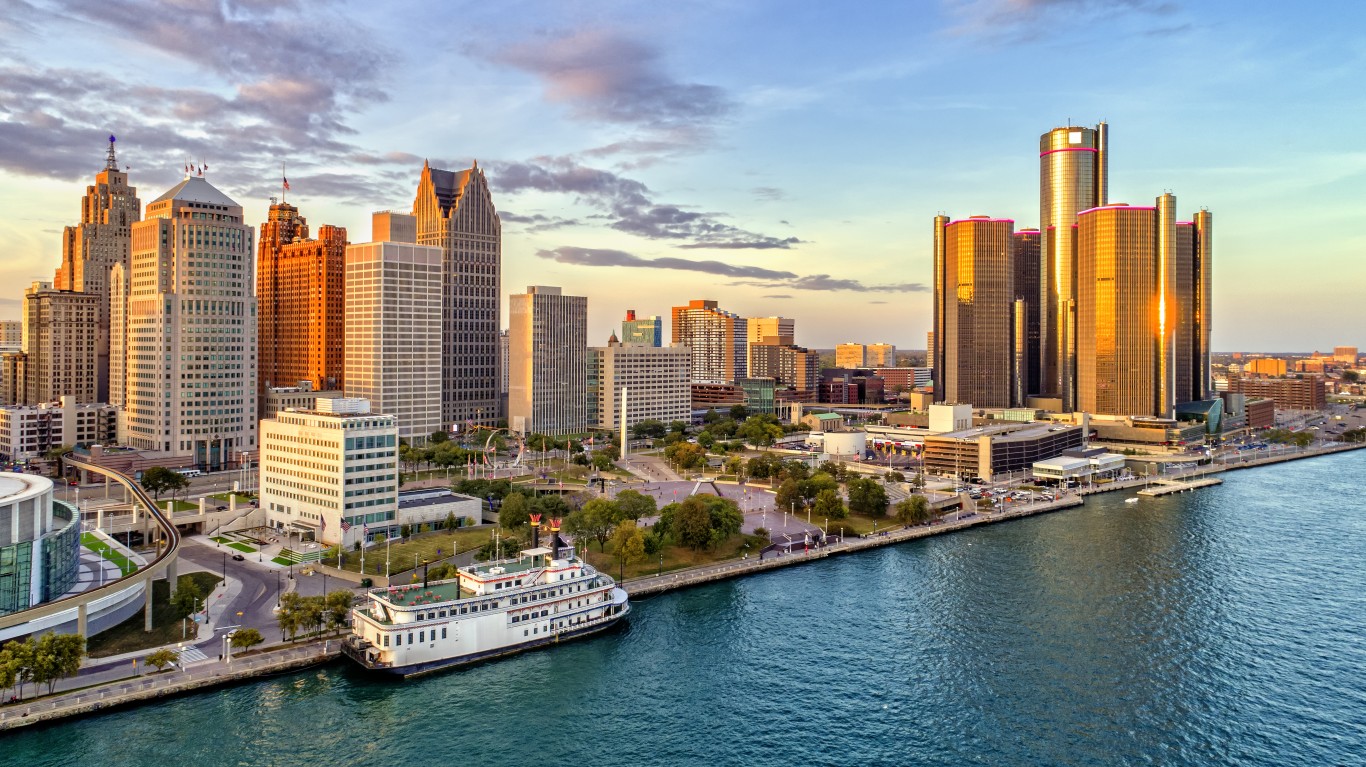
16. Detroit-Warren-Dearborn, MI
> GDP, 2021: $283.7 billion – 16th highest in the US
> Population, 2021: 4,365,205
> GDP per capita: $64,982

15. Changsha, Hunan
> GDP, 2021: $205.7 billion – 15th highest in China
> Population, 2021: 4,694,722
> GDP per capita: $43,821
[in-text-ad]
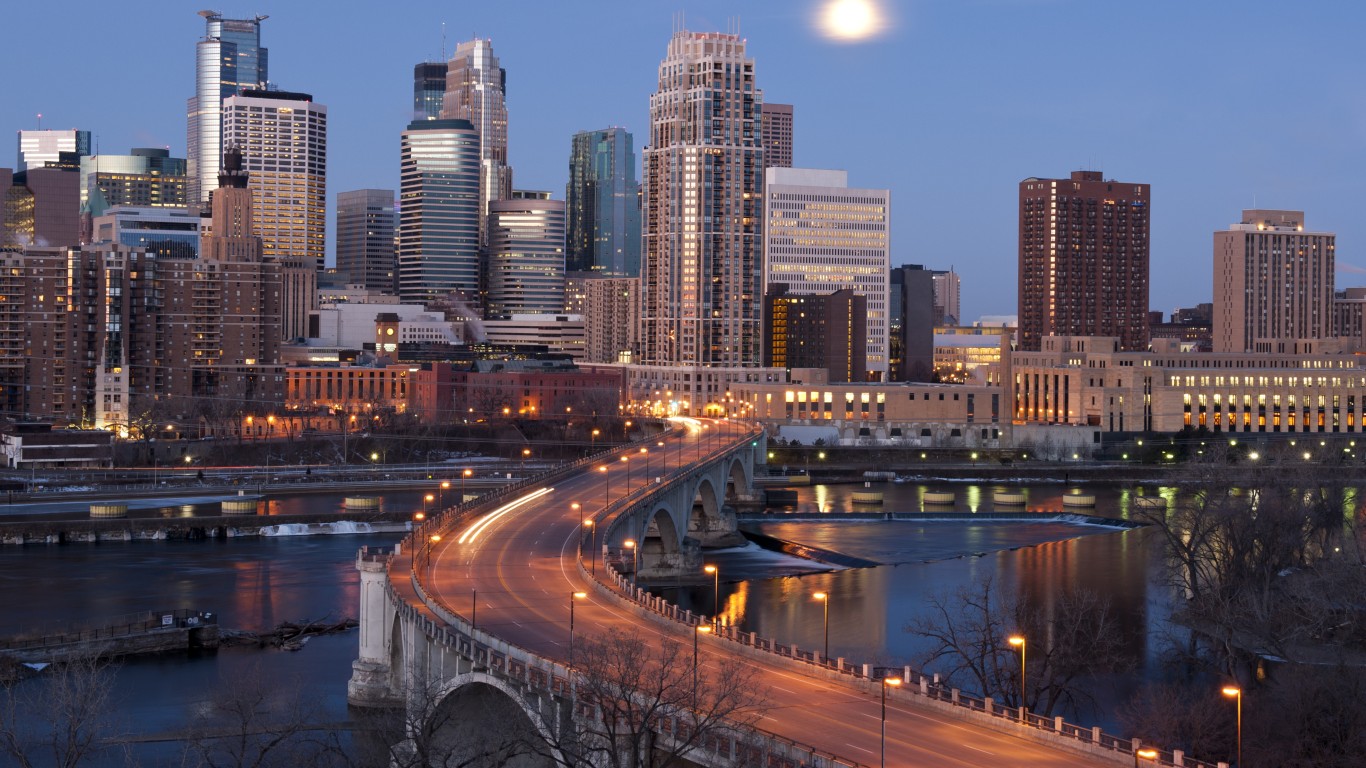
15. Minneapolis-St. Paul-Bloomington, MN-WI
> GDP, 2021: $297.0 billion – 15th highest in the US
> Population, 2021: 3,690,512
> GDP per capita: $80,468
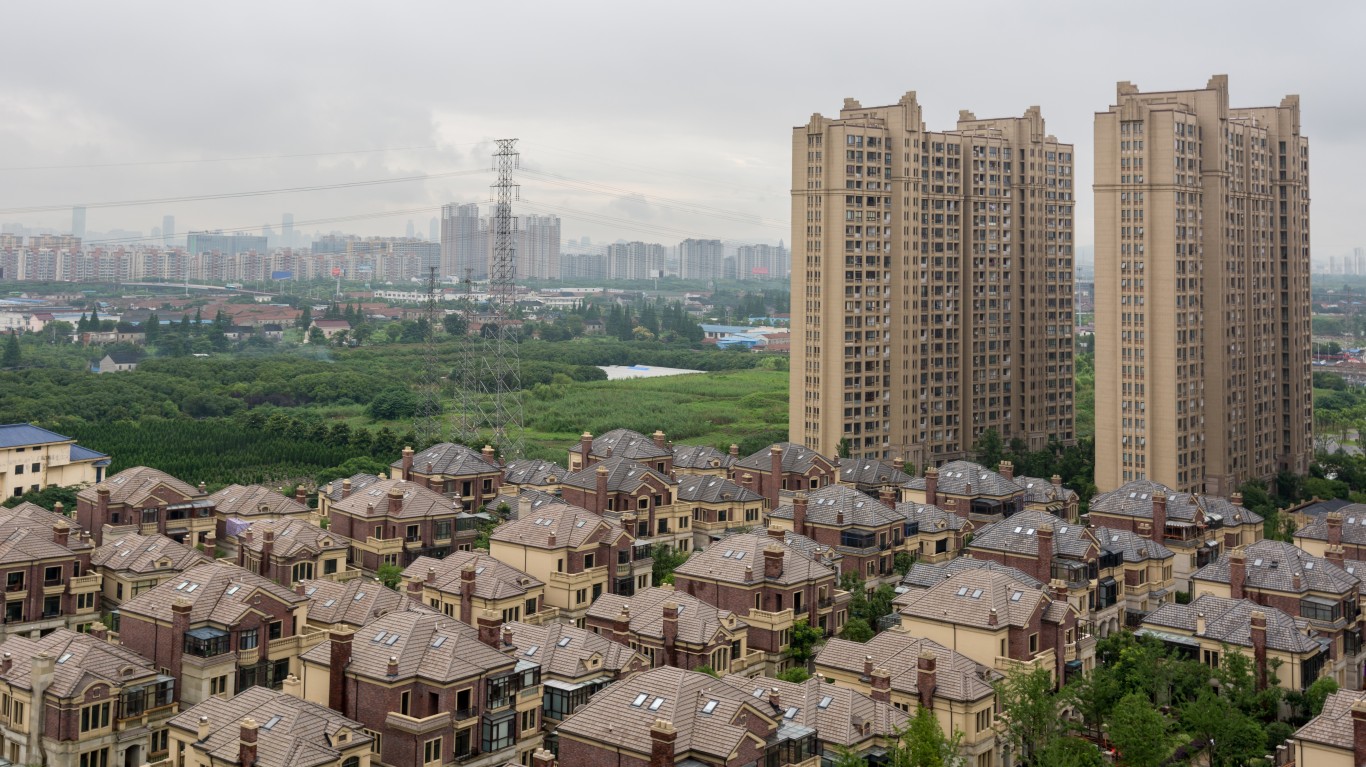
14. Wuxi, Jiangsu
> GDP, 2021: $217.0 billion – 14th highest in China
> Population, 2021: 3,315,113
> GDP per capita: $65,466
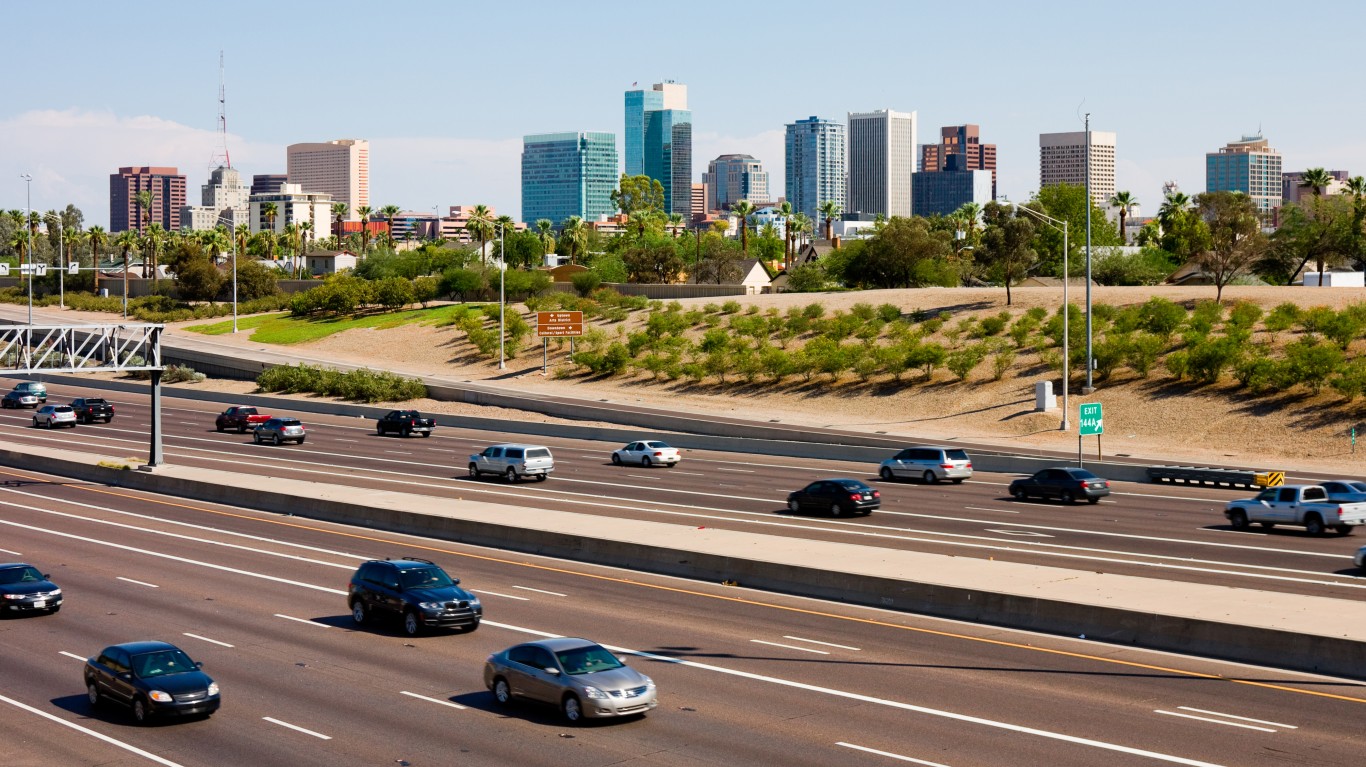
14. Phoenix-Mesa-Chandler, AZ
> GDP, 2021: $316.1 billion – 14th highest in the US
> Population, 2021: 4,946,145
> GDP per capita: $63,906
[in-text-ad-2]
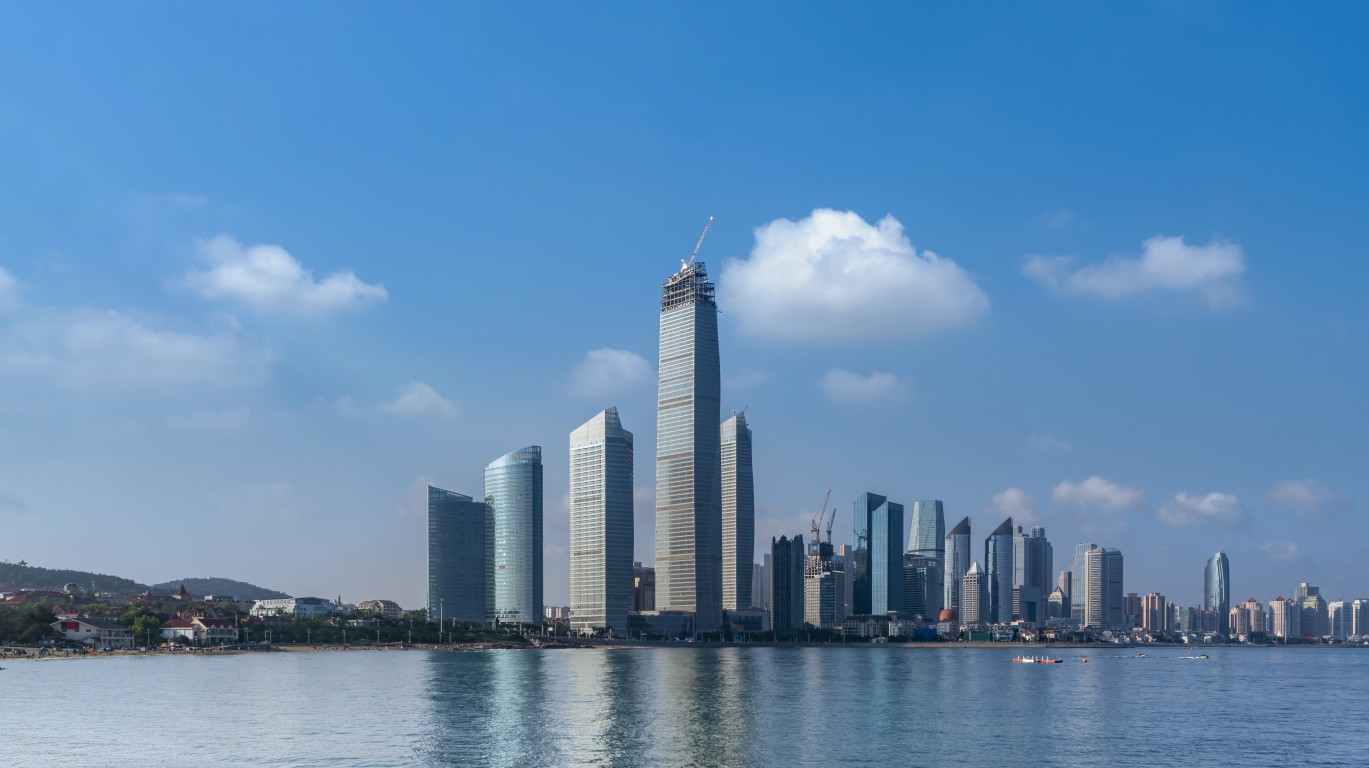
13. Qingdao, Shandong
> GDP, 2021: $219.1 billion – 13th highest in China
> Population, 2021: 5,742,486
> GDP per capita: $38,160
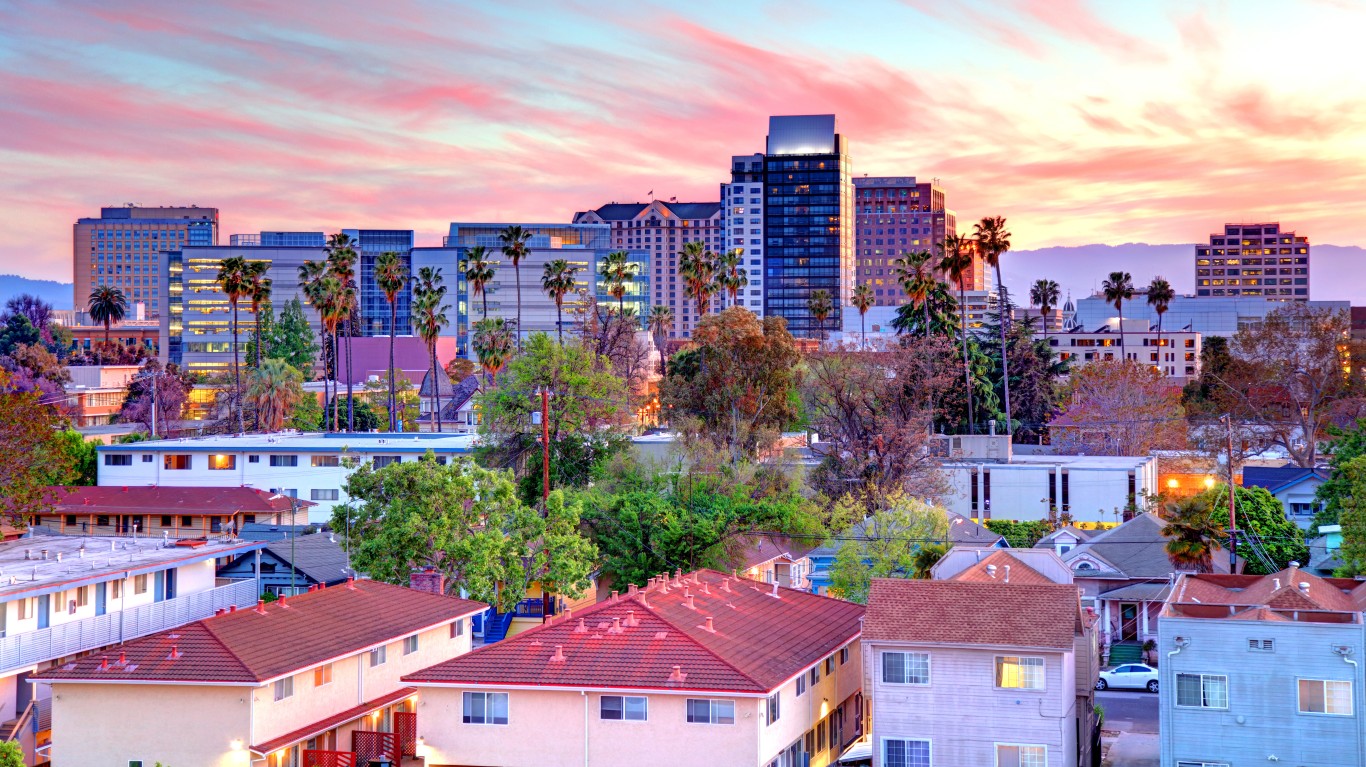
13. San Jose-Sunnyvale-Santa Clara, CA
> GDP, 2021: $410.4 billion – 13th highest in the US
> Population, 2021: 1,952,185
> GDP per capita: $210,235
[in-text-ad]
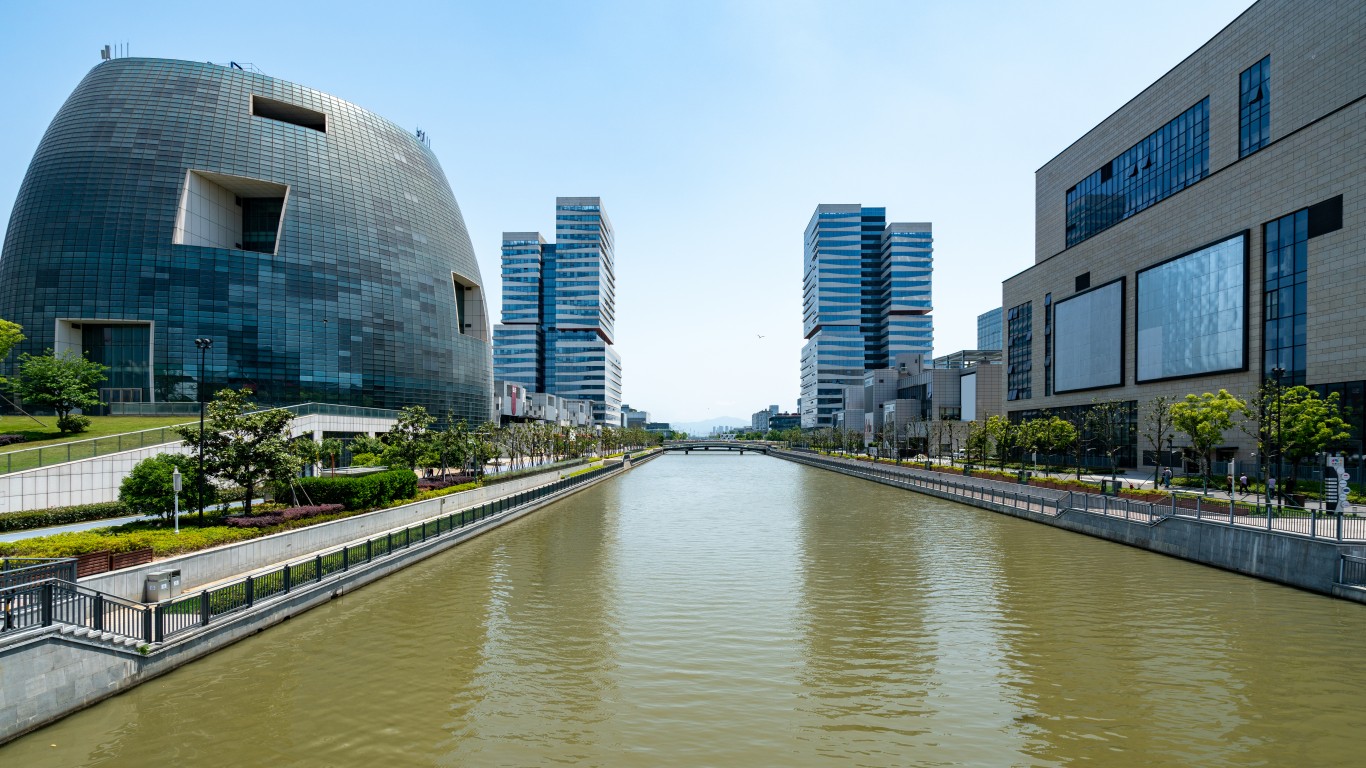
12. Ningbo, Zhejiang
> GDP, 2021: $226.3 billion – 12th highest in China
> Population, 2021: 4,263,843
> GDP per capita: $53,063

12. Miami-Fort Lauderdale-Pompano Beach, FL
> GDP, 2021: $417.1 billion – 12th highest in the US
> Population, 2021: 6,091,747
> GDP per capita: $68,478

11. Tianjin, municipality
> GDP, 2021: $243.3 billion – 11th highest in China
> Population, 2021: 13,794,450
> GDP per capita: $17,638
[in-text-ad-2]
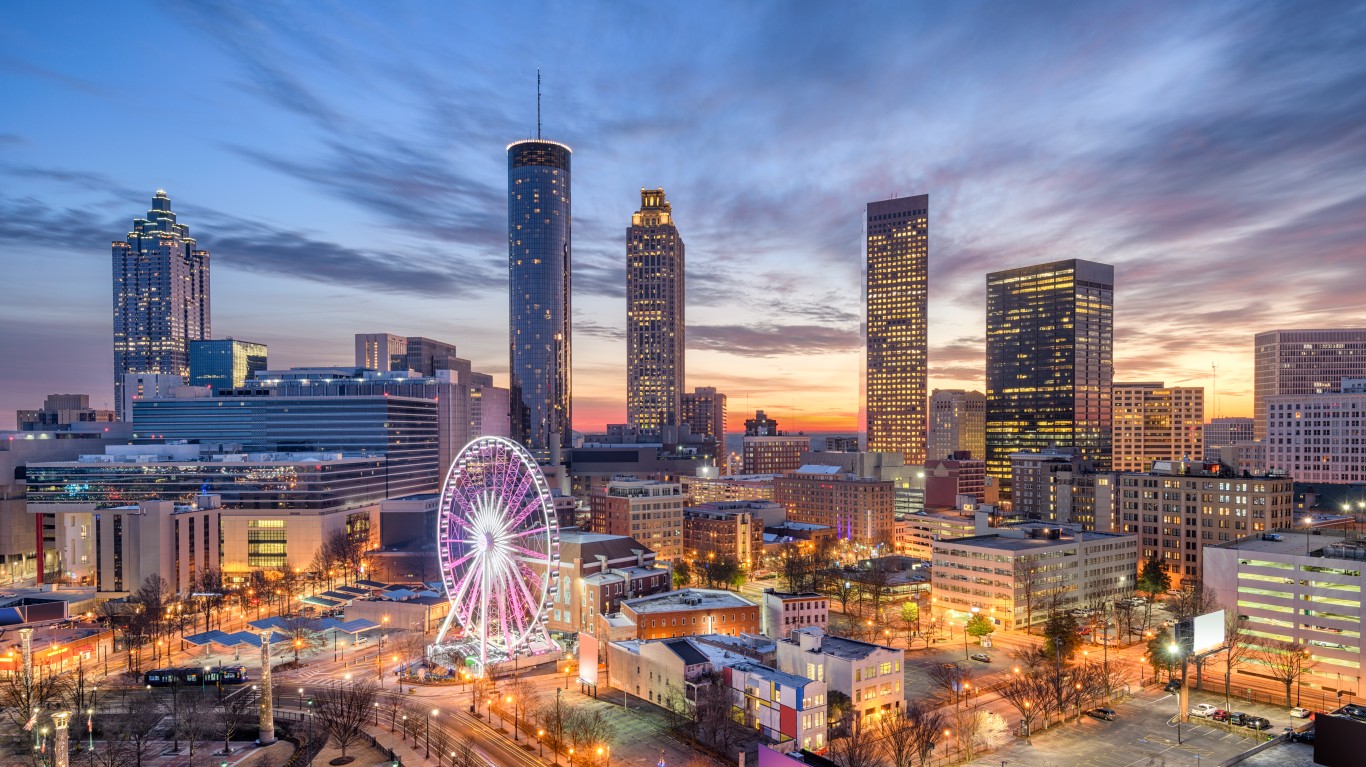
11. Atlanta-Sandy Springs-Alpharetta, GA
> GDP, 2021: $473.8 billion – 11th highest in the US
> Population, 2021: 6,144,970
> GDP per capita: $77,108

10. Nanjing, Jiangsu
> GDP, 2021: $253.5 billion – 10th highest in China
> Population, 2021: 9,143,980
> GDP per capita: $27,729
[in-text-ad]
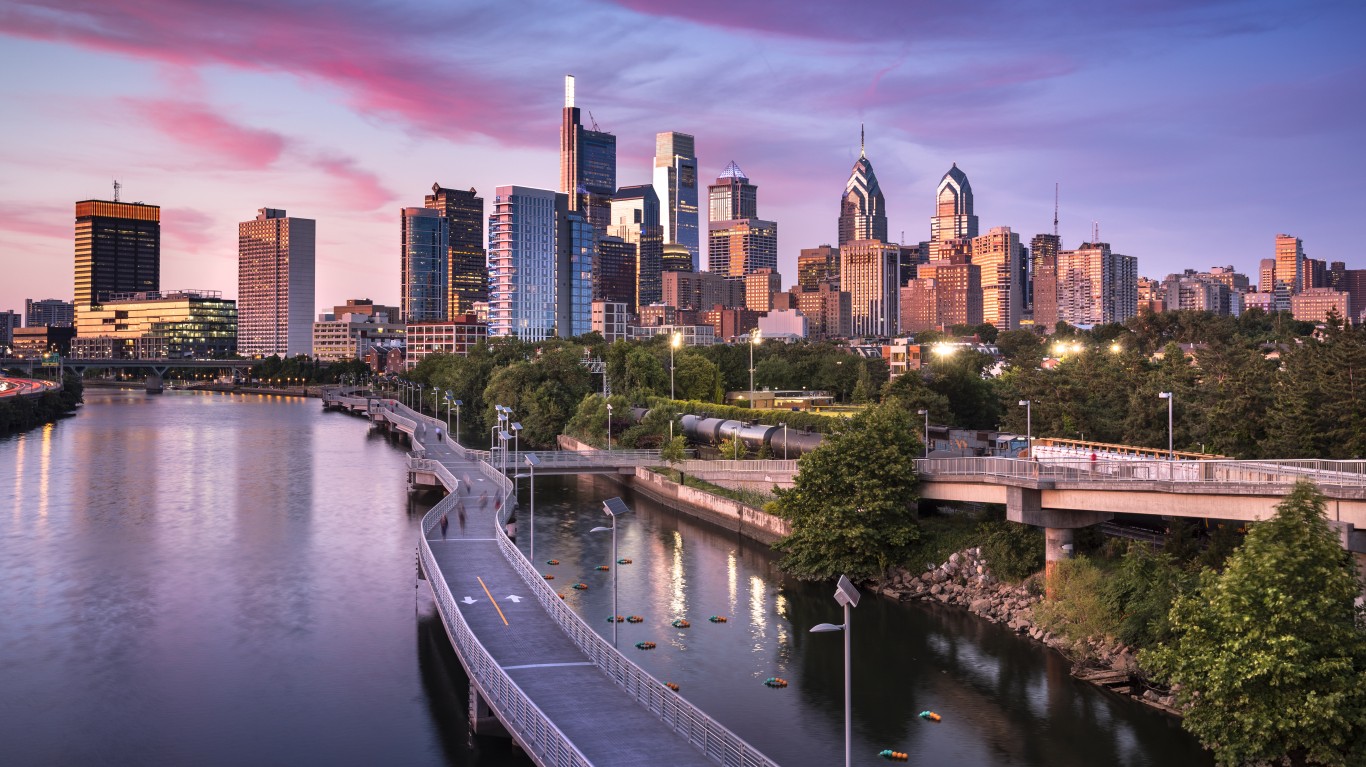
10. Philadelphia-Camden-Wilmington, PA-NJ-DE-MD
> GDP, 2021: $477.6 billion – 10th highest in the US
> Population, 2021: 6,228,601
> GDP per capita: $76,675
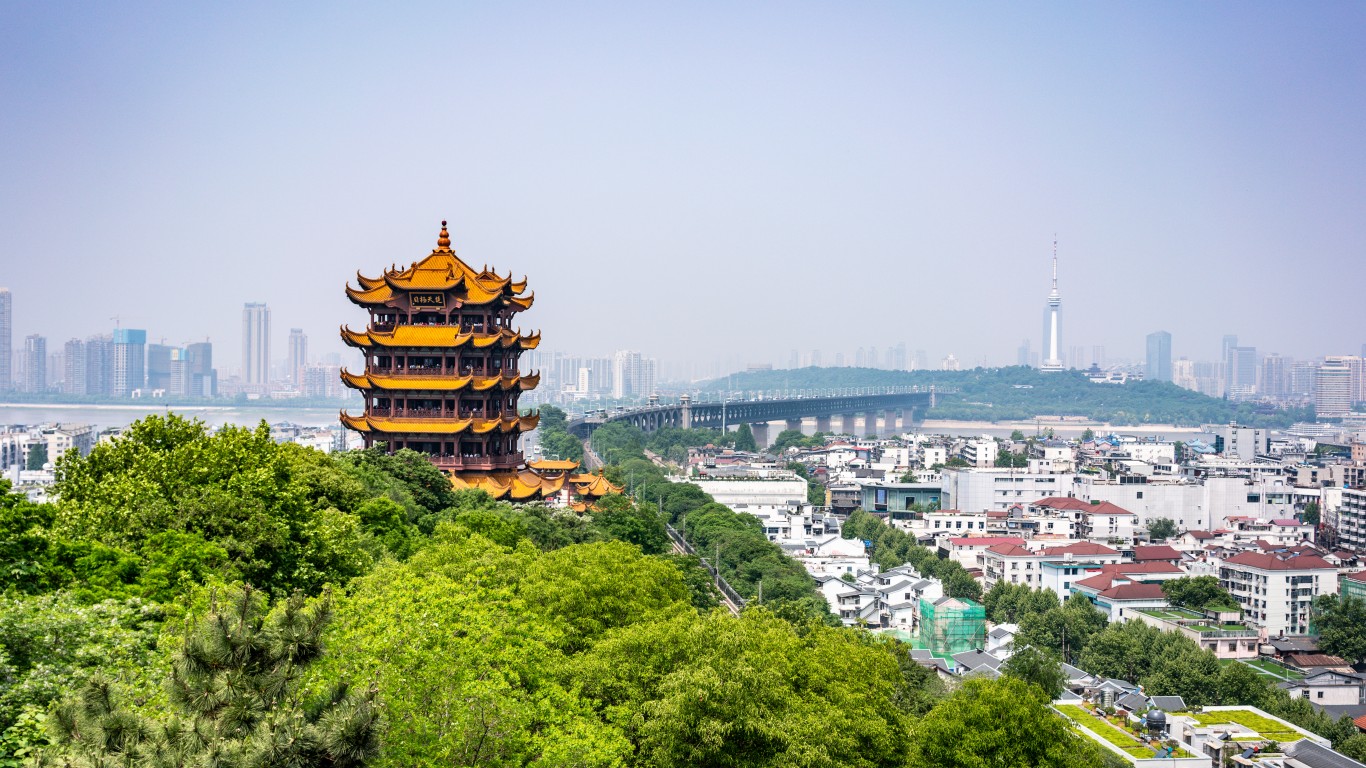
9. Wuhan, Hubei
> GDP, 2021: $274.6 billion – 9th highest in China
> Population, 2021: 8,473,405
> GDP per capita: $32,413
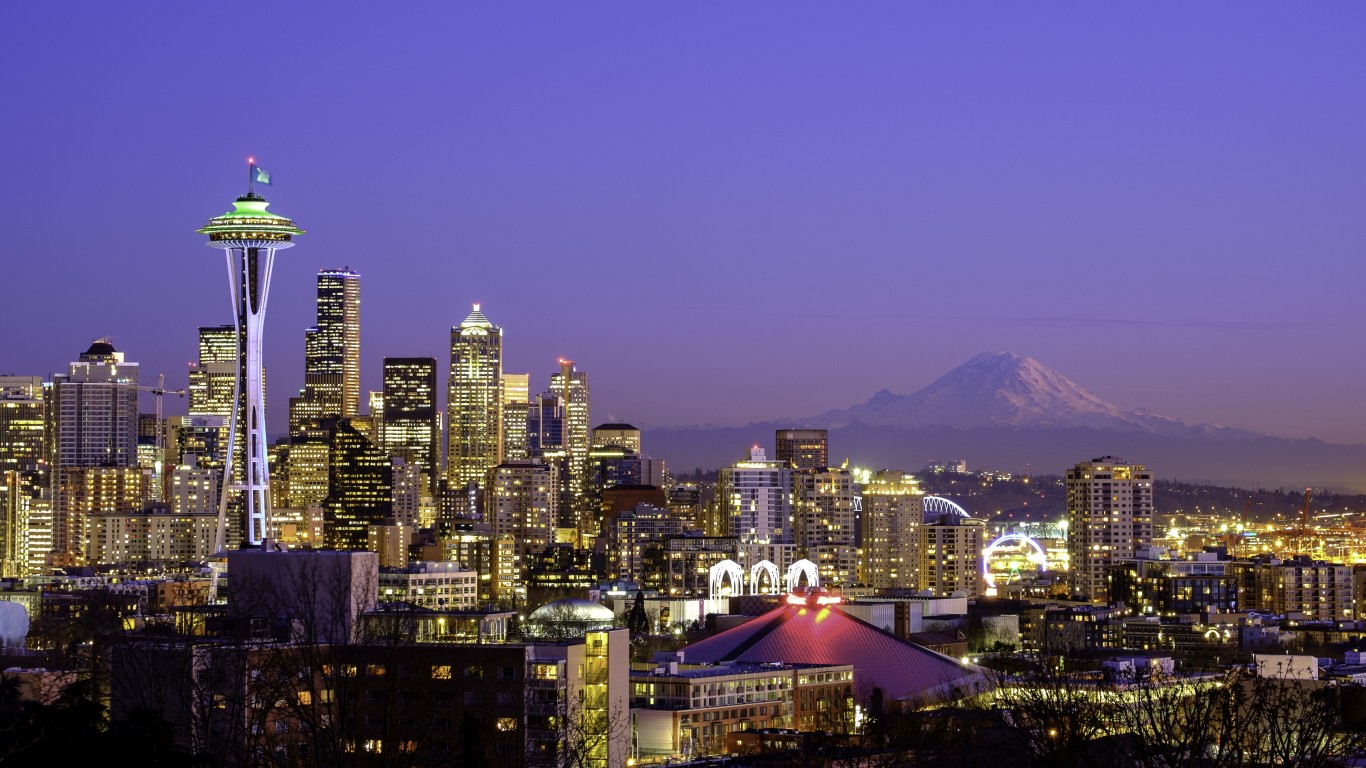
9. Seattle-Tacoma-Bellevue, WA
> GDP, 2021: $480.0 billion – 9th highest in the US
> Population, 2021: 4,011,553
> GDP per capita: $119,646
[in-text-ad-2]
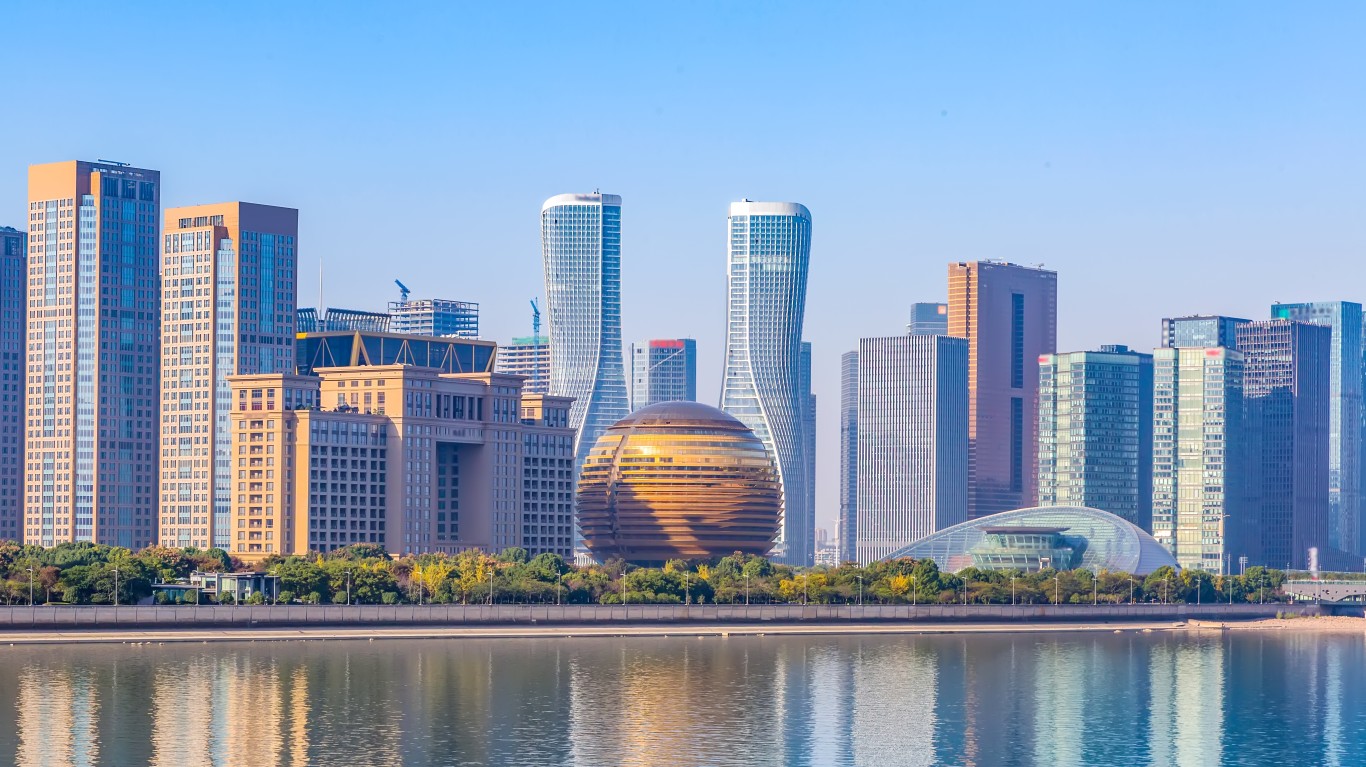
8. Hangzhou, Zhejiang
> GDP, 2021: $280.7 billion – 8th highest in China
> Population, 2021: 7,845,501
> GDP per capita: $35,782
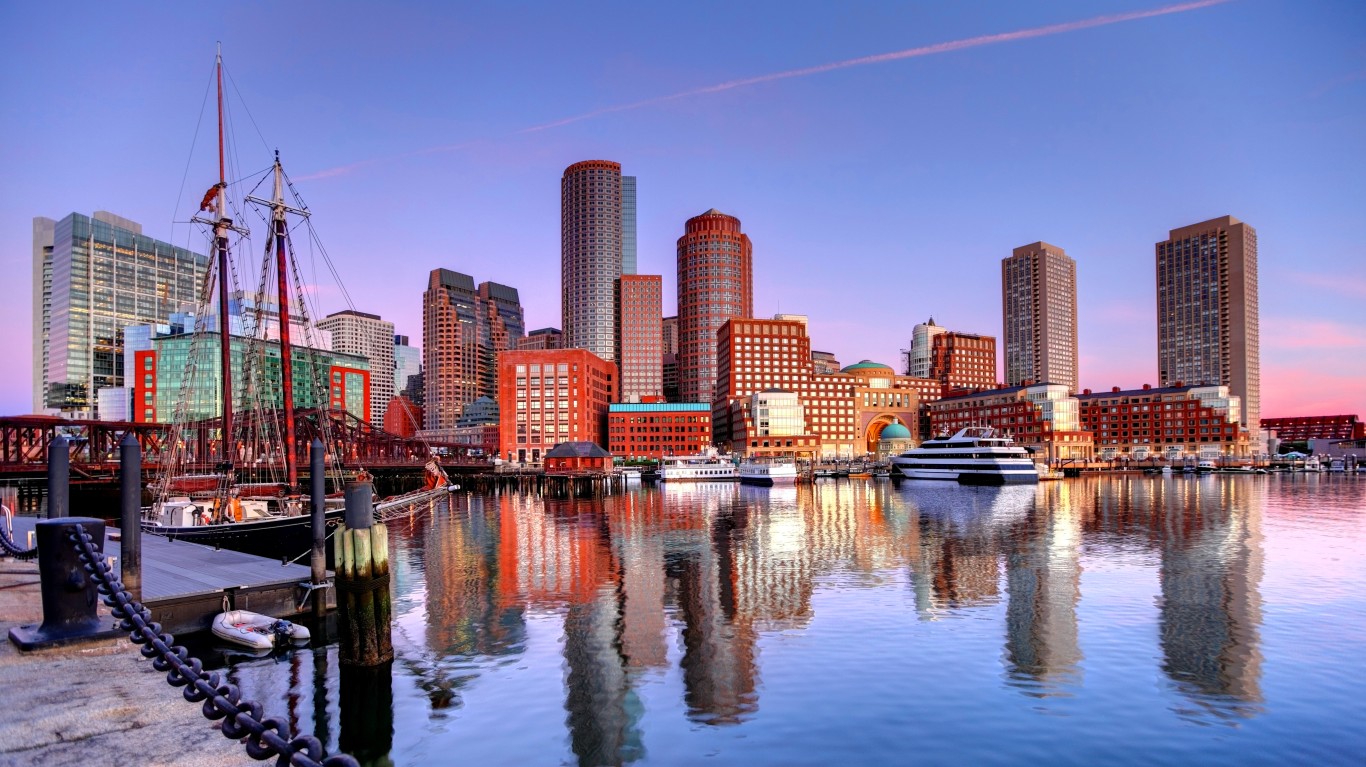
8. Boston-Cambridge-Newton, MA-NH
> GDP, 2021: $531.7 billion – 8th highest in the US
> Population, 2021: 4,899,932
> GDP per capita: $108,506
[in-text-ad]

7. Chengdu, Sichuan
> GDP, 2021: $308.8 billion – 7th highest in China
> Population, 2021: 9,305,116
> GDP per capita: $33,181
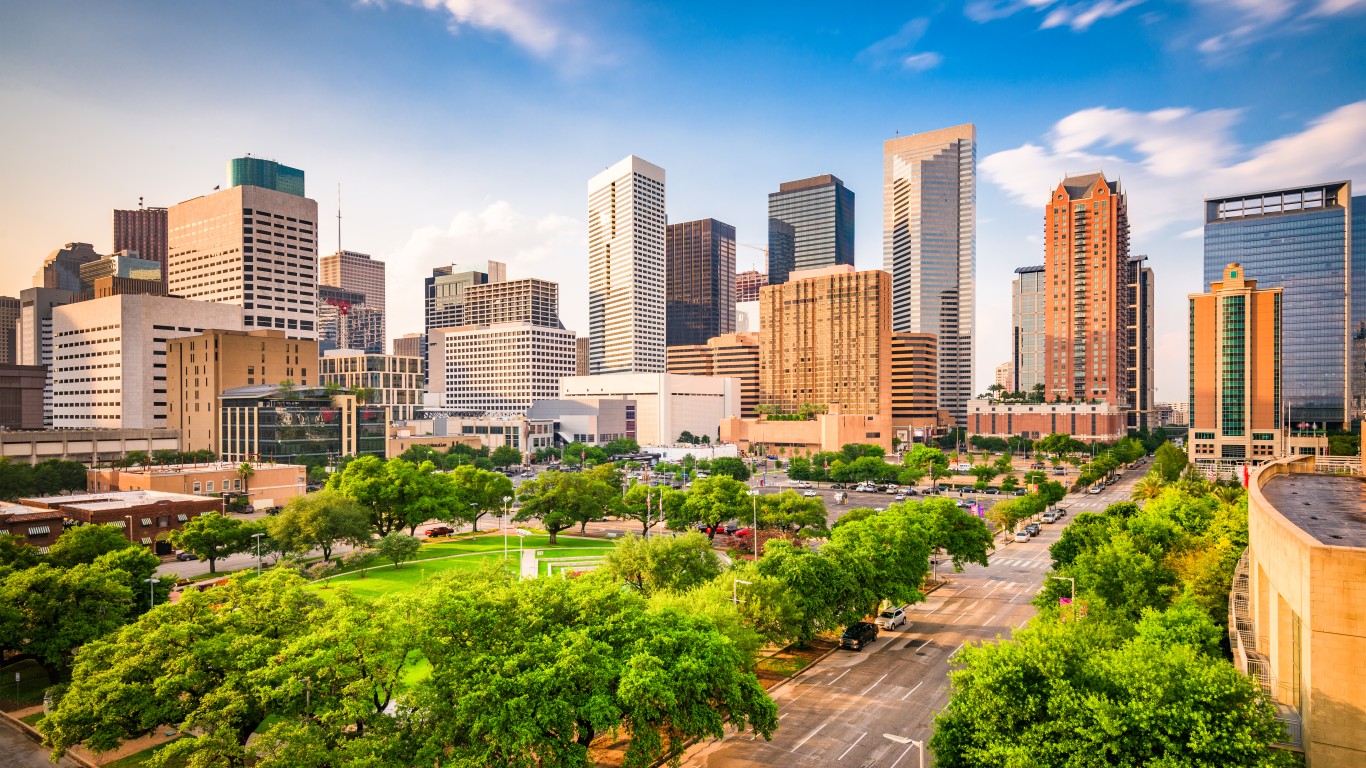
7. Houston-The Woodlands-Sugar Land, TX
> GDP, 2021: $537.1 billion – 7th highest in the US
> Population, 2021: 7,206,841
> GDP per capita: $74,522
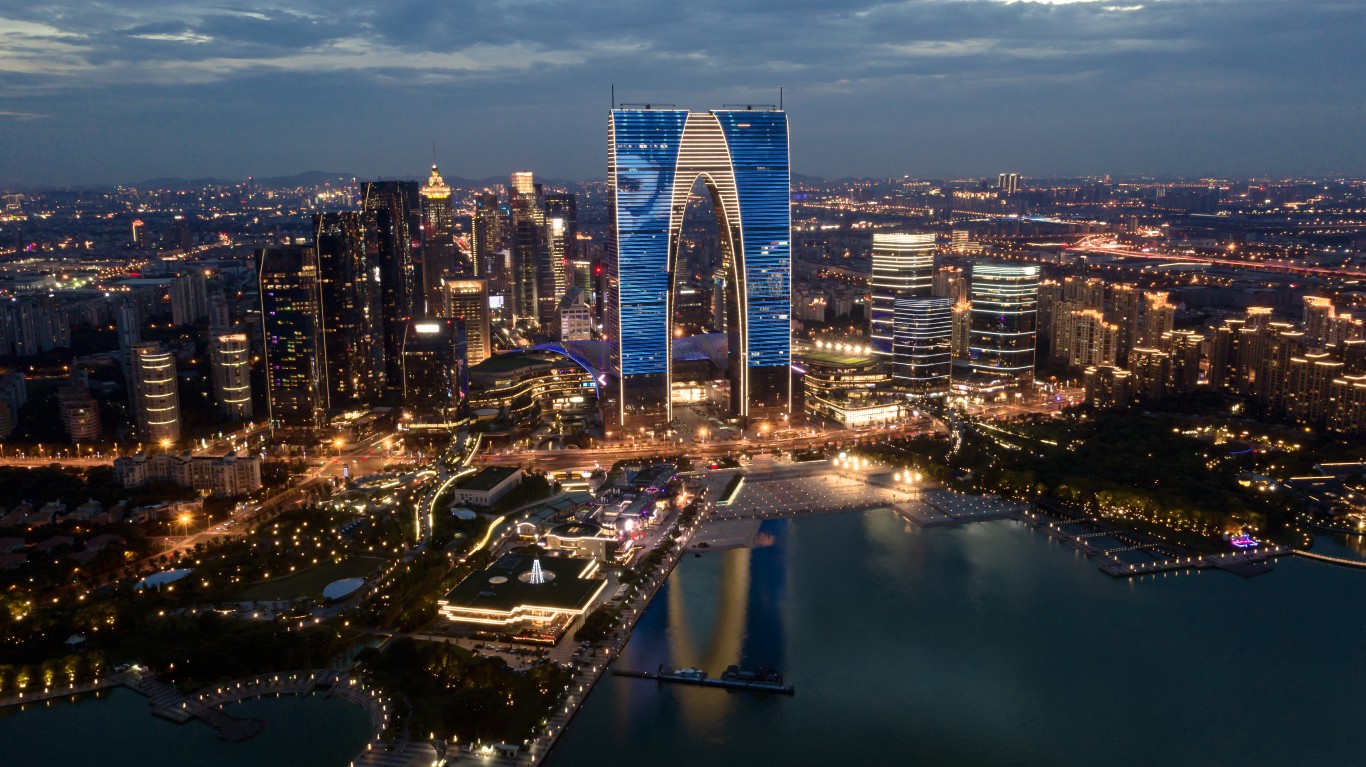
6. Suzhou, Jiangsu
> GDP, 2021: $352.2 billion – 6th highest in China
> Population, 2021: 7,427,096
> GDP per capita: $47,422
[in-text-ad-2]
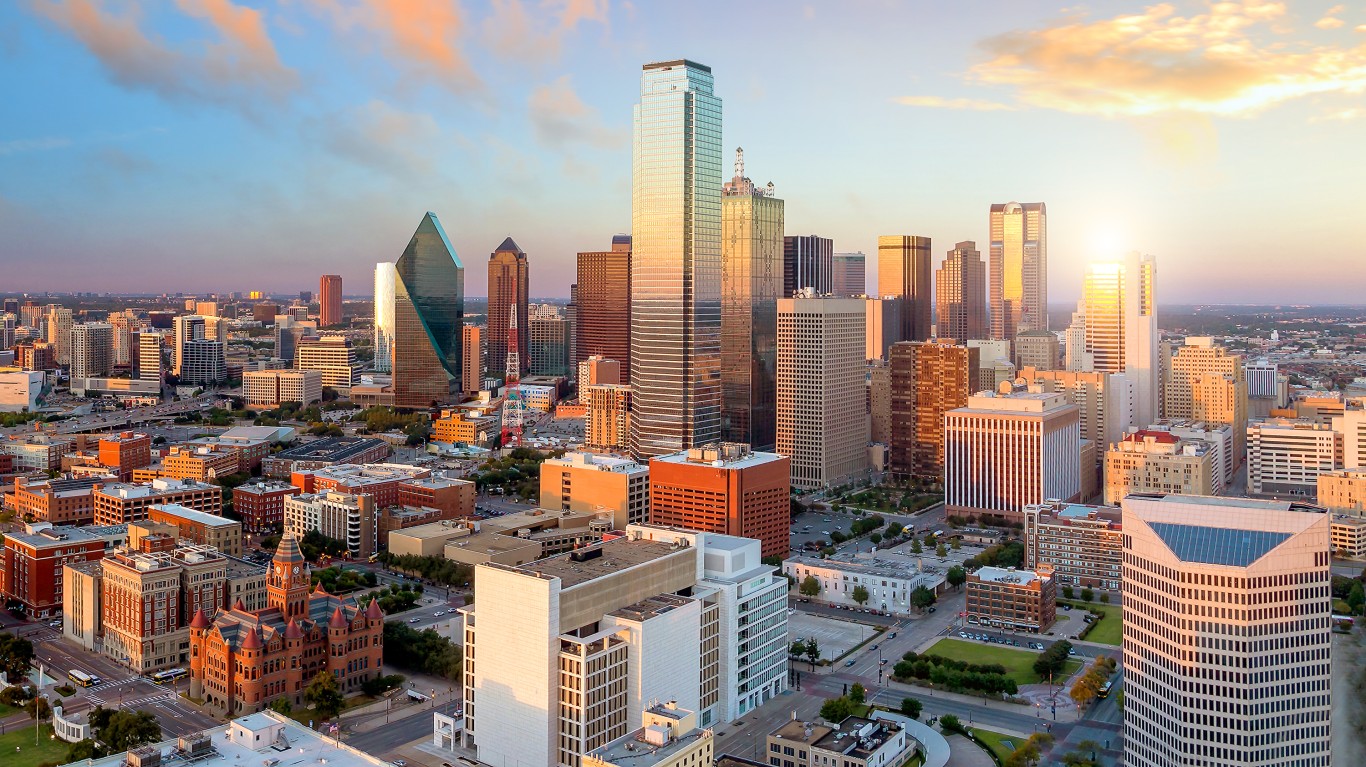
6. Dallas-Fort Worth-Arlington, TX
> GDP, 2021: $598.3 billion – 6th highest in the US
> Population, 2021: 7,759,615
> GDP per capita: $77,109

5. Chongqing, municipality
> GDP, 2021: $432.4 billion – 5th highest in China
> Population, 2021: 16,382,376
> GDP per capita: $26,395
[in-text-ad]

5. Washington-Arlington-Alexandria, DC-VA-MD-WV
> GDP, 2021: $607.6 billion – 5th highest in the US
> Population, 2021: 6,358,652
> GDP per capita: $95,559
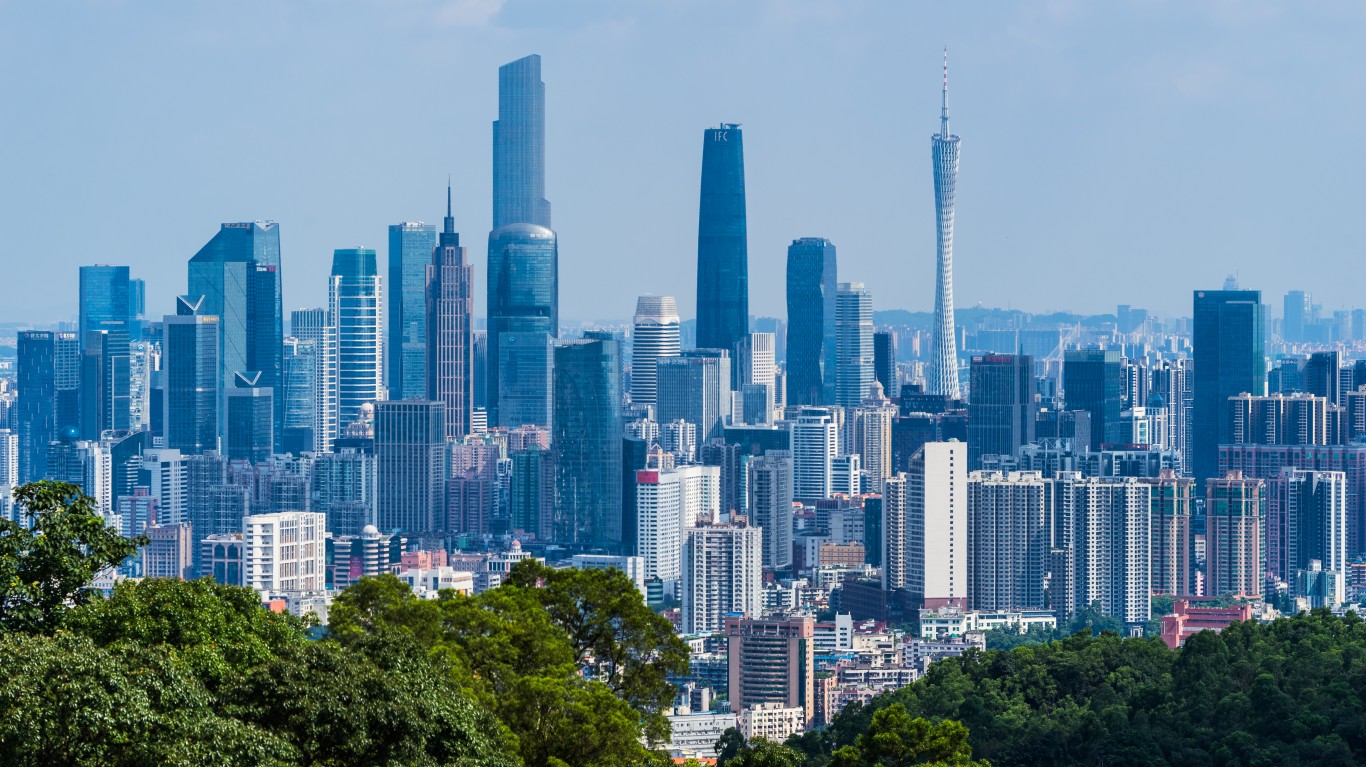
4. Guangzhou, Guangdong
> GDP, 2021: $437.7 billion – 4th highest in China
> Population, 2021: 13,635,397
> GDP per capita: $32,097

4. San Francisco-Oakland-Berkeley, CA
> GDP, 2021: $668.7 billion – 4th highest in the US
> Population, 2021: 4,623,264
> GDP per capita: $144,633
[in-text-ad-2]
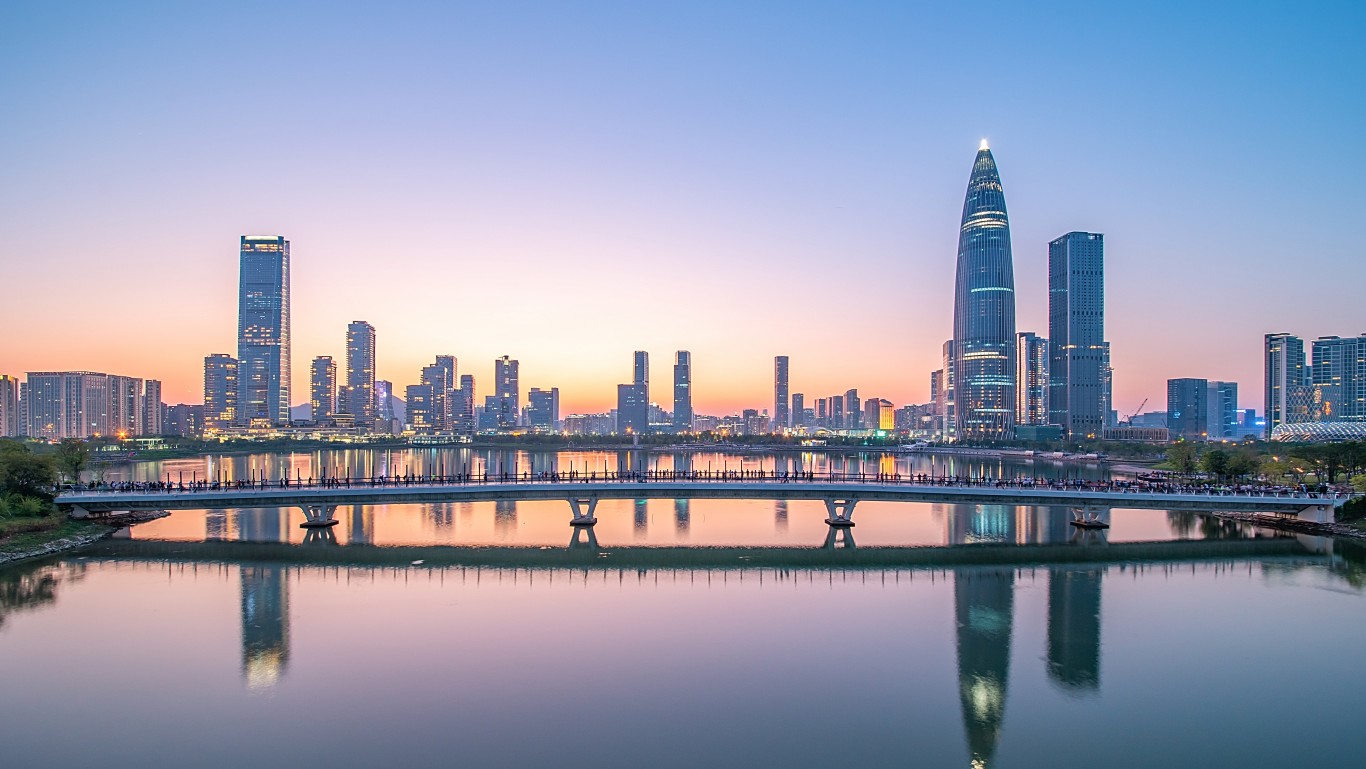
3. Shenzhen, Guangdong
> GDP, 2021: $475.4 billion – 3rd highest in China
> Population, 2021: 12,591,696
> GDP per capita: $37,752
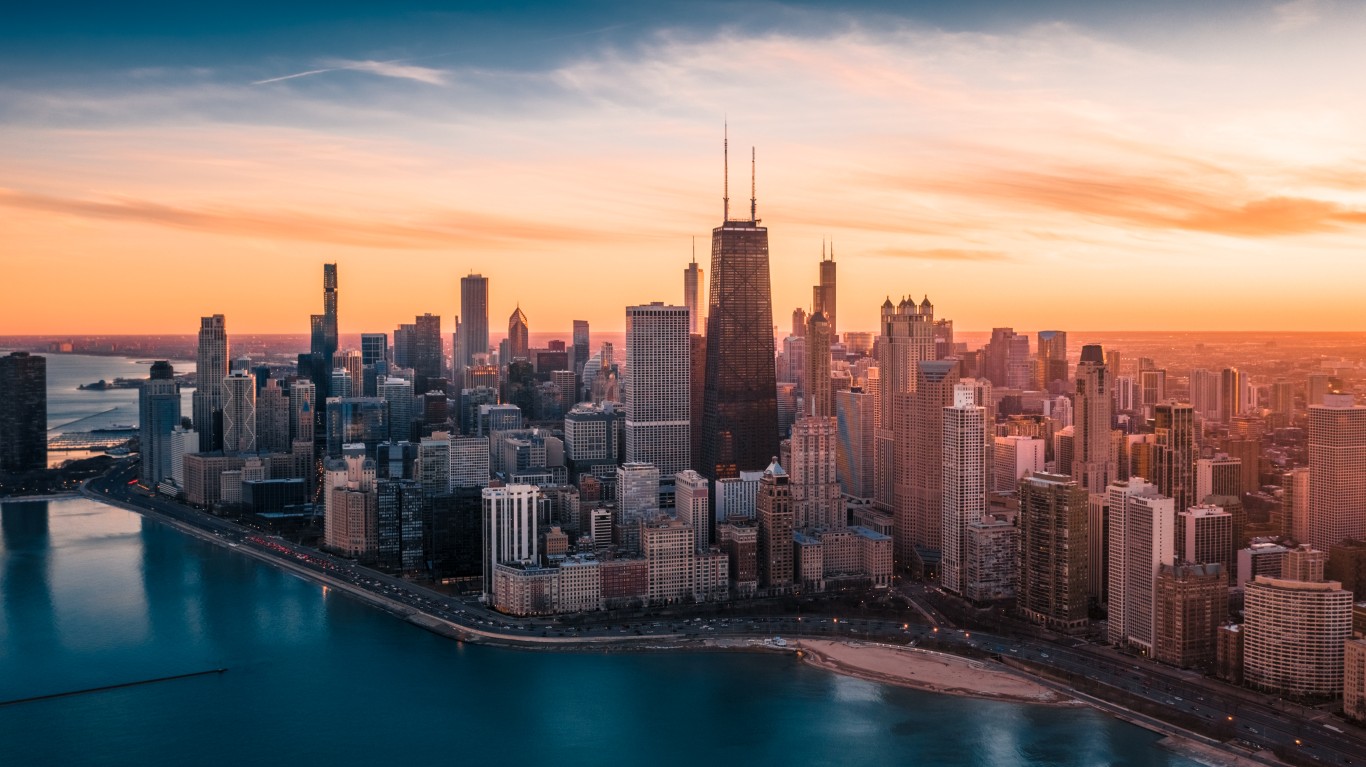
3. Chicago-Naperville-Elgin, IL-IN-WI
> GDP, 2021: $764.6 billion – 3rd highest in the US
> Population, 2021: 9,510,390
> GDP per capita: $80,395
[in-text-ad]

2. Beijing, municipality
> GDP, 2021: $624.3 billion – 2nd highest in China
> Population, 2021: 20,896,821
> GDP per capita: $29,874
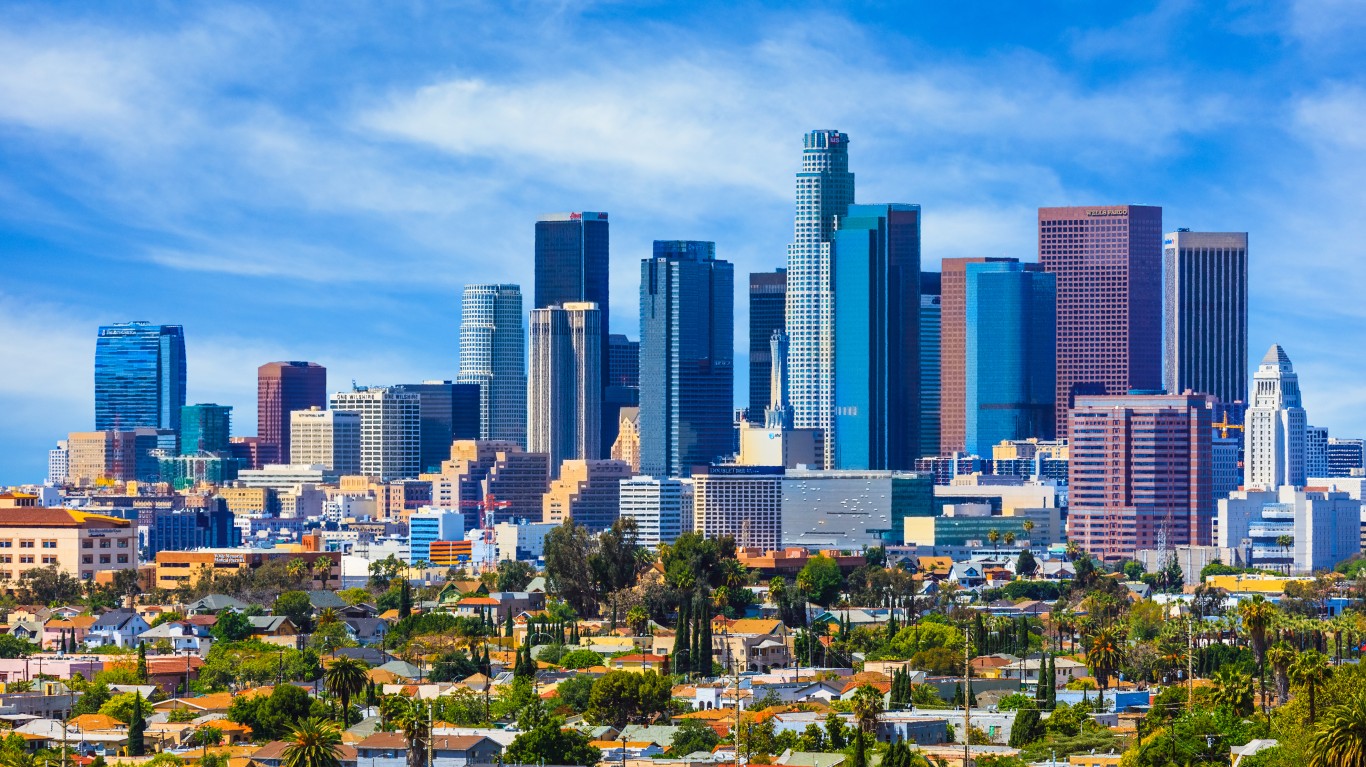
2. Los Angeles-Long Beach-Anaheim, CA
> GDP, 2021: $1,124.7 billion – 2nd highest in the US
> Population, 2021: 12,997,353
> GDP per capita: $86,532
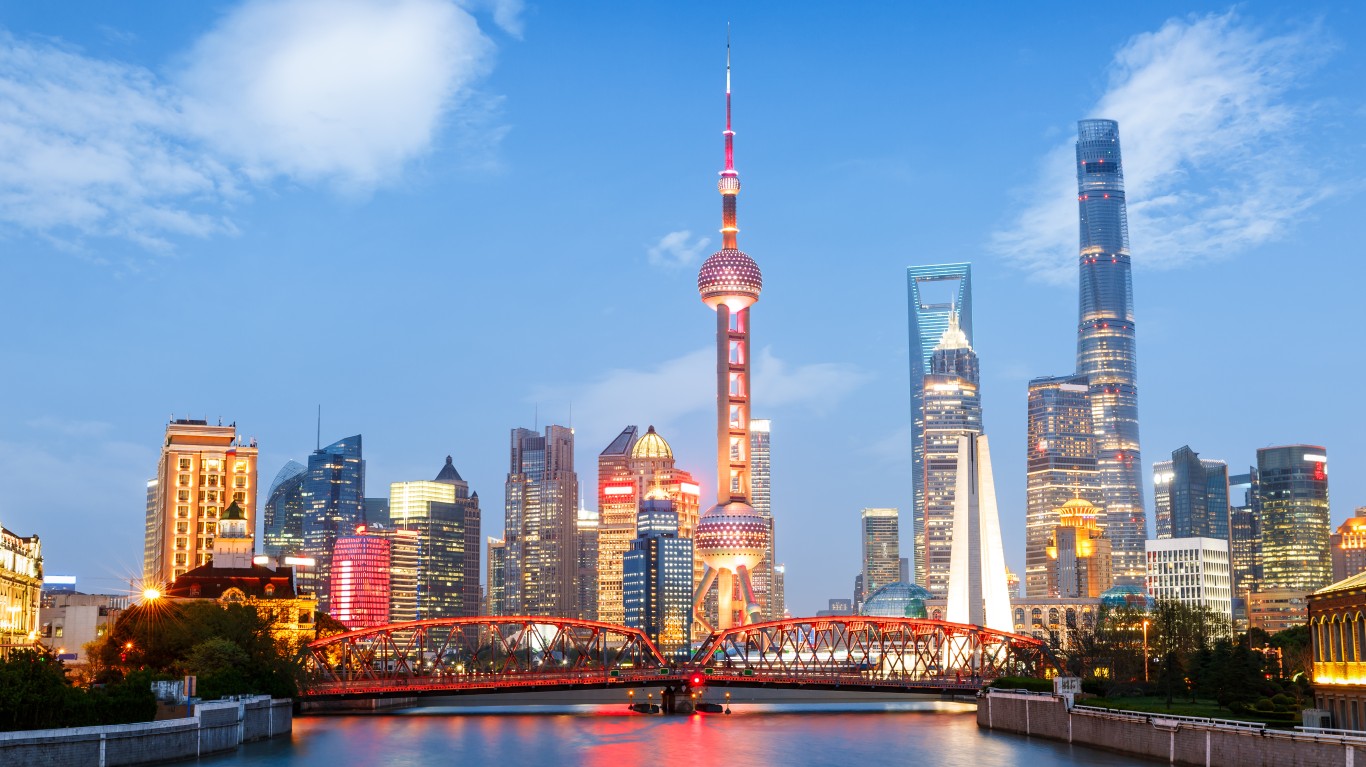
1. Shanghai, municipality
> GDP, 2021: $669.9 billion – highest in China
> Population, 2021: 27,795,702
> GDP per capita: $24,101
[in-text-ad-2]
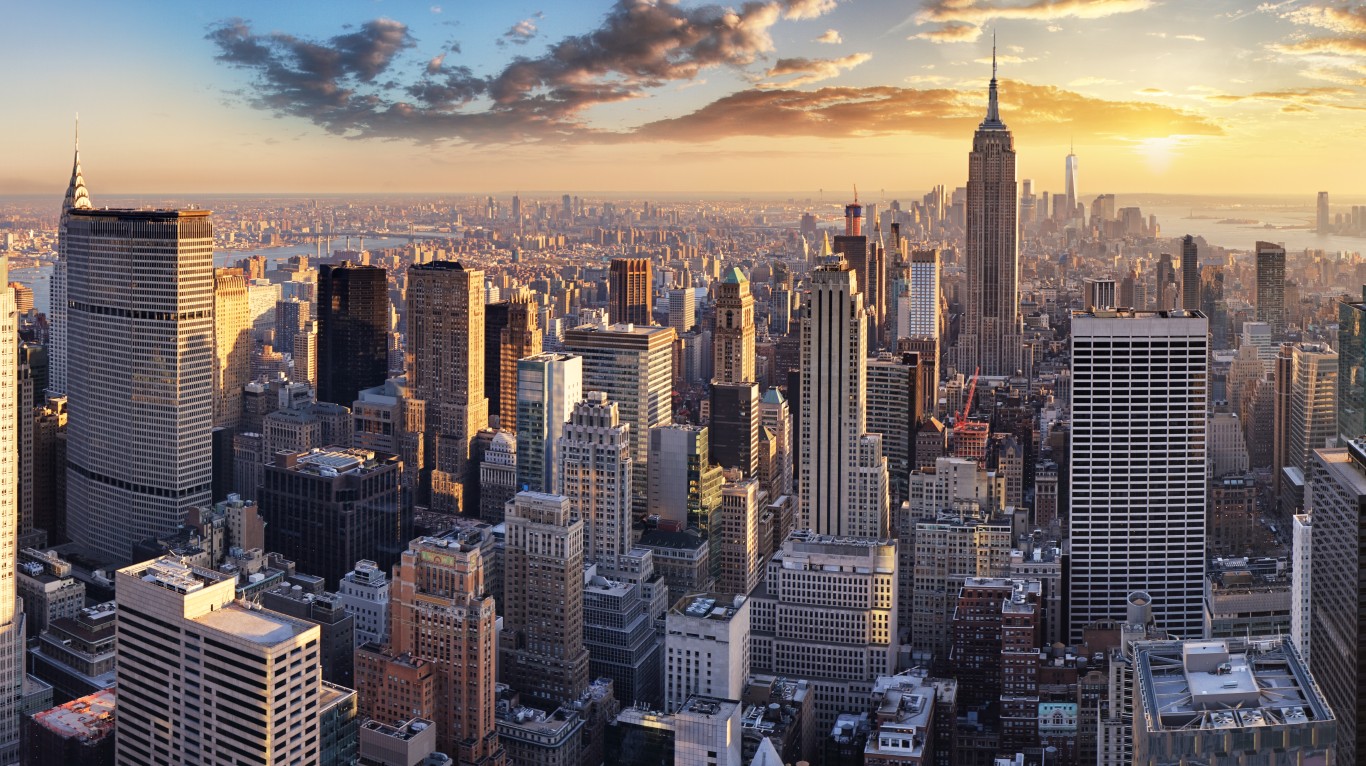
1. New York-Newark-Jersey City, NY-NJ-PA
> GDP, 2021: $1,992.8 billion – highest in the US
> Population, 2021: 19,768,458
> GDP per capita: $100,806
Methodology
To compare the 20 richest cities in China and the U.S., 24/7 Wall St. used a translated source, Sina Finance, from Wikipedia to find the gross domestic product of Chinese cities and data from the U.S. Bureau of Economic Analysis to find the GDP of U.S. metropolitan areas. We were able to confirm most of the cities using a Statista list of GDP of provincial capital cities and municipalities in China in 2021, sourced from China Statistical Yearbook 2022, chapter 25.2.
We converted the GDP of Chinese cities from yuan using the average exchange rate for 2021, as calculated by the Federal Reserve, of 6.4508. U.S. and Chinese cities are matched and ordered by their GDP within each country, that is, the cities with the 20th highest GDP in China and the U.S. are matched and so on.
Population data for Chinese cities are 2021 estimates from the United Nations Population Division and are for urban agglomeration. Population data for U.S. metro areas came from the U.S. Census Bureau’s 2021 American Community Survey. 24/7 Wall St. calculated GDP per capita using both figures.
The Average American Is Losing Their Savings Every Day (Sponsor)
If you’re like many Americans and keep your money ‘safe’ in a checking or savings account, think again. The average yield on a savings account is a paltry .4% today, and inflation is much higher. Checking accounts are even worse.
Every day you don’t move to a high-yield savings account that beats inflation, you lose more and more value.
But there is good news. To win qualified customers, some accounts are paying 9-10x this national average. That’s an incredible way to keep your money safe, and get paid at the same time. Our top pick for high yield savings accounts includes other one time cash bonuses, and is FDIC insured.
Click here to see how much more you could be earning on your savings today. It takes just a few minutes and your money could be working for you.
Thank you for reading! Have some feedback for us?
Contact the 24/7 Wall St. editorial team.
 24/7 Wall St.
 24/7 Wall St.
 24/7 Wall St.


