The rising cost of living in the United States in recent years, coupled with longer-term stagnation of wages, have eroded the ranks of the American middle class – which has long been a pillar of stability and driver of growth in the U.S. economy.
Typically, middle class households have disposable income for luxuries such as vacations and eating at restaurants, and are also able to put away money for savings and retirement. But because of economic conditions, households that fall in the middle of the income spectrum in much of the country may no longer meet some of these benchmarks of middle-class status.
Using metro area level data from the U.S. Census Bureau’s 2021 American Community Survey, 24/7 Wall St. identified the city with the weakest middle class in each state. For the purposes of this story, the middle class is defined as the middle 20% of earners at the household level. For each state, the metro area with the lowest income ceiling for the middle quintile of earners ranks as having the poorest middle class. All data is for 2021.
It is important to note that Delaware, New Hampshire, Rhode Island, and Vermont are each home to only one metro area. As a result, the city listed for each of these states ranks as having the poorest middle class by default only. And though each metro area on this list ranks as having the weakest middle class in the state, there are several cases in which middle class households in these places earn more than the middle income households across the state as a whole.
Not only are middle class earnings relatively low in most of the cities on this list, but the broader population in general also tends to be poorer. In all but four of the metro areas listed, the typical household earns less than the statewide median household income. Additionally, in all but six metro areas on this list, the median household income is below the national median household income of $69,717. (Here is a look at the poorest town in every state.)
In past decades, Americans could get a well-paying job with just a high school diploma. Today, the vast majority of high-paying positions require a college education. Perhaps not surprisingly, in the vast majority of metro areas on this list, which tend to be relatively low-income places, the share of adults with a bachelor’s degree or higher is below the share of adults with a bachelor’s degree across the state as a whole. (These are the 40 highest paying jobs you can still get without a college degree.)
Click here to see city with the poorest middle class in each state.
Click here to see our detailed methodology.
Alabama: Gadsden
> Middle-income range: $36,325 – $55,795 (state: $50,397 – $78,729)
> Median household income: $45,298 (state: $53,913)
> Share of income earned by middle class: 15.5% (state: 14.3%)
> Share of income earned by wealthiest 5% of households: 19.2% (state: 22.5%)
> Adults with a bachelor’s degree or higher: 18.2% (state: 27.4%)
> Metro areas considered in state: 12
[in-text-ad]

Alaska: Fairbanks
> Middle-income range: $60,983 – $89,054 (state: $71,175 – $111,220)
> Median household income: $72,149 (state: $77,845)
> Share of income earned by middle class: 16.0% (state: 15.7%)
> Share of income earned by wealthiest 5% of households: 16.4% (state: 18.9%)
> Adults with a bachelor’s degree or higher: 38.1% (state: 32.8%)
> Metro areas considered in state: 2

Arizona: Lake Havasu City-Kingman
> Middle-income range: $35,900 – $59,491 (state: $52,295 – $82,996)
> Median household income: $46,616 (state: $69,056)
> Share of income earned by middle class: 14.3% (state: 14.8%)
> Share of income earned by wealthiest 5% of households: 22.8% (state: 22.3%)
> Adults with a bachelor’s degree or higher: 15.1% (state: 32.4%)
> Metro areas considered in state: 7

Arkansas: Fort Smith
> Middle-income range: $39,500 – $59,478 (state: $56,948 – $94,304)
> Median household income: $49,065 (state: $52,528)
> Share of income earned by middle class: 14.6% (state: 14.5%)
> Share of income earned by wealthiest 5% of households: 23.2% (state: 22.5%)
> Adults with a bachelor’s degree or higher: 20.3% (state: 25.3%)
> Metro areas considered in state: 6
[in-text-ad-2]

California: Merced
> Middle-income range: $43,011 – $68,166 (state: $66,612 – $105,995)
> Median household income: $53,992 (state: $84,907)
> Share of income earned by middle class: 15.0% (state: 14.2%)
> Share of income earned by wealthiest 5% of households: 22.3% (state: 23.6%)
> Adults with a bachelor’s degree or higher: 14.4% (state: 36.2%)
> Metro areas considered in state: 26

Colorado: Pueblo
> Middle-income range: $43,029 – $70,546 (state: $53,713 – $85,848)
> Median household income: $56,689 (state: $82,254)
> Share of income earned by middle class: 15.0% (state: 14.9%)
> Share of income earned by wealthiest 5% of households: 22.6% (state: 22.0%)
> Adults with a bachelor’s degree or higher: 26.6% (state: 44.4%)
> Metro areas considered in state: 7
[in-text-ad]

Connecticut: New Haven-Milford
> Middle-income range: $58,427 – $95,712 (state: $50,200 – $78,317)
> Median household income: $75,295 (state: $83,771)
> Share of income earned by middle class: 14.7% (state: 14.0%)
> Share of income earned by wealthiest 5% of households: 22.5% (state: 24.9%)
> Adults with a bachelor’s degree or higher: 39.5% (state: 42.1%)
> Metro areas considered in state: 4

Delaware: Dover
> Middle-income range: $52,778 – $79,512 (state: $56,948 – $94,304)
> Median household income: $64,308 (state: $71,091)
> Share of income earned by middle class: 16.6% (state: 15.0%)
> Share of income earned by wealthiest 5% of households: 16.9% (state: 21.2%)
> Adults with a bachelor’s degree or higher: 27.0% (state: 35.6%)
> Metro areas considered in state: 1
Because Dover is the only metro area with available data in Delaware, it ranks as having the poorest middle class by default.
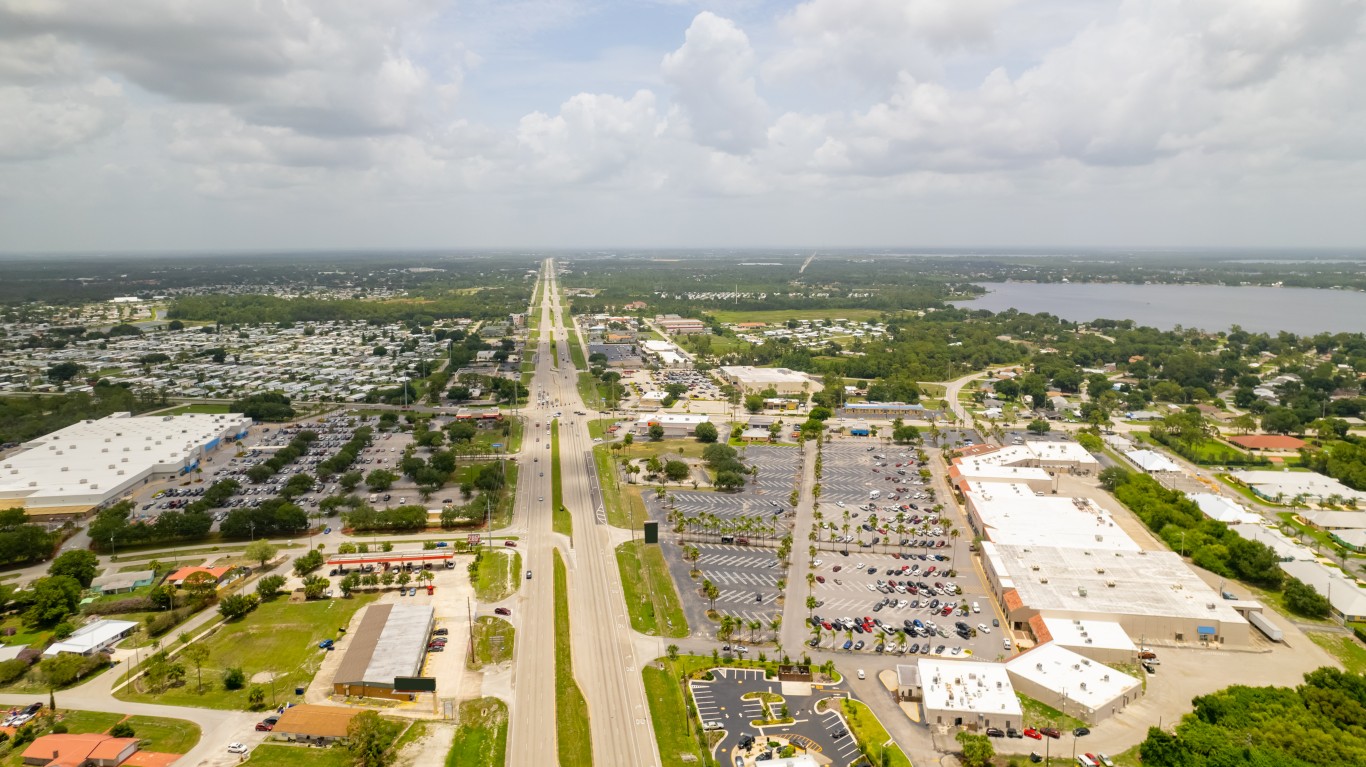
Florida: Sebring-Avon Park
> Middle-income range: $38,307 – $60,298 (state: $41,926 – $68,599)
> Median household income: $48,564 (state: $63,062)
> Share of income earned by middle class: 16.1% (state: 14.1%)
> Share of income earned by wealthiest 5% of households: 18.8% (state: 24.4%)
> Adults with a bachelor’s degree or higher: 18.3% (state: 33.2%)
> Metro areas considered in state: 22
[in-text-ad-2]
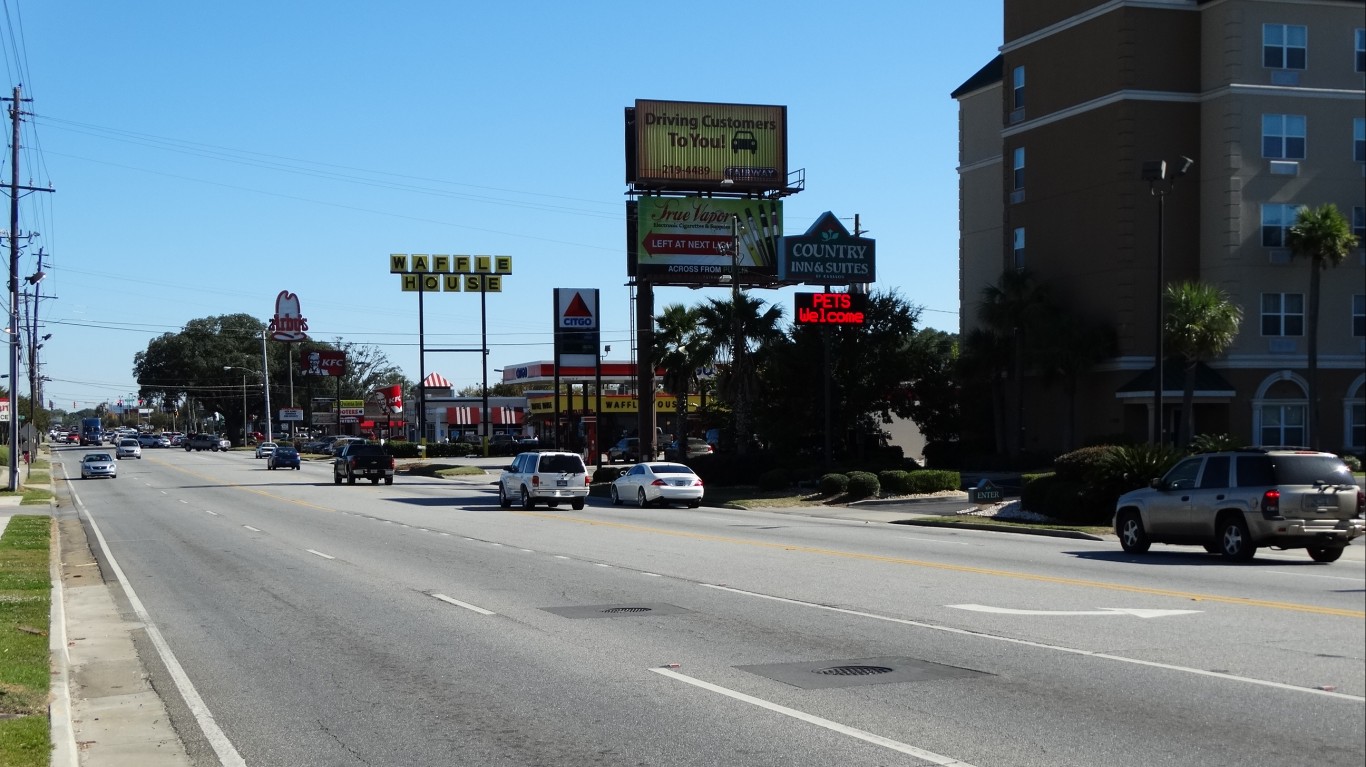
Georgia: Valdosta
> Middle-income range: $30,099 – $53,975 (state: $52,295 – $82,996)
> Median household income: $42,233 (state: $66,559)
> Share of income earned by middle class: 14.6% (state: 14.5%)
> Share of income earned by wealthiest 5% of households: 22.0% (state: 22.9%)
> Adults with a bachelor’s degree or higher: 22.3% (state: 34.6%)
> Metro areas considered in state: 14

Hawaii: Kahului-Wailuku-Lahaina
> Middle-income range: $59,808 – $95,322 (state: $50,200 – $78,317)
> Median household income: $76,273 (state: $84,857)
> Share of income earned by middle class: 13.9% (state: 15.2%)
> Share of income earned by wealthiest 5% of households: 22.6% (state: 20.8%)
> Adults with a bachelor’s degree or higher: 30.0% (state: 35.3%)
> Metro areas considered in state: 2
[in-text-ad]

Idaho: Twin Falls
> Middle-income range: $45,071 – $69,129 (state: $53,802 – $82,323)
> Median household income: $55,519 (state: $66,474)
> Share of income earned by middle class: 14.3% (state: 14.9%)
> Share of income earned by wealthiest 5% of households: 23.9% (state: 23.3%)
> Adults with a bachelor’s degree or higher: 21.4% (state: 30.7%)
> Metro areas considered in state: 6
Illinois: Danville
> Middle-income range: $38,728 – $60,164 (state: $54,292 – $81,556)
> Median household income: $49,091 (state: $72,205)
> Share of income earned by middle class: 15.3% (state: 14.5%)
> Share of income earned by wealthiest 5% of households: 20.2% (state: 23.1%)
> Adults with a bachelor’s degree or higher: 15.9% (state: 37.1%)
> Metro areas considered in state: 10

Indiana: Muncie
> Middle-income range: $40,180 – $60,572 (state: $66,968 – $104,584)
> Median household income: $50,497 (state: $62,743)
> Share of income earned by middle class: 15.6% (state: 15.3%)
> Share of income earned by wealthiest 5% of households: 20.3% (state: 20.9%)
> Adults with a bachelor’s degree or higher: 24.5% (state: 28.9%)
> Metro areas considered in state: 12
[in-text-ad-2]

Iowa: Waterloo-Cedar Falls
> Middle-income range: $49,051 – $76,772 (state: $53,802 – $82,323)
> Median household income: $61,833 (state: $65,600)
> Share of income earned by middle class: 15.7% (state: 15.3%)
> Share of income earned by wealthiest 5% of households: 21.7% (state: 21.5%)
> Adults with a bachelor’s degree or higher: 29.5% (state: 30.5%)
> Metro areas considered in state: 8
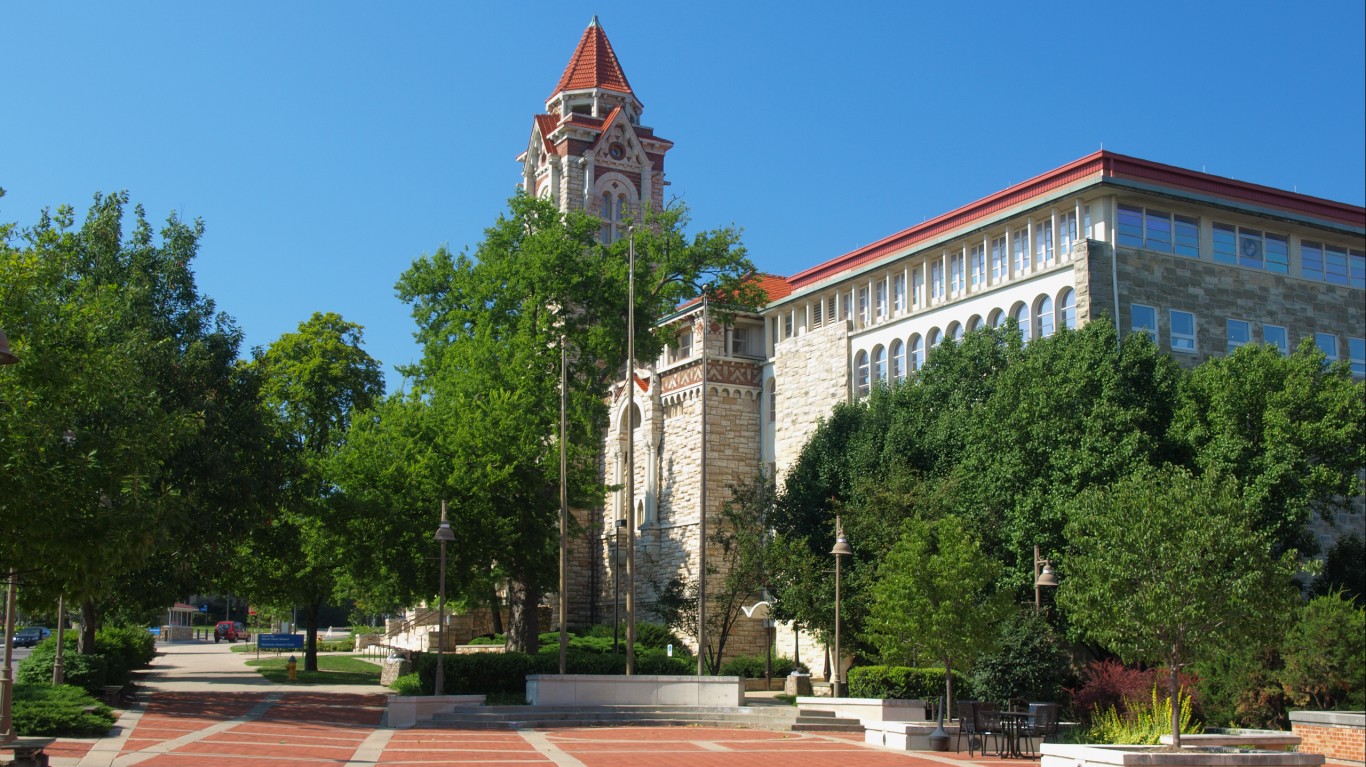
Kansas: Lawrence
> Middle-income range: $45,193 – $71,072 (state: $54,292 – $81,556)
> Median household income: $56,576 (state: $64,124)
> Share of income earned by middle class: 15.2% (state: 14.9%)
> Share of income earned by wealthiest 5% of households: 19.2% (state: 22.1%)
> Adults with a bachelor’s degree or higher: -100.0% (state: 35.4%)
> Metro areas considered in state: 4
[in-text-ad]
Kentucky: Elizabethtown-Fort Knox
> Middle-income range: $50,476 – $70,797 (state: $41,926 – $68,599)
> Median household income: $60,025 (state: $55,573)
> Share of income earned by middle class: 16.0% (state: 14.7%)
> Share of income earned by wealthiest 5% of households: 15.8% (state: 22.4%)
> Adults with a bachelor’s degree or higher: 24.5% (state: 27.0%)
> Metro areas considered in state: 5
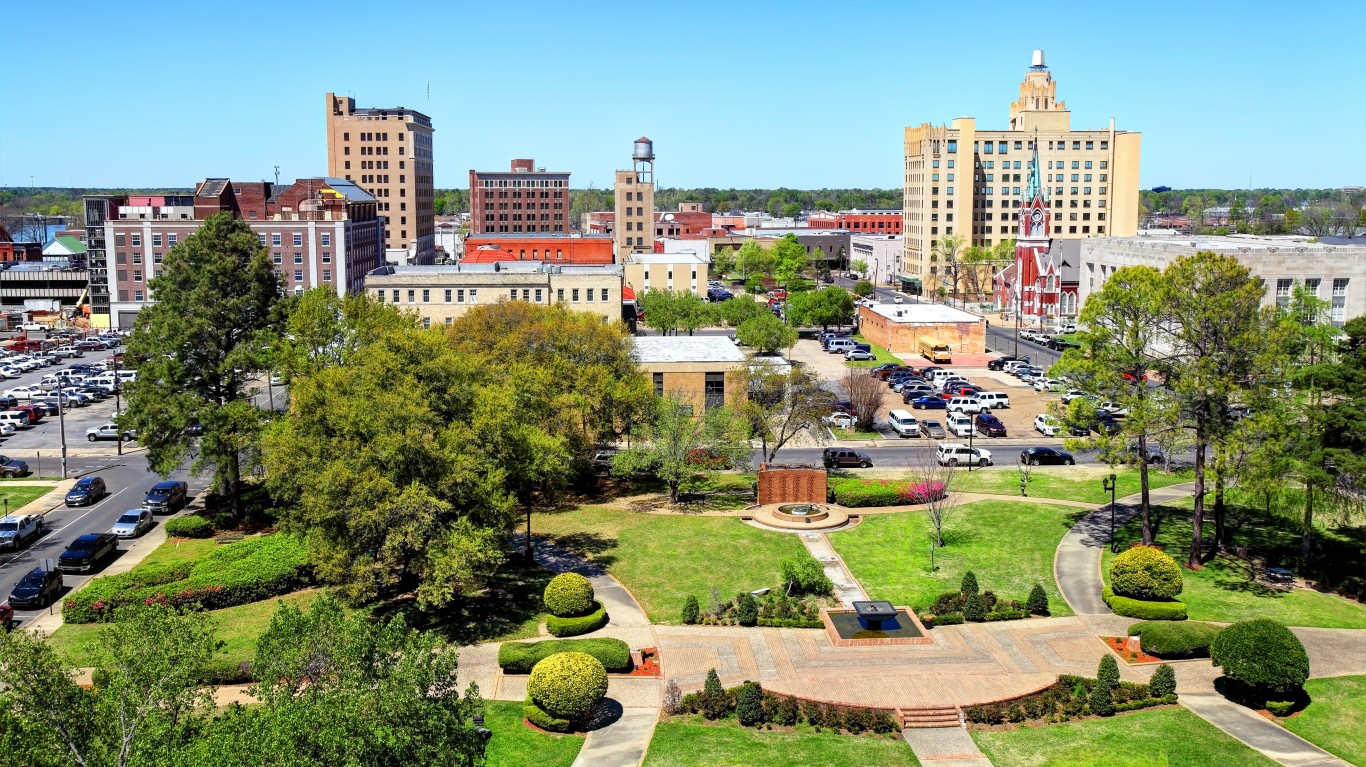
Louisiana: Monroe
> Middle-income range: $31,493 – $56,223 (state: $56,295 – $88,426)
> Median household income: $45,001 (state: $52,087)
> Share of income earned by middle class: 14.0% (state: 14.0%)
> Share of income earned by wealthiest 5% of households: 22.3% (state: 23.2%)
> Adults with a bachelor’s degree or higher: 23.9% (state: 26.4%)
> Metro areas considered in state: 9

Maine: Bangor
> Middle-income range: $43,354 – $70,831 (state: $65,032 – $96,596)
> Median household income: $56,250 (state: $64,767)
> Share of income earned by middle class: 15.3% (state: 14.9%)
> Share of income earned by wealthiest 5% of households: 18.8% (state: 22.9%)
> Adults with a bachelor’s degree or higher: 31.3% (state: 36.0%)
> Metro areas considered in state: 3
[in-text-ad-2]

Maryland: Cumberland
> Middle-income range: $43,767 – $66,821 (state: $56,295 – $88,426)
> Median household income: $51,440 (state: $90,203)
> Share of income earned by middle class: 14.0% (state: 15.1%)
> Share of income earned by wealthiest 5% of households: 24.6% (state: 21.4%)
> Adults with a bachelor’s degree or higher: 22.8% (state: 42.5%)
> Metro areas considered in state: 5

Massachusetts: Pittsfield
> Middle-income range: $48,013 – $75,760 (state: $44,235 – $69,505)
> Median household income: $60,749 (state: $89,645)
> Share of income earned by middle class: 12.7% (state: 14.5%)
> Share of income earned by wealthiest 5% of households: 27.0% (state: 22.7%)
> Adults with a bachelor’s degree or higher: 38.4% (state: 46.6%)
> Metro areas considered in state: 5
[in-text-ad]
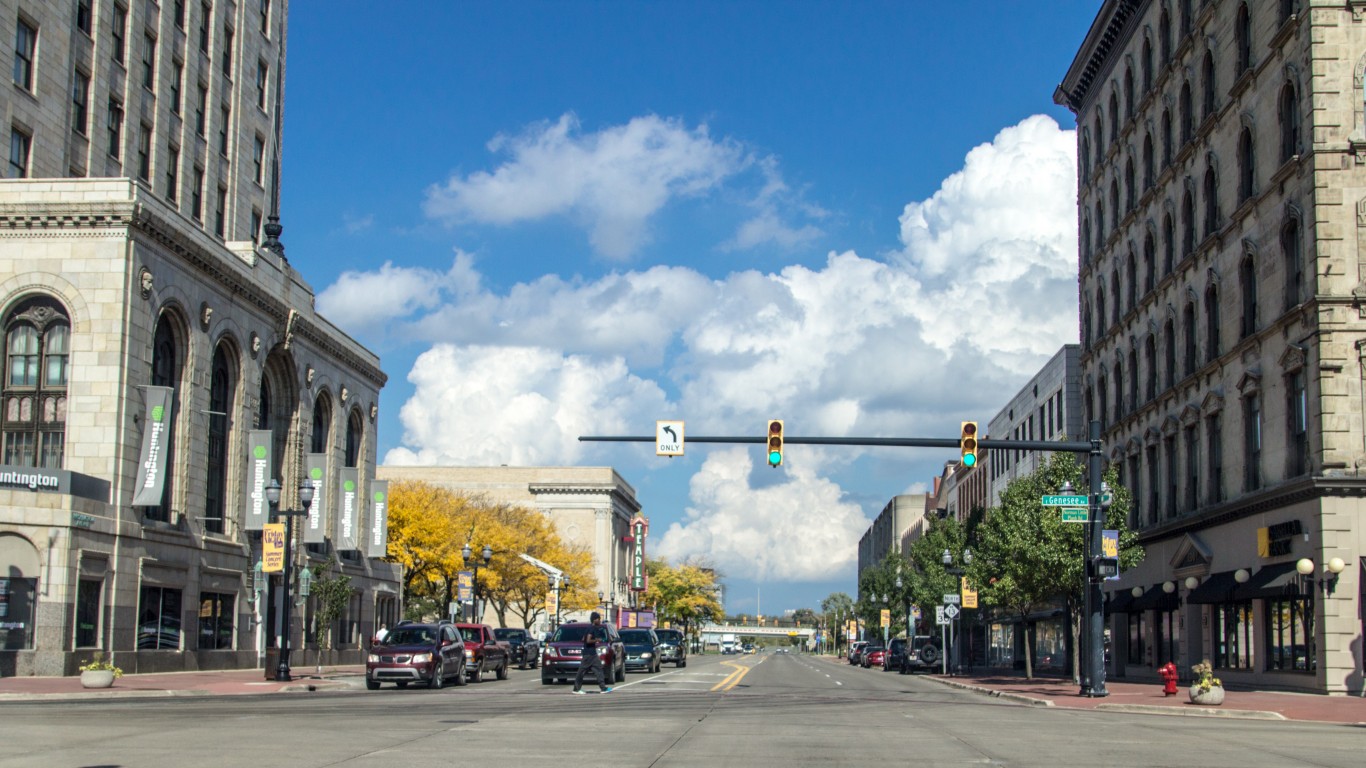
Michigan: Saginaw
> Middle-income range: $38,559 – $63,798 (state: $50,228 – $77,958)
> Median household income: $50,606 (state: $63,498)
> Share of income earned by middle class: 15.5% (state: 14.8%)
> Share of income earned by wealthiest 5% of households: 18.9% (state: 22.1%)
> Adults with a bachelor’s degree or higher: 22.5% (state: 31.7%)
> Metro areas considered in state: 14

Minnesota: Duluth
> Middle-income range: $49,622 – $79,095 (state: $48,732 – $77,231)
> Median household income: $64,960 (state: $77,720)
> Share of income earned by middle class: 15.5% (state: 15.2%)
> Share of income earned by wealthiest 5% of households: 21.6% (state: 21.3%)
> Adults with a bachelor’s degree or higher: 30.9% (state: 38.9%)
> Metro areas considered in state: 5
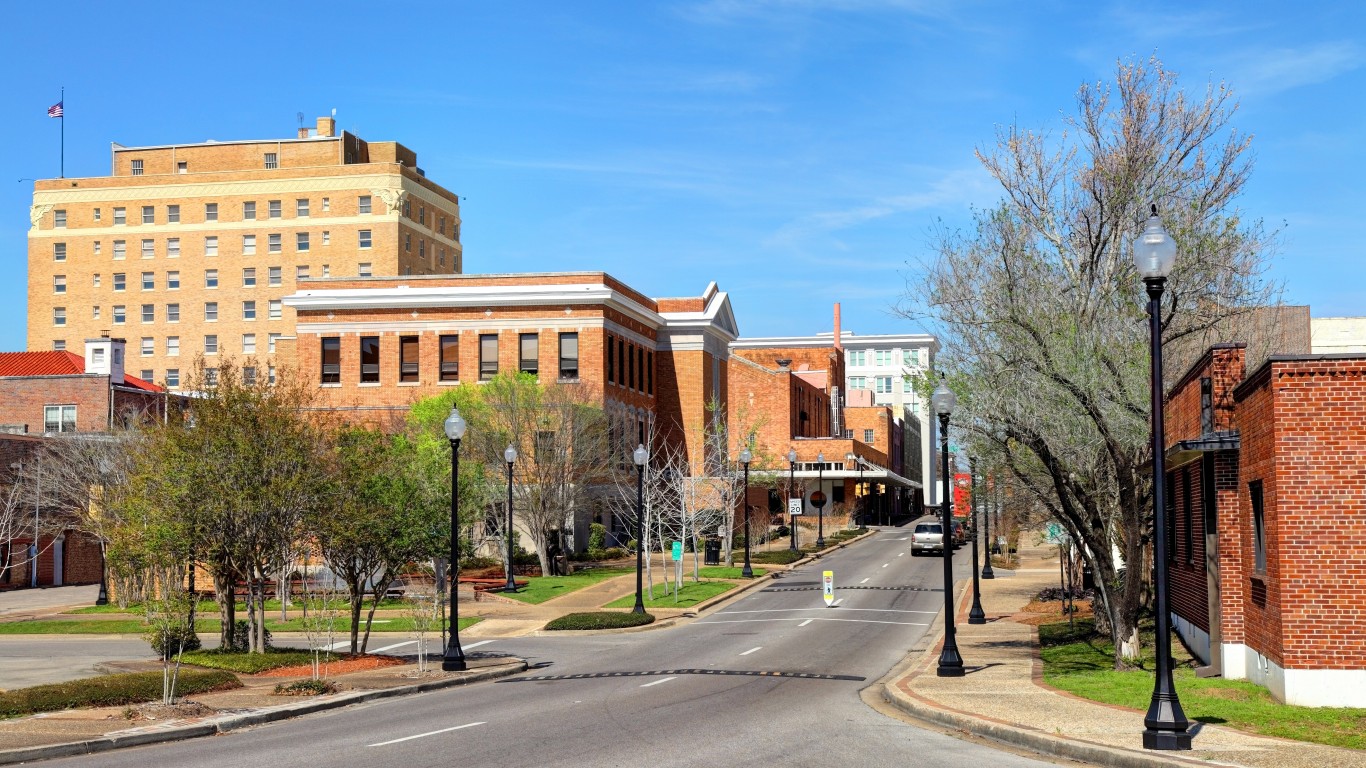
Mississippi: Hattiesburg
> Middle-income range: $41,805 – $66,642 (state: $52,379 – $83,764)
> Median household income: $55,444 (state: $48,716)
> Share of income earned by middle class: 13.9% (state: 14.4%)
> Share of income earned by wealthiest 5% of households: 25.4% (state: 22.1%)
> Adults with a bachelor’s degree or higher: 28.5% (state: 24.8%)
> Metro areas considered in state: 3
[in-text-ad-2]

Missouri: Joplin
> Middle-income range: $43,428 – $65,889 (state: $66,612 – $105,995)
> Median household income: $55,045 (state: $61,847)
> Share of income earned by middle class: 15.0% (state: 14.6%)
> Share of income earned by wealthiest 5% of households: 22.1% (state: 22.9%)
> Adults with a bachelor’s degree or higher: 24.3% (state: 31.7%)
> Metro areas considered in state: 8

Montana: Great Falls
> Middle-income range: $44,850 – $70,523 (state: $50,618 – $77,150)
> Median household income: $57,706 (state: $63,249)
> Share of income earned by middle class: 15.6% (state: 14.5%)
> Share of income earned by wealthiest 5% of households: 18.3% (state: 22.9%)
> Adults with a bachelor’s degree or higher: 27.4% (state: 34.8%)
> Metro areas considered in state: 3
[in-text-ad]
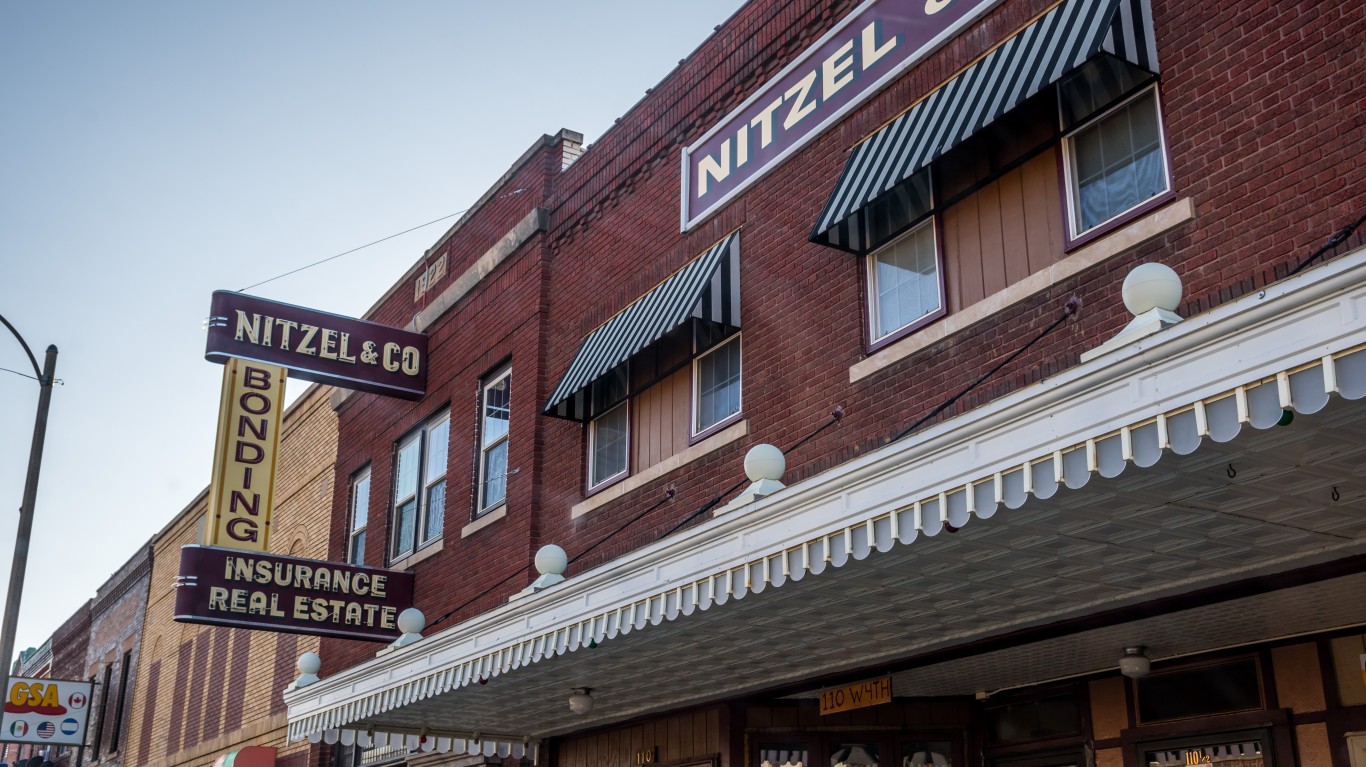
Nebraska: Grand Island
> Middle-income range: $50,686 – $76,558 (state: $56,320 – $89,984)
> Median household income: $61,749 (state: $66,817)
> Share of income earned by middle class: 14.7% (state: 15.1%)
> Share of income earned by wealthiest 5% of households: 24.9% (state: 21.9%)
> Adults with a bachelor’s degree or higher: 21.2% (state: 34.4%)
> Metro areas considered in state: 3
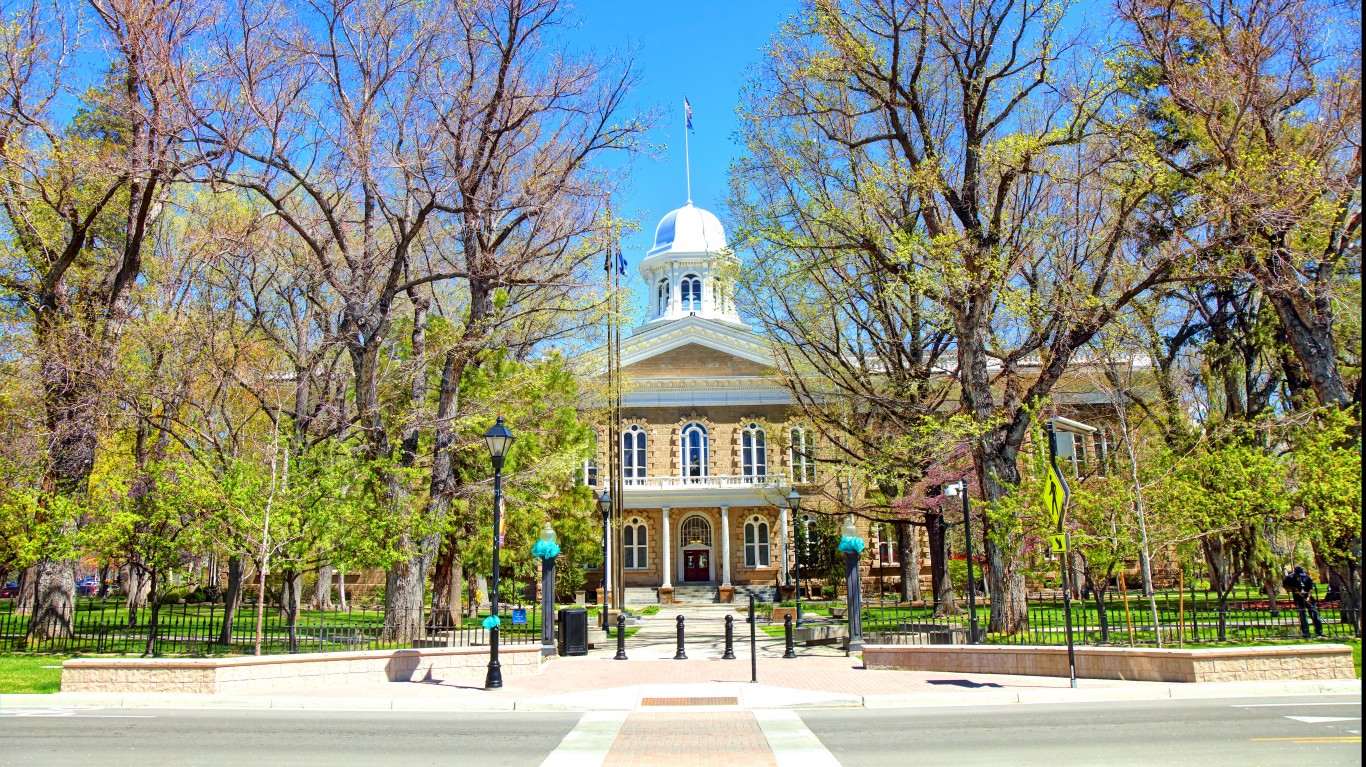
Nevada: Carson City
> Middle-income range: $49,917 – $77,620 (state: $49,218 – $77,486)
> Median household income: $65,330 (state: $66,274)
> Share of income earned by middle class: 16.0% (state: 14.8%)
> Share of income earned by wealthiest 5% of households: 18.6% (state: 22.4%)
> Adults with a bachelor’s degree or higher: 25.5% (state: 27.6%)
> Metro areas considered in state: 3

New Hampshire: Manchester-Nashua
> Middle-income range: $73,687 – $108,394 (state: $50,618 – $77,150)
> Median household income: $91,627 (state: $88,465)
> Share of income earned by middle class: 15.6% (state: 15.8%)
> Share of income earned by wealthiest 5% of households: 20.8% (state: 20.2%)
> Adults with a bachelor’s degree or higher: 41.4% (state: 40.2%)
> Metro areas considered in state: 1
Because Manchester is the only metro area with available data in New Hampshire, it ranks as having the poorest middle class by default.
[in-text-ad-2]

New Jersey: Vineland-Bridgeton
> Middle-income range: $46,988 – $73,239 (state: $66,612 – $105,995)
> Median household income: $58,389 (state: $89,296)
> Share of income earned by middle class: 14.6% (state: 14.4%)
> Share of income earned by wealthiest 5% of households: 21.2% (state: 22.9%)
> Adults with a bachelor’s degree or higher: 18.3% (state: 43.1%)
> Metro areas considered in state: 4
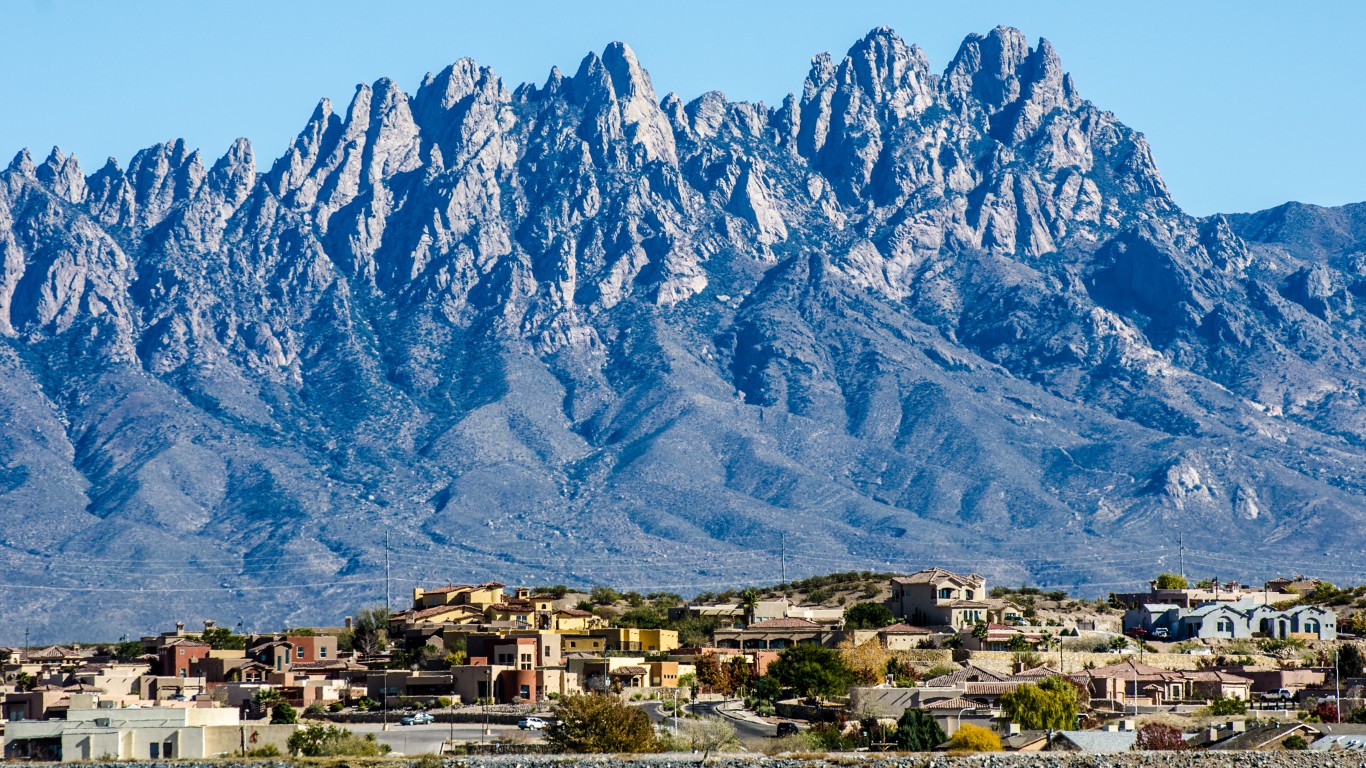
New Mexico: Las Cruces
> Middle-income range: $35,794 – $57,491 (state: $63,308 – $101,711)
> Median household income: $45,178 (state: $53,992)
> Share of income earned by middle class: 13.6% (state: 14.3%)
> Share of income earned by wealthiest 5% of households: 21.7% (state: 22.3%)
> Adults with a bachelor’s degree or higher: 30.1% (state: 30.1%)
> Metro areas considered in state: 4
[in-text-ad]
New York: Watertown-Fort Drum
> Middle-income range: $51,913 – $71,893 (state: $41,926 – $68,599)
> Median household income: $60,398 (state: $74,314)
> Share of income earned by middle class: 15.4% (state: 13.6%)
> Share of income earned by wealthiest 5% of households: 20.1% (state: 25.3%)
> Adults with a bachelor’s degree or higher: 29.6% (state: 39.9%)
> Metro areas considered in state: 13

North Carolina: Greenville
> Middle-income range: $34,127 – $60,854 (state: $53,802 – $82,323)
> Median household income: $44,450 (state: $61,972)
> Share of income earned by middle class: 13.7% (state: 14.4%)
> Share of income earned by wealthiest 5% of households: 22.9% (state: 23.1%)
> Adults with a bachelor’s degree or higher: 33.6% (state: 34.9%)
> Metro areas considered in state: 15
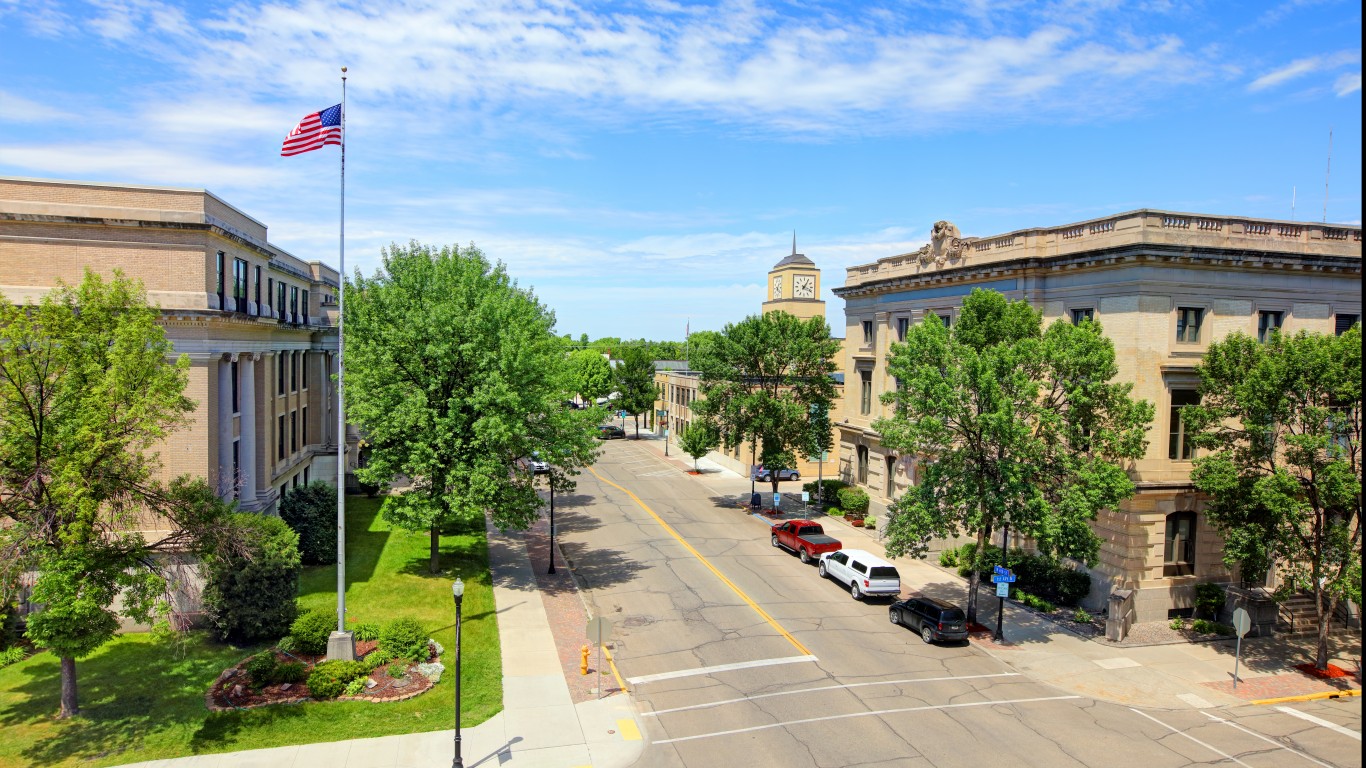
North Dakota: Grand Forks
> Middle-income range: $49,819 – $79,449 (state: $50,200 – $78,317)
> Median household income: $62,568 (state: $66,519)
> Share of income earned by middle class: 15.9% (state: 15.4%)
> Share of income earned by wealthiest 5% of households: 20.5% (state: 21.3%)
> Adults with a bachelor’s degree or higher: 33.1% (state: 31.7%)
> Metro areas considered in state: 3
[in-text-ad-2]
Ohio: Mansfield
> Middle-income range: $40,266 – $62,272 (state: $66,968 – $104,584)
> Median household income: $51,158 (state: $62,262)
> Share of income earned by middle class: 14.6% (state: 14.8%)
> Share of income earned by wealthiest 5% of households: 23.9% (state: 22.3%)
> Adults with a bachelor’s degree or higher: 17.4% (state: 30.7%)
> Metro areas considered in state: 11

Oklahoma: Lawton
> Middle-income range: $39,460 – $62,236 (state: $56,948 – $94,304)
> Median household income: $49,422 (state: $55,826)
> Share of income earned by middle class: 15.1% (state: 14.9%)
> Share of income earned by wealthiest 5% of households: 20.8% (state: 21.2%)
> Adults with a bachelor’s degree or higher: 24.3% (state: 27.9%)
> Metro areas considered in state: 4
[in-text-ad]
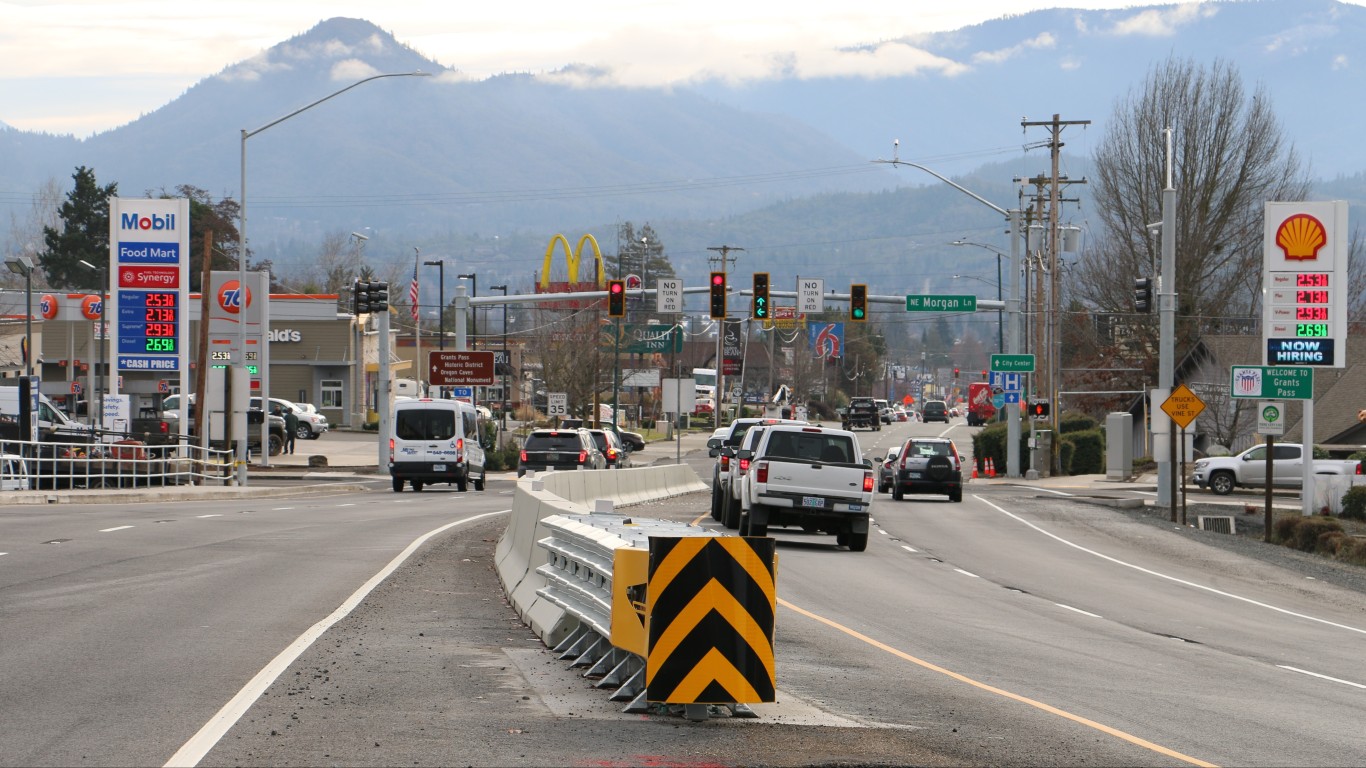
Oregon: Grants Pass
> Middle-income range: $38,208 – $61,038 (state: $39,906 – $65,189)
> Median household income: $48,785 (state: $71,562)
> Share of income earned by middle class: 14.1% (state: 15.0%)
> Share of income earned by wealthiest 5% of households: 21.6% (state: 21.4%)
> Adults with a bachelor’s degree or higher: 21.0% (state: 36.3%)
> Metro areas considered in state: 8

Pennsylvania: Johnstown
> Middle-income range: $41,576 – $67,910 (state: $66,968 – $104,584)
> Median household income: $52,995 (state: $68,957)
> Share of income earned by middle class: 14.4% (state: 14.7%)
> Share of income earned by wealthiest 5% of households: 24.8% (state: 22.2%)
> Adults with a bachelor’s degree or higher: 23.4% (state: 34.5%)
> Metro areas considered in state: 18

Rhode Island: Providence-Warwick
> Middle-income range: $57,443 – $93,753 (state: $50,200 – $78,317)
> Median household income: $73,788 (state: $74,008)
> Share of income earned by middle class: 15.2% (state: 15.0%)
> Share of income earned by wealthiest 5% of households: 20.6% (state: 21.2%)
> Adults with a bachelor’s degree or higher: 34.1% (state: 36.5%)
> Metro areas considered in state: 1
Because Providence is the only metro area with available data in Rhode Island, it ranks as having the poorest middle class by default.
[in-text-ad-2]
South Carolina: Sumter
> Middle-income range: $32,605 – $54,036 (state: $50,200 – $78,317)
> Median household income: $43,210 (state: $59,318)
> Share of income earned by middle class: 14.9% (state: 14.6%)
> Share of income earned by wealthiest 5% of households: 20.3% (state: 22.8%)
> Adults with a bachelor’s degree or higher: 22.0% (state: 31.5%)
> Metro areas considered in state: 8
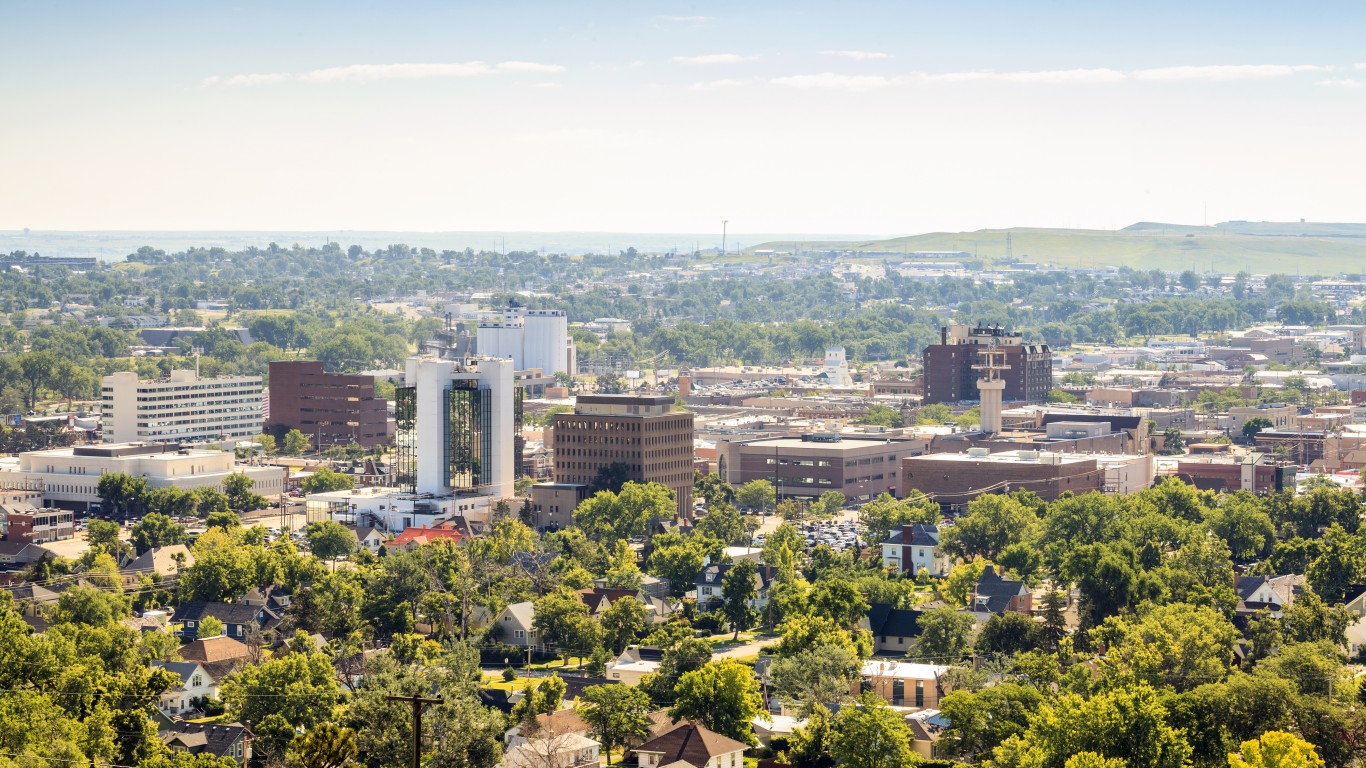
South Dakota: Rapid City
> Middle-income range: $51,138 – $74,901 (state: $39,906 – $65,189)
> Median household income: $63,342 (state: $66,143)
> Share of income earned by middle class: 15.6% (state: 15.3%)
> Share of income earned by wealthiest 5% of households: 20.7% (state: 23.0%)
> Adults with a bachelor’s degree or higher: 34.6% (state: 31.7%)
> Metro areas considered in state: 2
[in-text-ad]

Tennessee: Morristown
> Middle-income range: $33,595 – $54,763 (state: $48,732 – $77,231)
> Median household income: $43,213 (state: $59,695)
> Share of income earned by middle class: 14.0% (state: 14.3%)
> Share of income earned by wealthiest 5% of households: 22.6% (state: 23.9%)
> Adults with a bachelor’s degree or higher: 18.2% (state: 30.5%)
> Metro areas considered in state: 10
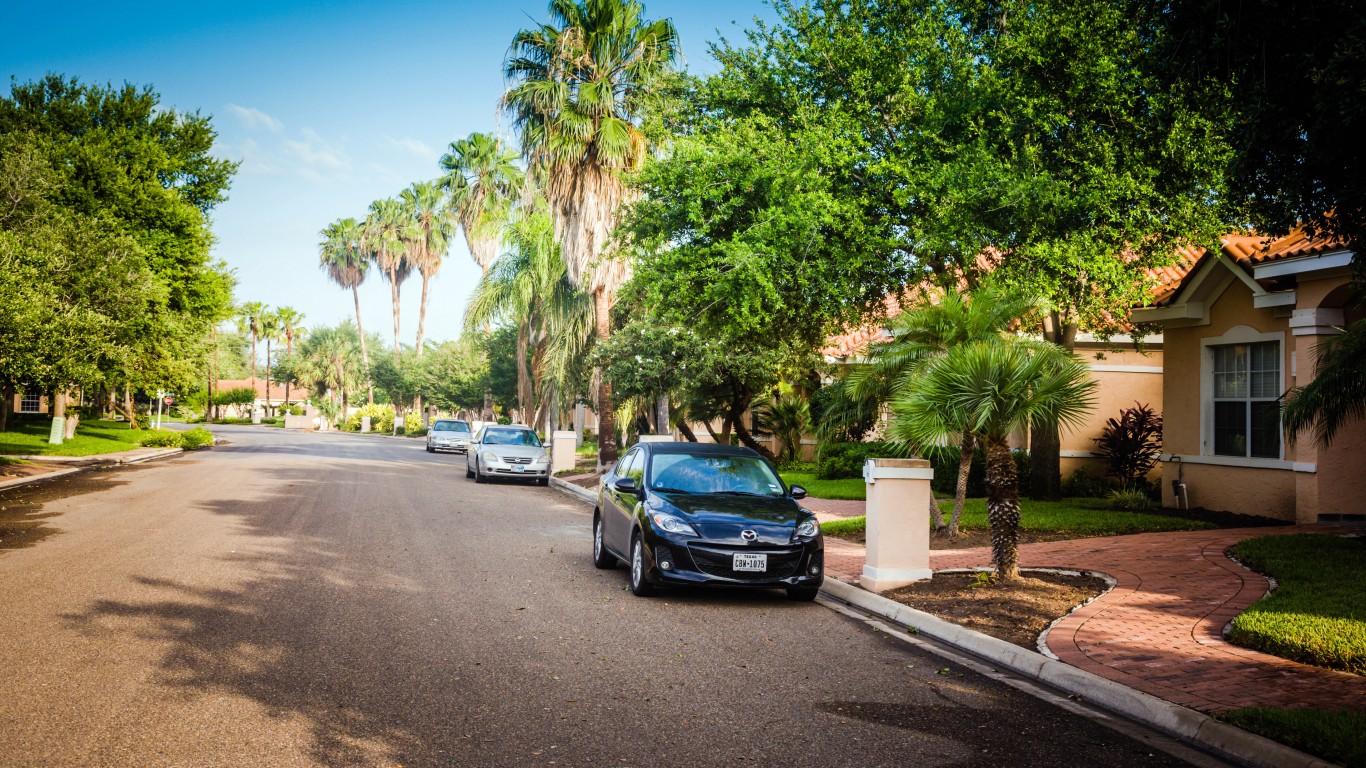
Texas: McAllen-Edinburg-Mission
> Middle-income range: $33,517 – $57,357 (state: $40,459 – $66,840)
> Median household income: $44,818 (state: $66,963)
> Share of income earned by middle class: 14.8% (state: 14.4%)
> Share of income earned by wealthiest 5% of households: 20.2% (state: 22.8%)
> Adults with a bachelor’s degree or higher: 20.0% (state: 33.1%)
> Metro areas considered in state: 25

Utah: Logan
> Middle-income range: $53,402 – $79,926 (state: $48,960 – $76,524)
> Median household income: $67,022 (state: $79,449)
> Share of income earned by middle class: 14.9% (state: 15.2%)
> Share of income earned by wealthiest 5% of households: 23.1% (state: 22.0%)
> Adults with a bachelor’s degree or higher: 37.9% (state: 36.8%)
> Metro areas considered in state: 5
[in-text-ad-2]

Vermont: Burlington-South Burlington
> Middle-income range: $65,505 – $98,761 (state: $50,618 – $77,150)
> Median household income: $81,852 (state: $72,431)
> Share of income earned by middle class: 15.4% (state: 15.3%)
> Share of income earned by wealthiest 5% of households: 20.1% (state: 21.0%)
> Adults with a bachelor’s degree or higher: 51.0% (state: 44.4%)
> Metro areas considered in state: 1
Because Burlington is the only metro area with available data in Vermont, it ranks as having the poorest middle class by default.
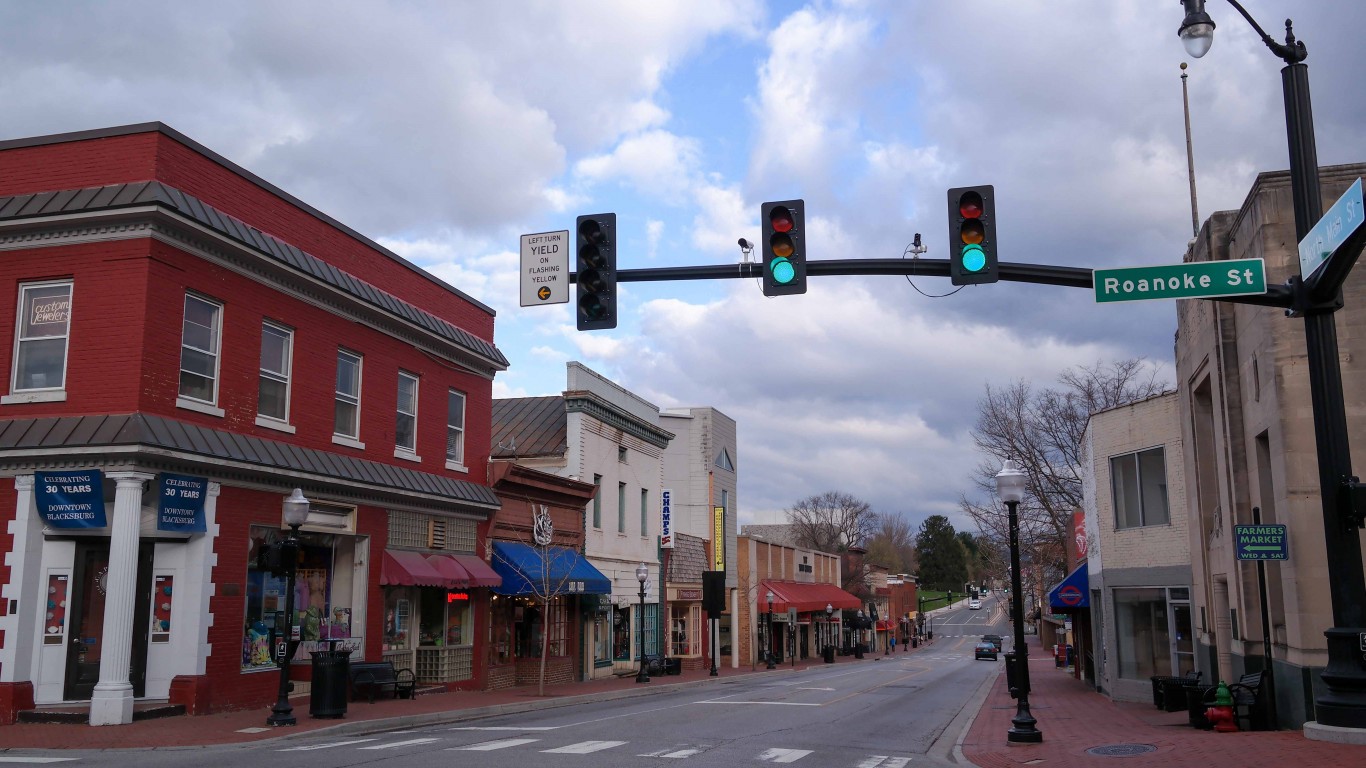
Virginia: Blacksburg-Christiansburg
> Middle-income range: $40,505 – $67,927 (state: $52,300 – $80,974)
> Median household income: $54,737 (state: $80,963)
> Share of income earned by middle class: 15.1% (state: 14.7%)
> Share of income earned by wealthiest 5% of households: 22.4% (state: 21.7%)
> Adults with a bachelor’s degree or higher: 36.2% (state: 41.8%)
> Metro areas considered in state: 9
[in-text-ad]

Washington: Yakima
> Middle-income range: $47,274 – $71,885 (state: $39,906 – $65,189)
> Median household income: $61,012 (state: $84,247)
> Share of income earned by middle class: 16.6% (state: 14.6%)
> Share of income earned by wealthiest 5% of households: 16.6% (state: 22.4%)
> Adults with a bachelor’s degree or higher: 18.4% (state: 39.0%)
> Metro areas considered in state: 11

West Virginia: Beckley
> Middle-income range: $32,271 – $54,189 (state: $53,713 – $85,848)
> Median household income: $38,737 (state: $51,248)
> Share of income earned by middle class: 14.1% (state: 14.3%)
> Share of income earned by wealthiest 5% of households: 22.3% (state: 23.4%)
> Adults with a bachelor’s degree or higher: 20.4% (state: 24.1%)
> Metro areas considered in state: 7

Wisconsin: Eau Claire
> Middle-income range: $51,278 – $75,548 (state: $37,564 – $62,640)
> Median household income: $61,684 (state: $67,125)
> Share of income earned by middle class: 15.5% (state: 15.3%)
> Share of income earned by wealthiest 5% of households: 20.4% (state: 21.2%)
> Adults with a bachelor’s degree or higher: 29.4% (state: 32.5%)
> Metro areas considered in state: 12
[in-text-ad-2]
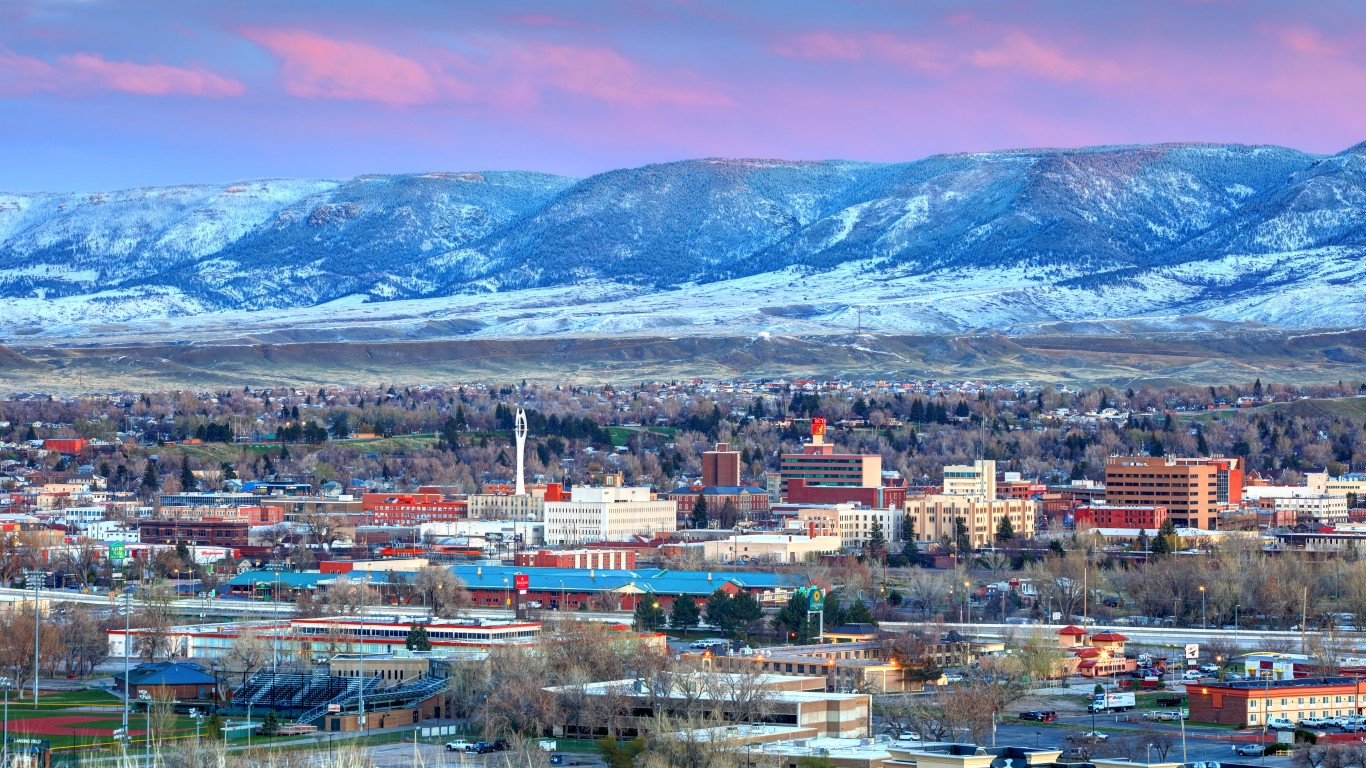
Wyoming: Casper
> Middle-income range: $51,001 – $75,905 (state: $52,295 – $82,996)
> Median household income: $63,605 (state: $65,204)
> Share of income earned by middle class: 15.4% (state: 15.1%)
> Share of income earned by wealthiest 5% of households: 23.8% (state: 22.9%)
> Adults with a bachelor’s degree or higher: 27.7% (state: 29.2%)
> Metro areas considered in state: 2
Methodology
To identify the city in every state with the weakest middle class, 24/7 Wall St. reviewed metro area level data from the U.S. Census Bureau’s 2021 American Community Survey. For each of the 384 U.S. metro areas with available data, we reviewed the income range of the middle 20% earners at the household level. In each state, the metro area with the lowest ceiling for the middle quintile of earners ranks as having the poorest middle class.
It is important to note that Delaware, New Hampshire, Rhode Island, and Vermont are each home to only one metro area. As a result, the city listed for each of these states ranks as having the poorest middle class by default only.
Population figures, as well as supplementary data on the share of income earned by the middle 20% of households by earnings, the share of income earned by the highest earning 5% of households, median household income, and adults with a bachelor’s degree or higher are also from the 2021 ACS.
The #1 Thing to Do Before You Claim Social Security (Sponsor)
Choosing the right (or wrong) time to claim Social Security can dramatically change your retirement. So, before making one of the biggest decisions of your financial life, it’s a smart idea to get an extra set of eyes on your complete financial situation.
A financial advisor can help you decide the right Social Security option for you and your family. Finding a qualified financial advisor doesn’t have to be hard. SmartAsset’s free tool matches you with up to three financial advisors who serve your area, and you can interview your advisor matches at no cost to decide which one is right for you.
Click here to match with up to 3 financial pros who would be excited to help you optimize your Social Security outcomes.
Have questions about retirement or personal finance? Email us at [email protected]!
By emailing your questions to 24/7 Wall St., you agree to have them published anonymously on a673b.bigscoots-temp.com.
By submitting your story, you understand and agree that we may use your story, or versions of it, in all media and platforms, including via third parties.
Thank you for reading! Have some feedback for us?
Contact the 24/7 Wall St. editorial team.

 24/7 Wall St.

 24/7 Wall St.
 24/7 Wall St.
 24/7 Wall St.
