
In an effort to combat the ongoing inflation crisis, the Federal Reserve raised interests rates by 25 basis points in July 2023, marking the eleventh rate hike in less than two years. When interest rates rise, mortgage rates tend to follow, and borrowing costs for home buyers are now at their highest level in over two decades.
With the average 30-year fixed mortgage rate at 7.5%, the red-hot U.S. housing market is beginning to cool. Existing home sales were down over 15% in August 2023 compared to the previous year, according to the National Association of Realtors, while the median home sale price fell over 13% in the first half of 2023, according to government data.
Still, a number of American cities are breaking from the broader trend. In these places, most homes are sold within only a few weeks and demand among homebuyers is surging.
Using data from Realtor.com, a real estate market website, 24/7 Wall St. identified America’s 30 hottest housing markets. Metro areas are ranked by their Market Hotness Index score, a proprietary measure from Realtor.com that takes into account how long homes are on the market for as well as several measures of supply and demand dynamics. All data is for April 2023.
The vast majority of the metro areas on this list are in the Midwest and the Northeast, including four in Wisconsin alone and 12 in the New England region.
As might be expected, because of the rising demand in these places, home prices are also on the rise. Two-thirds of the metro areas on this list have reported a month-over-month increase in median list price, and in all but one, the typical list price is higher now than it was a year ago. (This American city has run out of homes for sale.)
Despite the rising prices in these places, in many the housing is still relatively affordable, which may be contributing to the increase in demand. According to calculations provided by Realtor.com, the median list price in 21 of the 30 hottest metro areas is lower than the national median by anywhere from about 2% to over 60%. (Here is a look at the cheapest city to buy a home in your state.)
Click here to see America’s hottest housing markets.
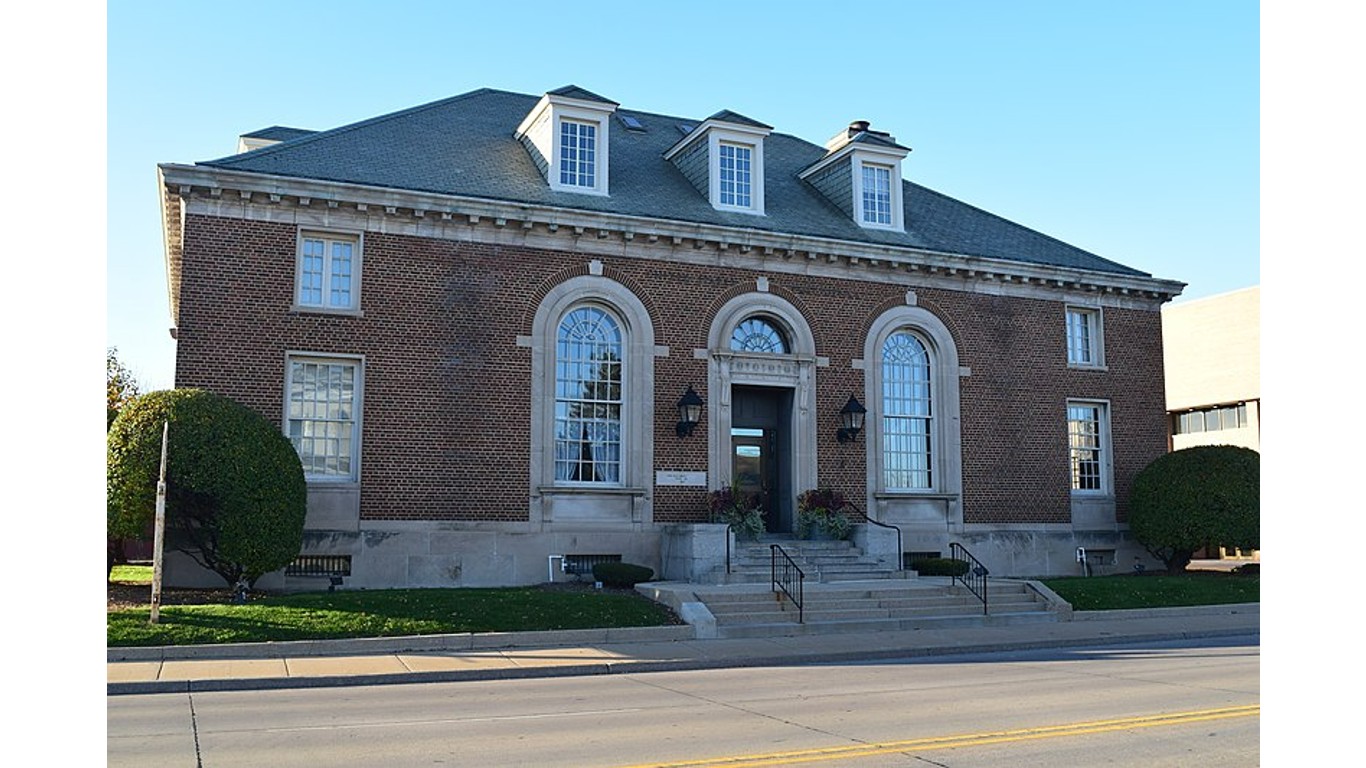
30. Oshkosh-Neenah, WI
> Hotness index score: 84.8 out of 100
> Time a house typically spends on the market: 36.5 days
> Median list price: $299,950 (31.8% less than national avg.)
> Change in median list price: -9.7% month-over-month; +2.1% year-over-year
> Total homes on the market: 311
[in-text-ad]
28. La Crosse-Onalaska, WI-MN — tied
> Hotness index score: 85.1 out of 100
> Time a house typically spends on the market: 31 days
> Median list price: $339,900 (22.7% less than national avg.)
> Change in median list price: -5.6% month-over-month; +3.2% year-over-year
> Total homes on the market: 289

28. Milwaukee-Waukesha, WI — tied
> Hotness index score: 85.1 out of 100
> Time a house typically spends on the market: 29 days
> Median list price: $374,900 (14.8% less than national avg.)
> Change in median list price: +2.7% month-over-month; +16.3% year-over-year
> Total homes on the market: 2,774

27. Peoria, IL
> Hotness index score: 85.3 out of 100
> Time a house typically spends on the market: 33 days
> Median list price: $159,900 (63.7% less than national avg.)
> Change in median list price: +6.7% month-over-month; +16.8% year-over-year
> Total homes on the market: 949
[in-text-ad-2]
26. Providence-Warwick, RI-MA
> Hotness index score: 85.6 out of 100
> Time a house typically spends on the market: 33 days
> Median list price: $525,000 (19.3% more than national avg.)
> Change in median list price: -0.9% month-over-month; +11.1% year-over-year
> Total homes on the market: 2,843

25. Toledo, OH
> Hotness index score: 86.1 out of 100
> Time a house typically spends on the market: 31 days
> Median list price: $225,000 (48.9% less than national avg.)
> Change in median list price: +4.7% month-over-month; +22.0% year-over-year
> Total homes on the market: 1,494
[in-text-ad]
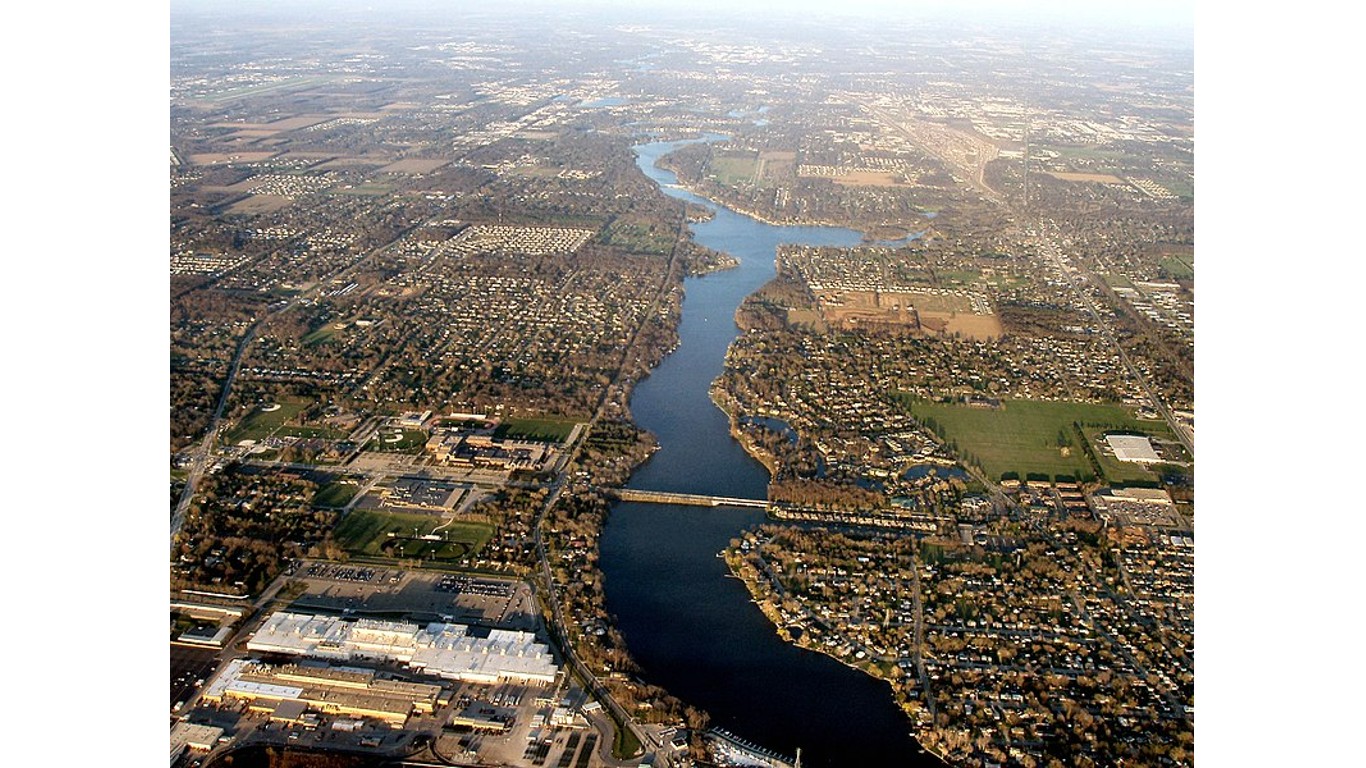
24. South Bend-Mishawaka, IN-MI
> Hotness index score: 86.5 out of 100
> Time a house typically spends on the market: 28 days
> Median list price: $299,450 (31.9% less than national avg.)
> Change in median list price: -0.2% month-over-month; -1.8% year-over-year
> Total homes on the market: 487
23. Norwich-New London, CT
> Hotness index score: 87.3 out of 100
> Time a house typically spends on the market: 35 days
> Median list price: $499,900 (13.6% more than national avg.)
> Change in median list price: +0.1% month-over-month; +25.0% year-over-year
> Total homes on the market: 705

22. Jefferson City, MO
> Hotness index score: 87.5 out of 100
> Time a house typically spends on the market: 30 days
> Median list price: $289,900 (34.1% less than national avg.)
> Change in median list price: +4.7% month-over-month; +26.1% year-over-year
> Total homes on the market: 277
[in-text-ad-2]
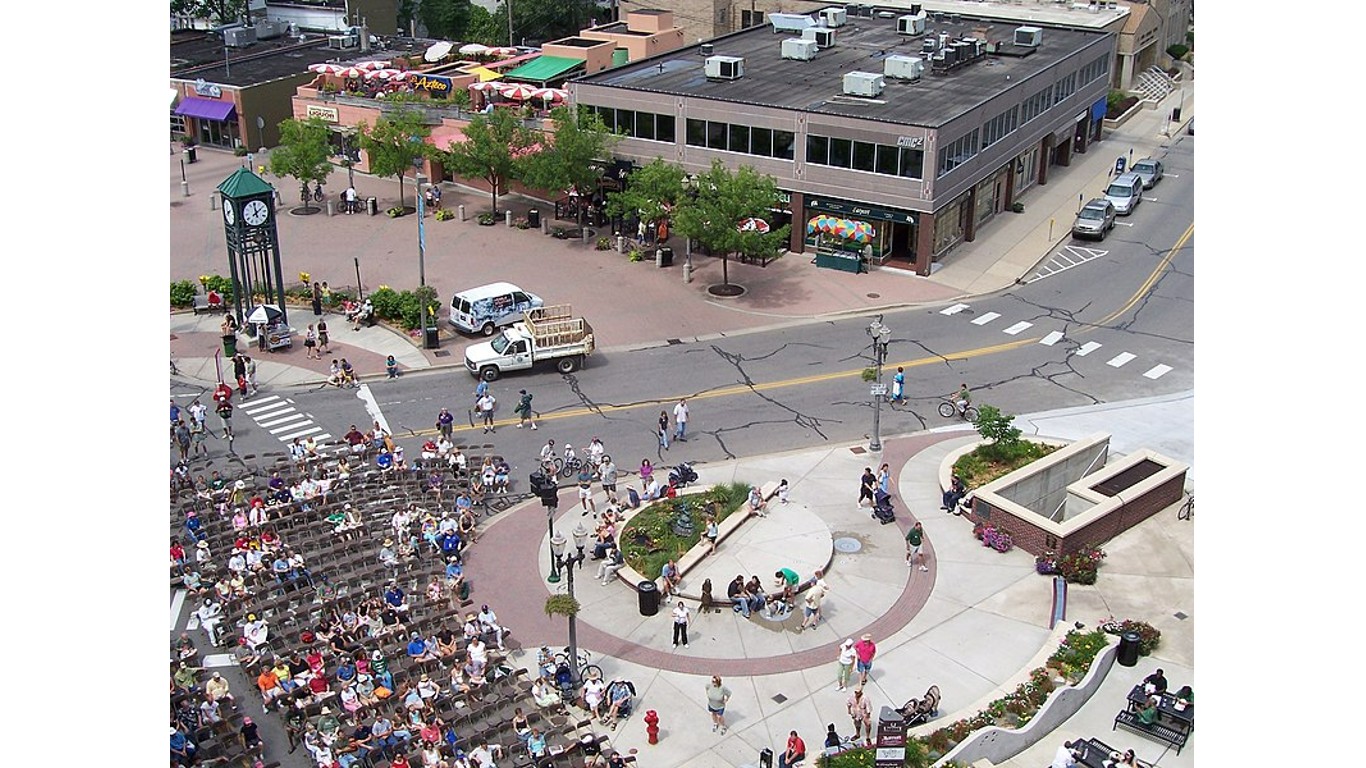
21. Lansing-East Lansing, MI
> Hotness index score: 87.5 out of 100
> Time a house typically spends on the market: 29 days
> Median list price: $219,900 (50.0% less than national avg.)
> Change in median list price: -4.3% month-over-month; +10.3% year-over-year
> Total homes on the market: 978

20. Bridgeport-Stamford-Norwalk, CT
> Hotness index score: 89.6 out of 100
> Time a house typically spends on the market: 31 days
> Median list price: $1,100,000 (150.1% more than national avg.)
> Change in median list price: -5.1% month-over-month; +30.3% year-over-year
> Total homes on the market: 2,702
[in-text-ad]

19. Johnson City, TN
> Hotness index score: 90.1 out of 100
> Time a house typically spends on the market: 33 days
> Median list price: $429,450 (2.4% less than national avg.)
> Change in median list price: +4.7% month-over-month; +22.7% year-over-year
> Total homes on the market: 488

18. Dayton-Kettering, OH
> Hotness index score: 90.3 out of 100
> Time a house typically spends on the market: 30 days
> Median list price: $230,000 (47.7% less than national avg.)
> Change in median list price: -4.2% month-over-month; +12.2% year-over-year
> Total homes on the market: 1,841
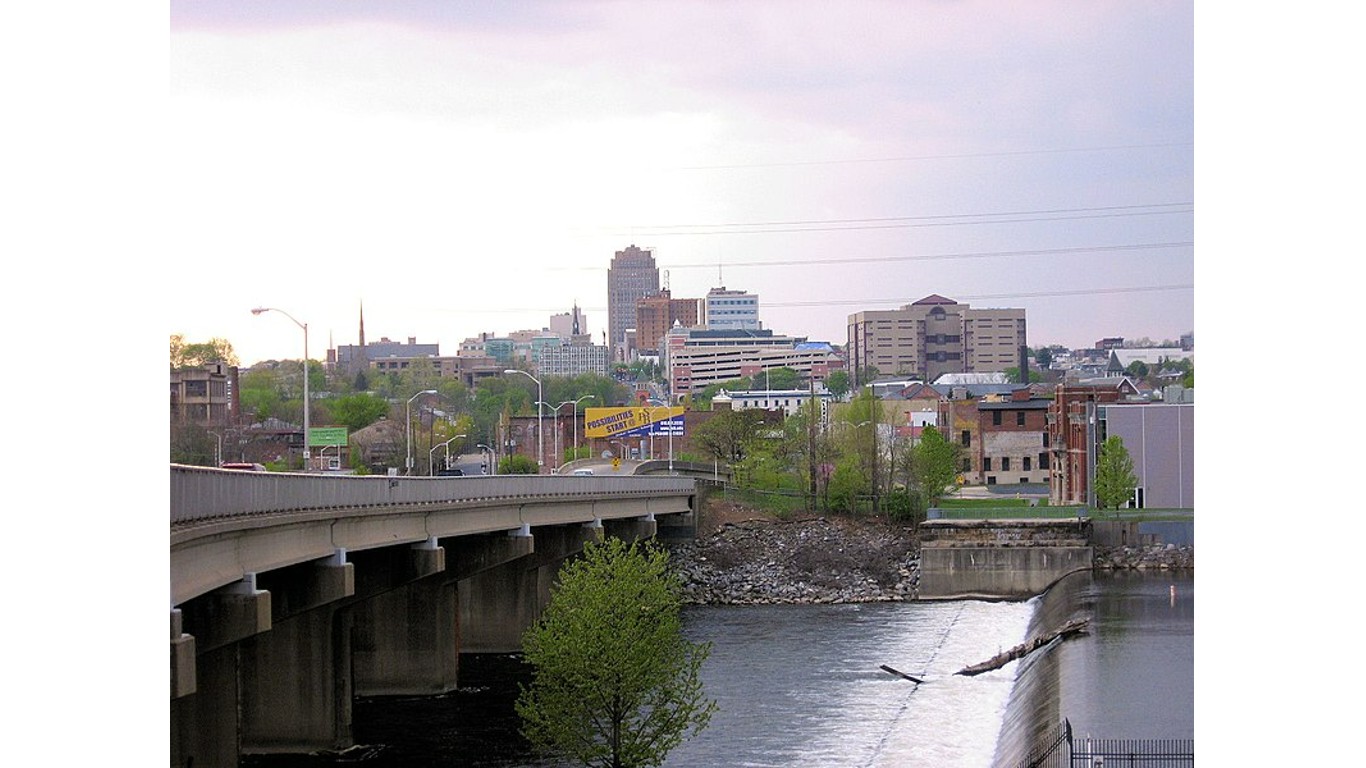
16. Allentown-Bethlehem-Easton, PA-NJ — tied
> Hotness index score: 90.3 out of 100
> Time a house typically spends on the market: 28 days
> Median list price: $383,500 (12.8% less than national avg.)
> Change in median list price: +1.2% month-over-month; +9.6% year-over-year
> Total homes on the market: 1,240
[in-text-ad-2]

16. Appleton, WI — tied
> Hotness index score: 90.3 out of 100
> Time a house typically spends on the market: 32 days
> Median list price: $392,500 (10.8% less than national avg.)
> Change in median list price: -0.8% month-over-month; +10.7% year-over-year
> Total homes on the market: 406

15. Fort Wayne, IN
> Hotness index score: 90.5 out of 100
> Time a house typically spends on the market: 29 days
> Median list price: $347,450 (21.0% less than national avg.)
> Change in median list price: +1.0% month-over-month; +23.0% year-over-year
> Total homes on the market: 451
[in-text-ad]

14. Boston-Cambridge-Newton, MA-NH
> Hotness index score: 90.6 out of 100
> Time a house typically spends on the market: 23 days
> Median list price: $849,948 (93.2% more than national avg.)
> Change in median list price: +1.3% month-over-month; +12.2% year-over-year
> Total homes on the market: 5,196
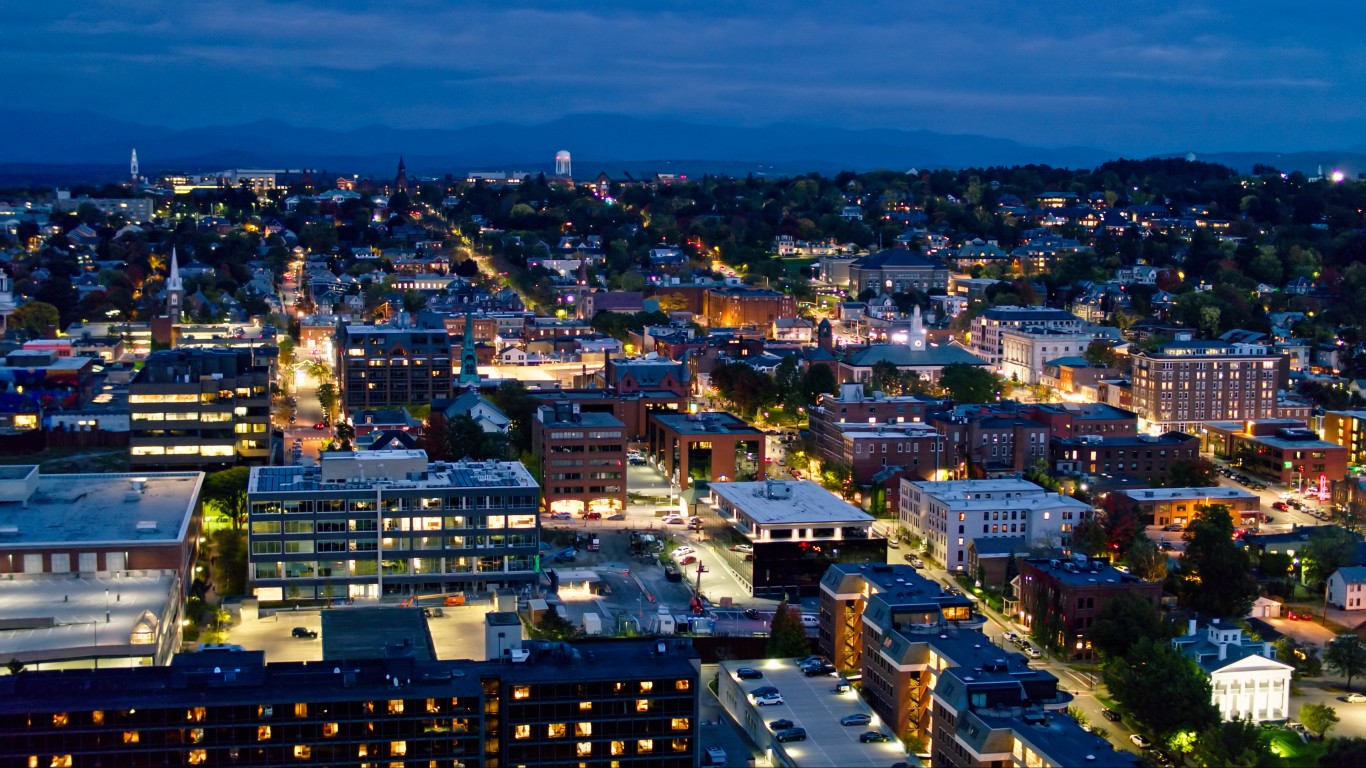
13. Burlington-South Burlington, VT
> Hotness index score: 92.1 out of 100
> Time a house typically spends on the market: 30 days
> Median list price: $483,125 (9.8% more than national avg.)
> Change in median list price: +2.3% month-over-month; +10.3% year-over-year
> Total homes on the market: 233

12. Rockford, IL
> Hotness index score: 93.1 out of 100
> Time a house typically spends on the market: 29 days
> Median list price: $212,900 (51.6% less than national avg.)
> Change in median list price: +18.3% month-over-month; +19.3% year-over-year
> Total homes on the market: 645
[in-text-ad-2]

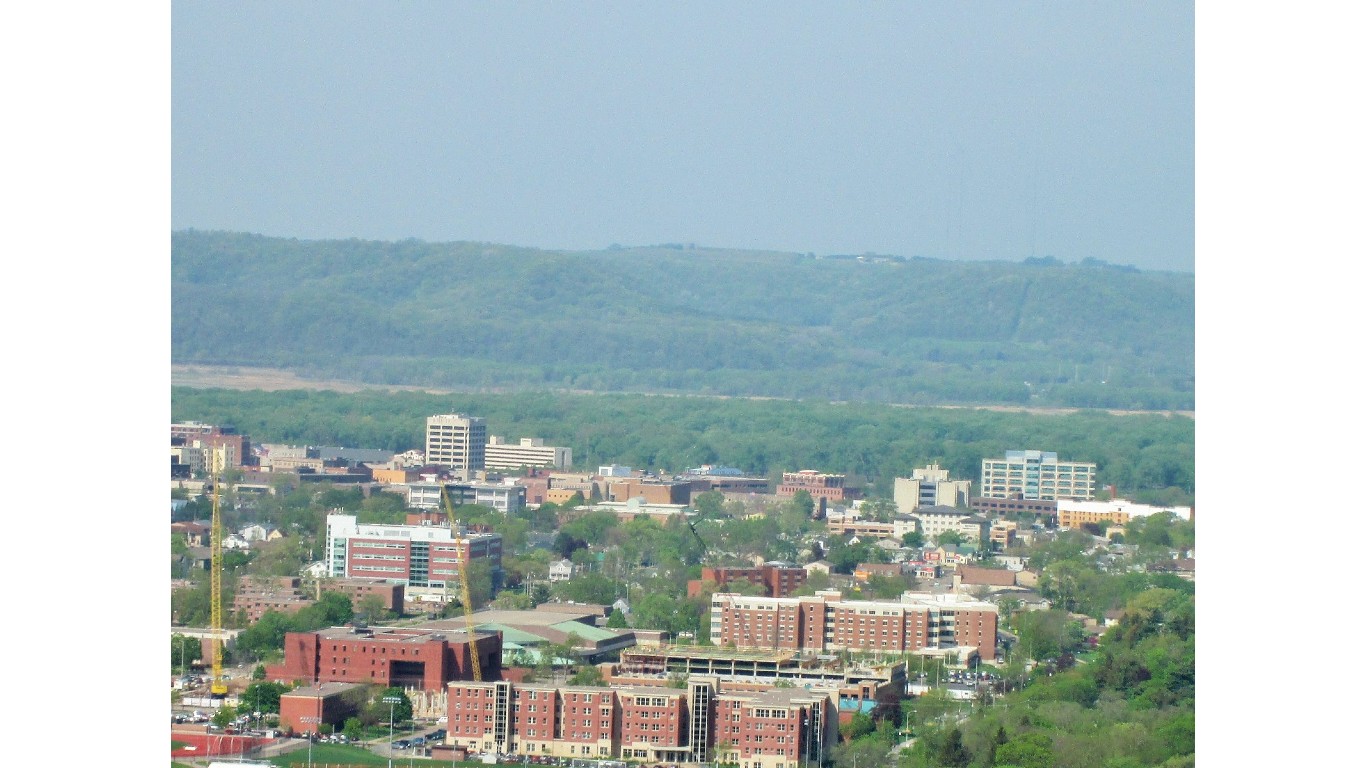
11. Eau Claire, WI
> Hotness index score: 95.5 out of 100
> Time a house typically spends on the market: 24 days
> Median list price: $375,000 (14.8% less than national avg.)
> Change in median list price: +8.1% month-over-month; +12.5% year-over-year
> Total homes on the market: 314

10. Portland-South Portland, ME
> Hotness index score: 95.8 out of 100
> Time a house typically spends on the market: 29 days
> Median list price: $620,000 (40.9% more than national avg.)
> Change in median list price: -1.4% month-over-month; +16.4% year-over-year
> Total homes on the market: 793
[in-text-ad]
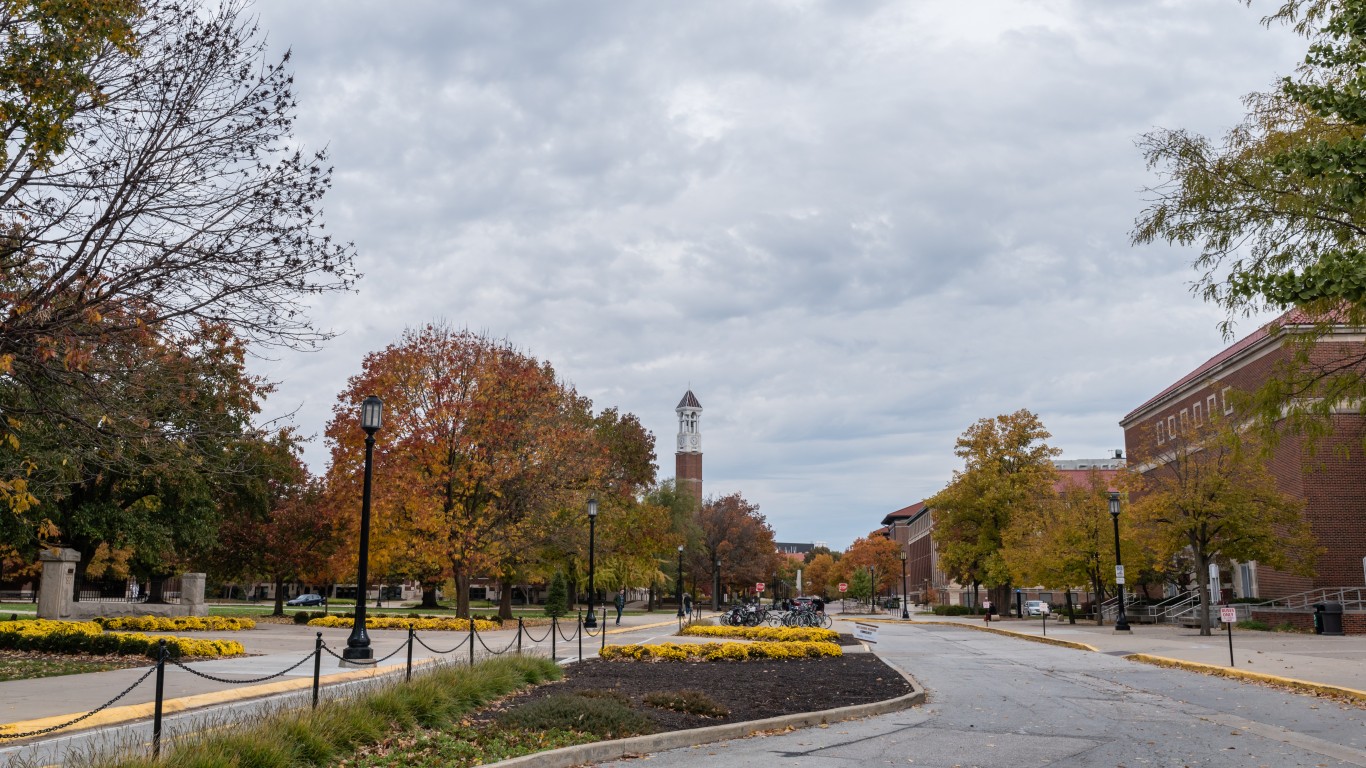
9. Lafayette-West Lafayette, IN
> Hotness index score: 96.0 out of 100
> Time a house typically spends on the market: 19 days
> Median list price: $367,900 (16.4% less than national avg.)
> Change in median list price: +11.8% month-over-month; +26.9% year-over-year
> Total homes on the market: 151

8. New Haven-Milford, CT
> Hotness index score: 96.7 out of 100
> Time a house typically spends on the market: 26 days
> Median list price: $429,900 (2.3% less than national avg.)
> Change in median list price: +7.5% month-over-month; +20.3% year-over-year
> Total homes on the market: 1,939

7. Worcester, MA-CT
> Hotness index score: 97.0 out of 100
> Time a house typically spends on the market: 19 days
> Median list price: $515,000 (17.1% more than national avg.)
> Change in median list price: +2.0% month-over-month; +9.7% year-over-year
> Total homes on the market: 991
[in-text-ad-2]

6. Columbus, OH
> Hotness index score: 97.3 out of 100
> Time a house typically spends on the market: 22 days
> Median list price: $388,900 (11.6% less than national avg.)
> Change in median list price: +1.0% month-over-month; +11.4% year-over-year
> Total homes on the market: 3,466

5. Springfield, MA
> Hotness index score: 97.8 out of 100
> Time a house typically spends on the market: 22 days
> Median list price: $377,450 (14.2% less than national avg.)
> Change in median list price: +2.3% month-over-month; +6.8% year-over-year
> Total homes on the market: 580
[in-text-ad]

3. Rochester, NY — tied
> Hotness index score: 99.0 out of 100
> Time a house typically spends on the market: 16 days
> Median list price: $264,900 (39.8% less than national avg.)
> Change in median list price: +0.0% month-over-month; +19.1% year-over-year
> Total homes on the market: 852

3. Concord, NH — tied
> Hotness index score: 99.0 out of 100
> Time a house typically spends on the market: 20 days
> Median list price: $547,400 (24.4% more than national avg.)
> Change in median list price: +4.8% month-over-month; +21.7% year-over-year
> Total homes on the market: 165

2. Hartford-East Hartford-Middletown, CT
> Hotness index score: 99.2 out of 100
> Time a house typically spends on the market: 21.5 days
> Median list price: $419,950 (4.5% less than national avg.)
> Change in median list price: +5.0% month-over-month; +15.9% year-over-year
> Total homes on the market: 2,457
[in-text-ad-2]

1. Manchester-Nashua, NH
> Hotness index score: 99.8 out of 100
> Time a house typically spends on the market: 12 days
> Median list price: $541,950 (23.2% more than national avg.)
> Change in median list price: +1.8% month-over-month; +21.9% year-over-year
> Total homes on the market: 451
It’s Your Money, Your Future—Own It (sponsor)
Are you ahead, or behind on retirement? For families with more than $500,000 saved for retirement, finding a financial advisor who puts your interest first can be the difference, and today it’s easier than ever. SmartAsset’s free tool matches you with up to three fiduciary financial advisors who serve your area in minutes. Each advisor has been carefully vetted and must act in your best interests. Start your search now.
If you’ve saved and built a substantial nest egg for you and your family, don’t delay; get started right here and help your retirement dreams become a retirement reality.
Thank you for reading! Have some feedback for us?
Contact the 24/7 Wall St. editorial team.

 24/7 Wall St.
 24/7 Wall St.