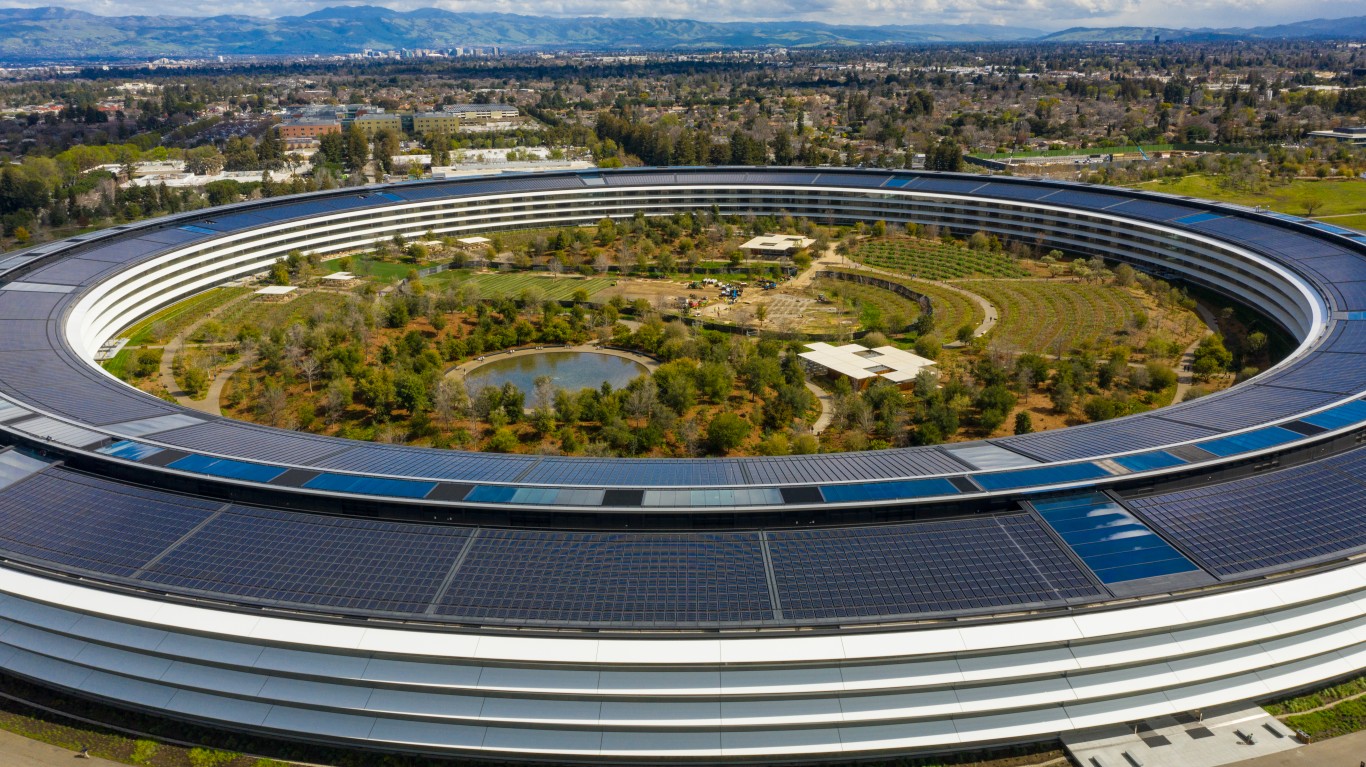
Apple Inc. (NASDAQ: AAPL) has one of the most recognizable brands in the world. The consumer electronics giant’s products include iPhones, Macs, Apple Watches, AirPods, and Apple TV. It was the first company in the world with a $3 trillion valuation. And its stock is one of the so-called Magnificent Seven that have been driving the stock market for the past year.
However, the company is not without its challenges. These include flagging demand for its most popular product, lack of enthusiasm for its new products, and regulatory headwinds. The share price this year reflects concerns about the company’s prospects.
The focus here is how much money Apple makes every minute. Let’s take a look.
How Does Apple Make Its Money?

The personal computer company was founded in 1976 and went public in late 1980. Successful products included the Macintosh and iMac. Around 2007, it expanded its focus to include digital music players, cell phones, and tablets. Today, it offers a wide variety of wearables and accessories, as well as services such as iTunes, iCloud, and Apple Pay.
Out of Apple’s $383 billion in revenue last year, some $200 billion came from iPhone sales, while nearly $40 billion came from wearables and accessories and less than $30 billion from Mac sales. Its three biggest markets are North America (around 40% of its revenue comes from the United States), Europe, and China. iPhone sales in China have been sluggish.
Here is a look at annual revenue and revenue per minute for the past five years:
| Fiscal Year | Annual Revenue | Revenue per Minute |
| 2023 | $383.29 billion | $729,242.77 |
| 2022 | $394.33 billion | $750,247.34 |
| 2021 | $365.82 billion | $696,004.57 |
| 2020 | $274.52 billion | $522,298.33 |
| 2019 | $260.17 billion | $494,996.19 |
How Much Does Apple Really Make?

Revenue is not the full picture, of course. Net income, also called profits or earnings, is what is left after expenses such as cost of goods sold, taxes, and interest are subtracted. In other words, it is the bottom line (of the income statement), as opposed to revenue, the top line.
As Apple’s top line has mostly grown in recent years, so too have its operating expenses. At the end of 2019, quarterly operating expenses totaled about $2.11 billion. That came in at $8.49 billion most recently, though that was less than in the fourth quarters of the previous two years. So how has that affected the bottom line?
Here is a look at annual net income and net income per minute for the past five years:
| Fiscal Year | Annual Net Income | Net Income per Minute |
| 2023 | $97.00 billion | $184,550.99 |
| 2022 | $99.80 billion | $189.878.23 |
| 2021 | $94.68 billion | $180,136.99 |
| 2020 | $57.41 billion | $109.227.55 |
| 2019 | $55.26 billion | $105,136.99 |
How Has Apple Stock Fared?

The stock is up around 785% in the past decade (split adjusted), easily outperforming the broader markets. Much of that growth has come since mid-2019, but note that the share price is about 12% lower year to date. The stock hit an all-time high of nearly $200 back in December but was last seen changing hands for about $170 per share.
The $186.24 mean price target is less than that all-time high, but it indicates that analysts overall see more than 9% upside potential in the coming year. Their consensus recommendation is to buy shares. (Warren Buffett sold some Apple shares and all of these four other stocks.)
Want to Retire Early? Start Here (Sponsor)
Want retirement to come a few years earlier than you’d planned? Or are you ready to retire now, but want an extra set of eyes on your finances?
Now you can speak with up to 3 financial experts in your area for FREE. By simply clicking here you can begin to match with financial professionals who can help you build your plan to retire early. And the best part? The first conversation with them is free.
Click here to match with up to 3 financial pros who would be excited to help you make financial decisions.
Thank you for reading! Have some feedback for us?
Contact the 24/7 Wall St. editorial team.


