This post may contain links from our sponsors and affiliates, and Flywheel Publishing may receive
compensation for actions taken through them.
compensation for actions taken through them.
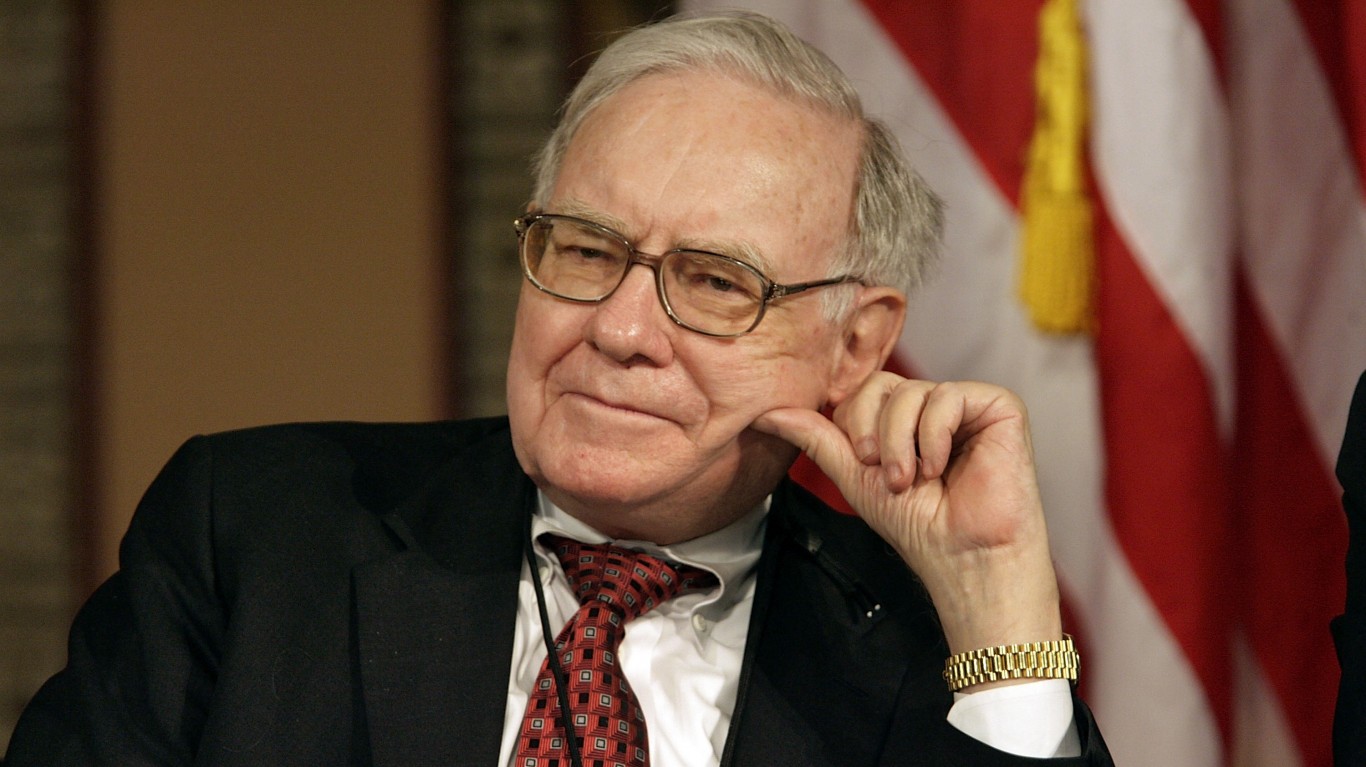
Warren Buffett is one of the greatest and most respected investors of all time. Most investors would like to emulate Buffett’s investing style in their portfolios, which is not easy, but we can certainly learn from his strategies.
Berkshire Hathaway (BRK.A) has increased in value by more than 5,600,000% since Buffett took control of the company in 1965, which is an unbelievable 20% annually and double the S&9 500 over that time.
The legendary investor favors companies with “economic moats,” which are like “economic castles protected by unbreachable moats.” In simple terms, a moat is a unique competitive advantage that enables a company to outperform others in the same industry over time.
Key Insights from 24/7 Wall St.
- Warren Buffett is widely regarded as one of the most successful investors achieving an average annual growth of 20%, doubling the S&P 500’s performance.
- Buffett’s strategy often focuses on companies with “economic moats,” which are unique competitive advantages that allow companies to sustain superior performance within their industries.
- Now may be the time to review your retirement plan with a top-notch financial advisor. Click here to find out more.
VanEck Morningstar Wide Moat ETF
The VanEck Morningstar Wide Moat ETF (MOAT) invests in attractively priced companies with sustainable competitive advantages. The ETF aims to track the performance of wide moat companies in the United States. The fund uses Morningstar equity analysts to select companies with long-term competitive advantages relative to their fair market value.
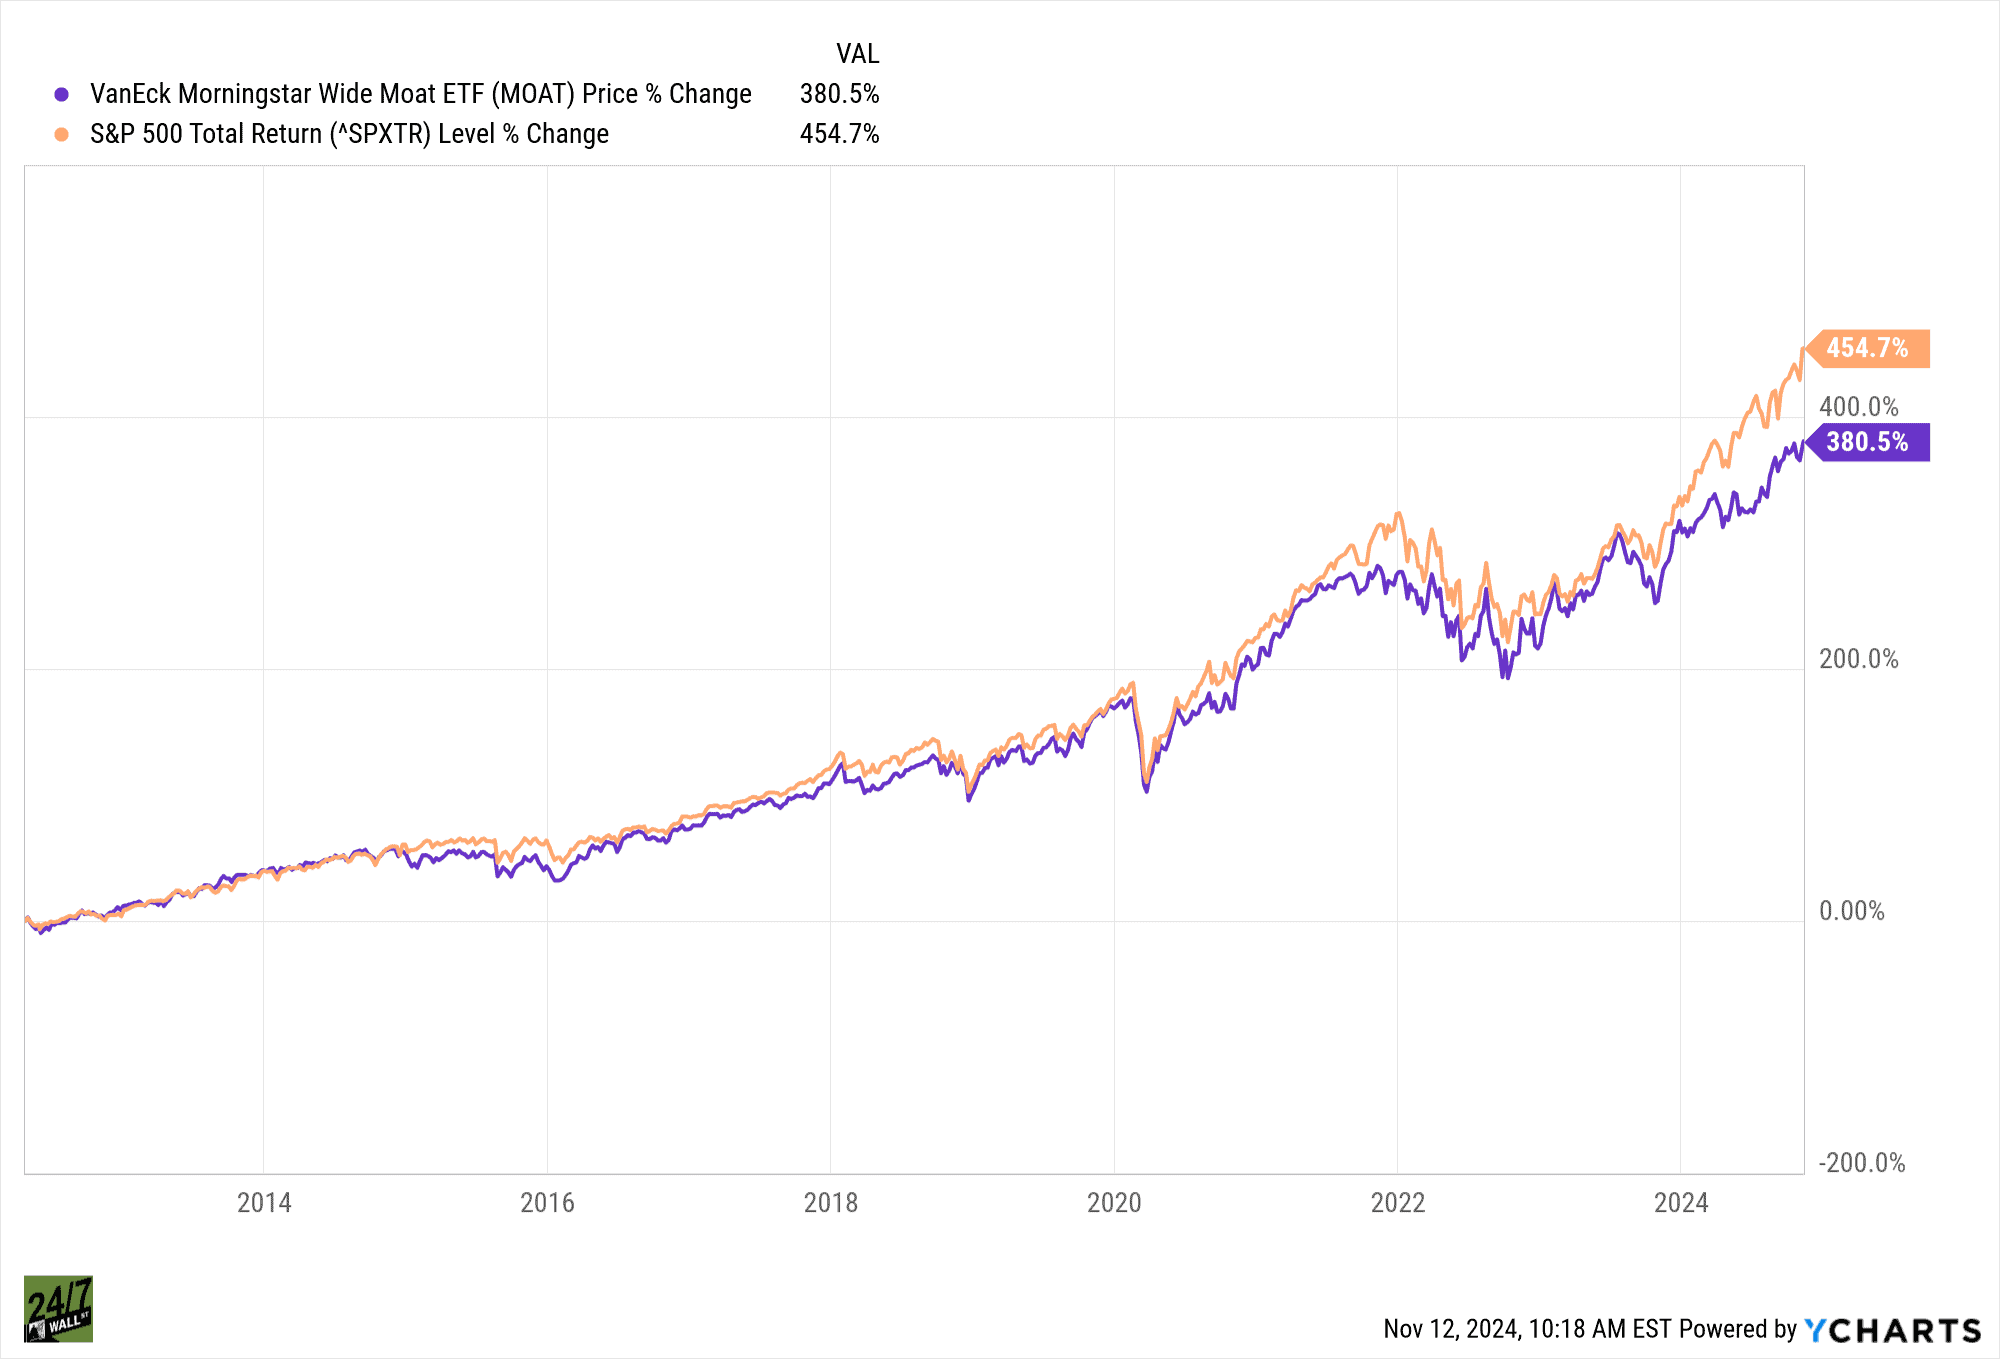
Since its inception in 2012, MOAT is up 380% compared to the S&P 500’s 454% gains.

Here are the current top 15 holdings in the VanEck Morningstar Wide Moat ETF:
| Ticker | Holdings Name | Shares | % of Net Assets | Market Value |
| CRM | Salesforce.Com | 1,510,981 | 3.19% | $516,347,537.13 |
| GILD | Gilead Sciences | 5,136,134 | 3.08% | $498,359,082.02 |
| BMY | Bristol-Myers Squibb | 8,175,897 | 3.02% | $489,082,158.54 |
| ADSK | Autodesk | 1,529,241 | 2.97% | $480,013,457.49 |
| TRU | Transunion | 4,319,969 | 2.85% | $461,243,090.13 |
| EMR | Emerson Electric | 3,541,518 | 2.83% | $457,564,125.60 |
| BIO | Bio-Rad Laboratories | 1,237,487 | 2.80% | $452,858,367.65 |
| USB | Us Bancorp | 8,815,473 | 2.78% | $449,941,741.92 |
| MKTX | Marketaxess Holdings | 1,639,388 | 2.78% | $449,585,765.12 |
| KVUE | Kenvue | 18,140,045 | 2.66% | $431,370,270.10 |
| VEEV | Veeva Systems | 1,784,312 | 2.61% | $422,649,983.44 |
| ALLE | Allegion | 2,862,541 | 2.54% | $410,574,255.63 |
| MO | Altria Group | 7,528,464 | 2.51% | $406,010,063.52 |
| CTVA | Corteva | 6,894,686 | 2.49% | $403,477,024.72 |
| DIS | Walt Disney | 3,932,868 | 2.45% | $396,669,066.48 |
| ZBH | Zimmer Biomet Holdings | 3,468,175 | 2.34% | $379,626,435.50 |
SPDR MSCI USA StrategicFactors ETF (QUS)
In the past, Buffett invested in undervalued companies with great potential, which he called “cigar butts.” However, his thinking later evolved to “it’s far better to buy a wonderful company at a fair price than a fair company at a wonderful price.”
The SPDR MSCI USA StrategicFactors ETF aims to invest in high-quality firms with durable balance sheets and stable cash flows, trading at reasonable valuations.
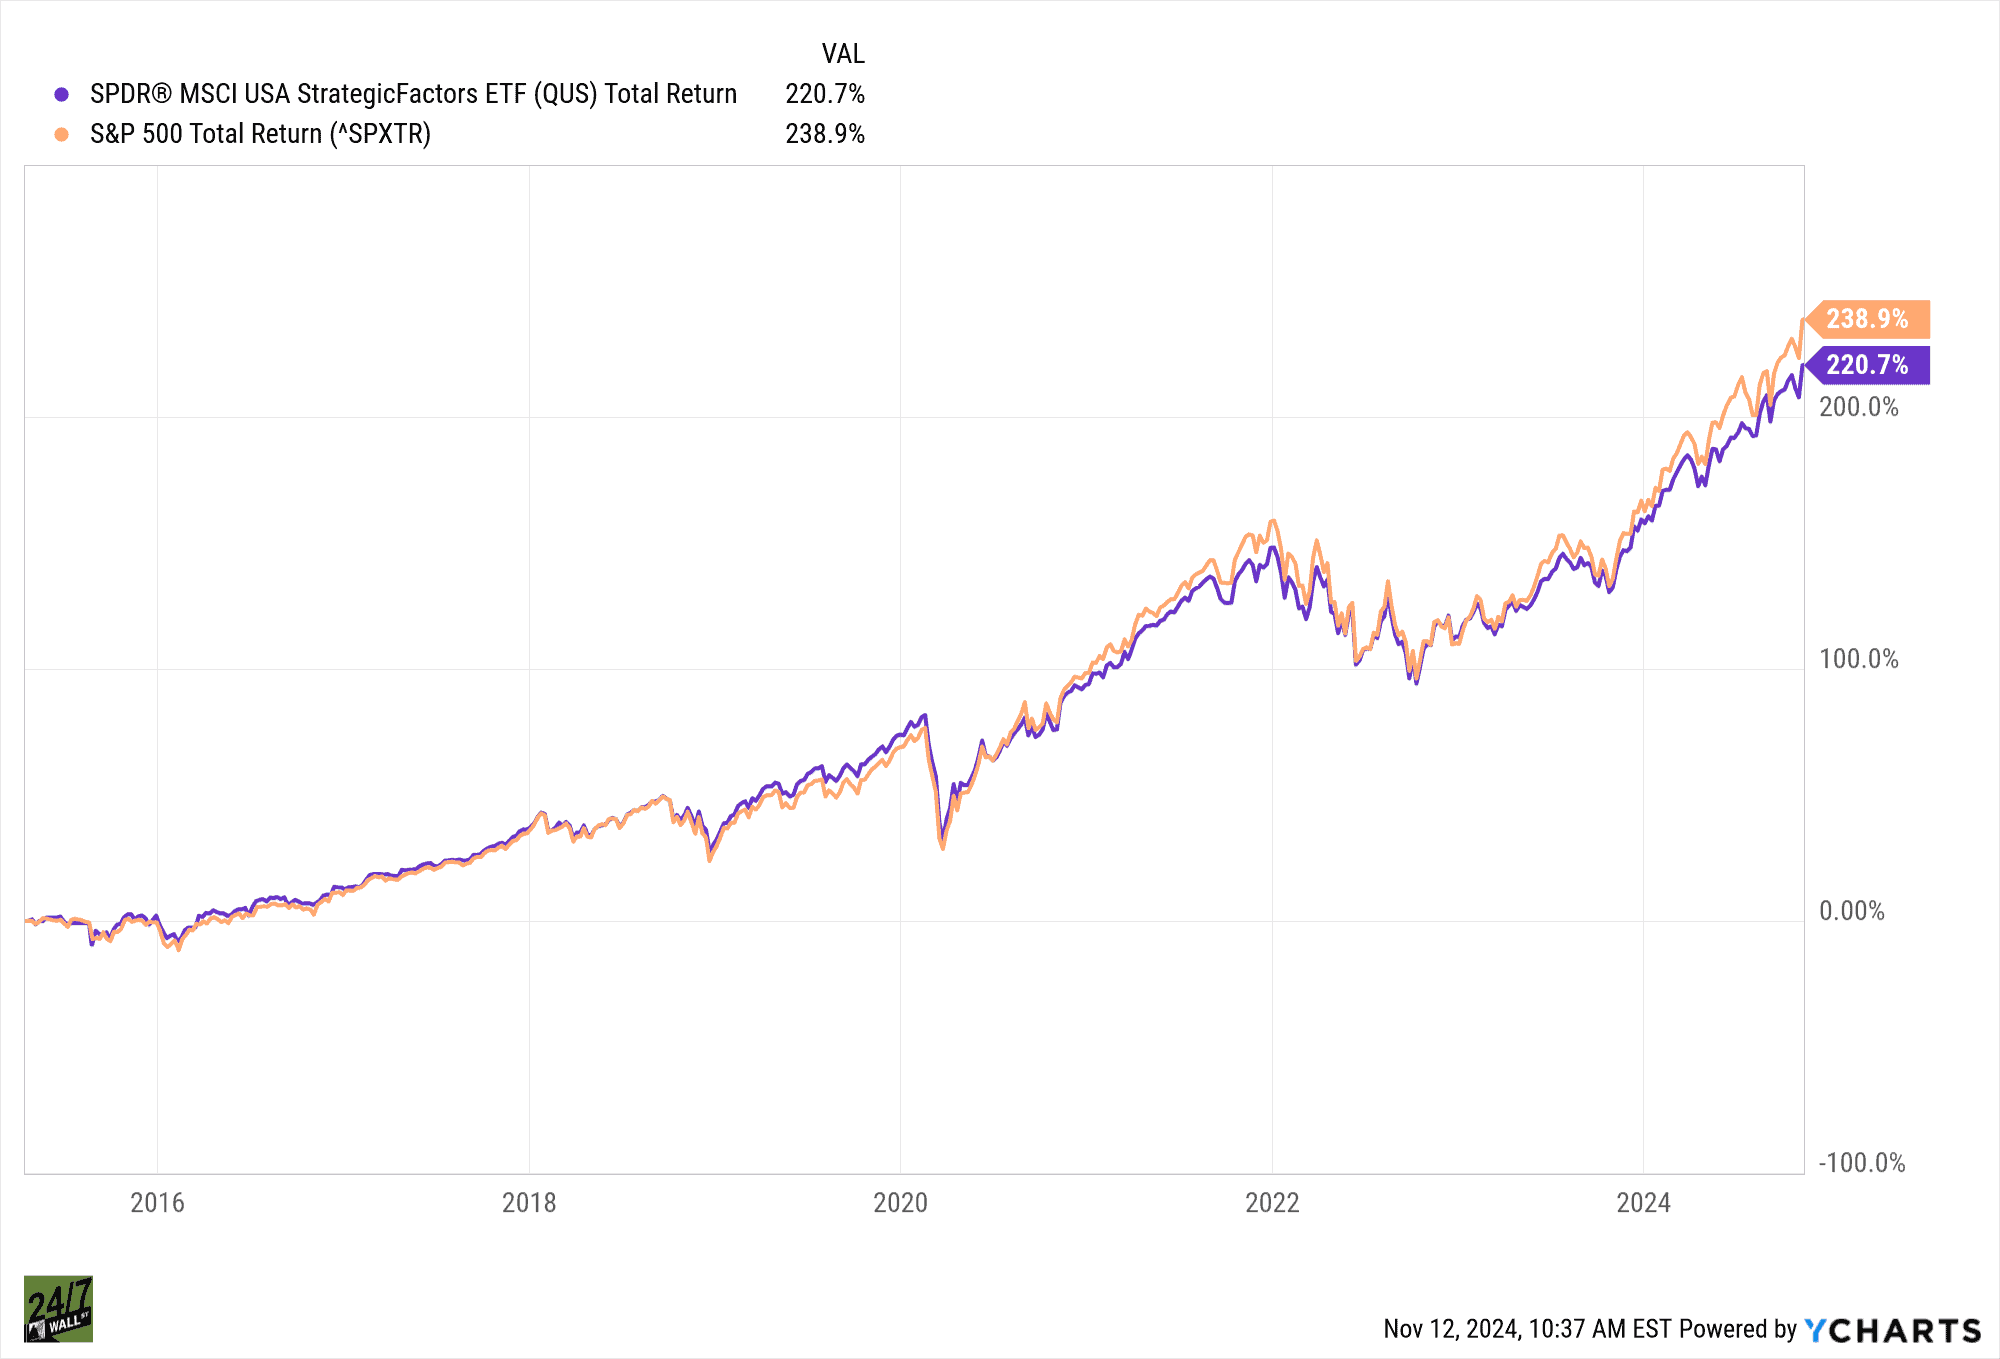
The SPDR StrategicFactors ETF closely followed the performance of the S&P 500 since inception in 2015 but the broad market index outperformed the ETF.

As of the time of this writing, these are the top 15 stocks in the QUS ETF.
| Ticker | Holdings Name | Shares | Weight |
| AAPL | APPLE | 205,881 | 3.16% |
| NVDA | NVIDIA | 277,738 | 2.76% |
| MSFT | MICROSOFT | 92,970 | 2.66% |
| META | META PLATFORMS | 59,759 | 2.38% |
| UNH | UNITEDHEALTH GROUP | 53,431 | 2.28% |
| LLY | ELI LILLY | 36,864 | 2.10% |
| V | VISA INC CLASS A SHARES | 88,050 | 1.87% |
| MA | MASTERCARD INC | 46,257 | 1.68% |
| JNJ | JOHNSON + JOHNSON | 152,658 | 1.62% |
| CSCO | CISCO SYSTEMS INC | 33,3650 | 1.34% |
| COST | COSTCO | 20,625 | 1.32% |
| GOOGL | ALPHABET INC | 99,780 | 1.23% |
| ACN | ACCENTURE PLC | 47,615 | 1.16% |
| GOOG | ALPHABET INC | 91,878 | 1.14% |
| TXN | TEXAS INSTRUMENTS INC | 75,105 | 1.11% |
| BRK.B | BERKSHIRE HATHAWAY | 33,533 | 1.07% |
SPDR Portfolio S&P 500 ETF (SPLG)
Buffett has long recommended that most investors should stick with low-cost index funds. The iShares Core S&P 500 ETF IVV and Vanguard S&P 500 ETF VOO charge just 0.03% each, but SPDR Portfolio S&P 500 ETF SPLG‘s new fee of 0.02% makes it the cheapest in the space.
The SPDR Portfolio S&P 500 ETF offers broad exposure and aims to replicate the S&P 500 total returns and contains exposure to 80% of the U.S. stock market.

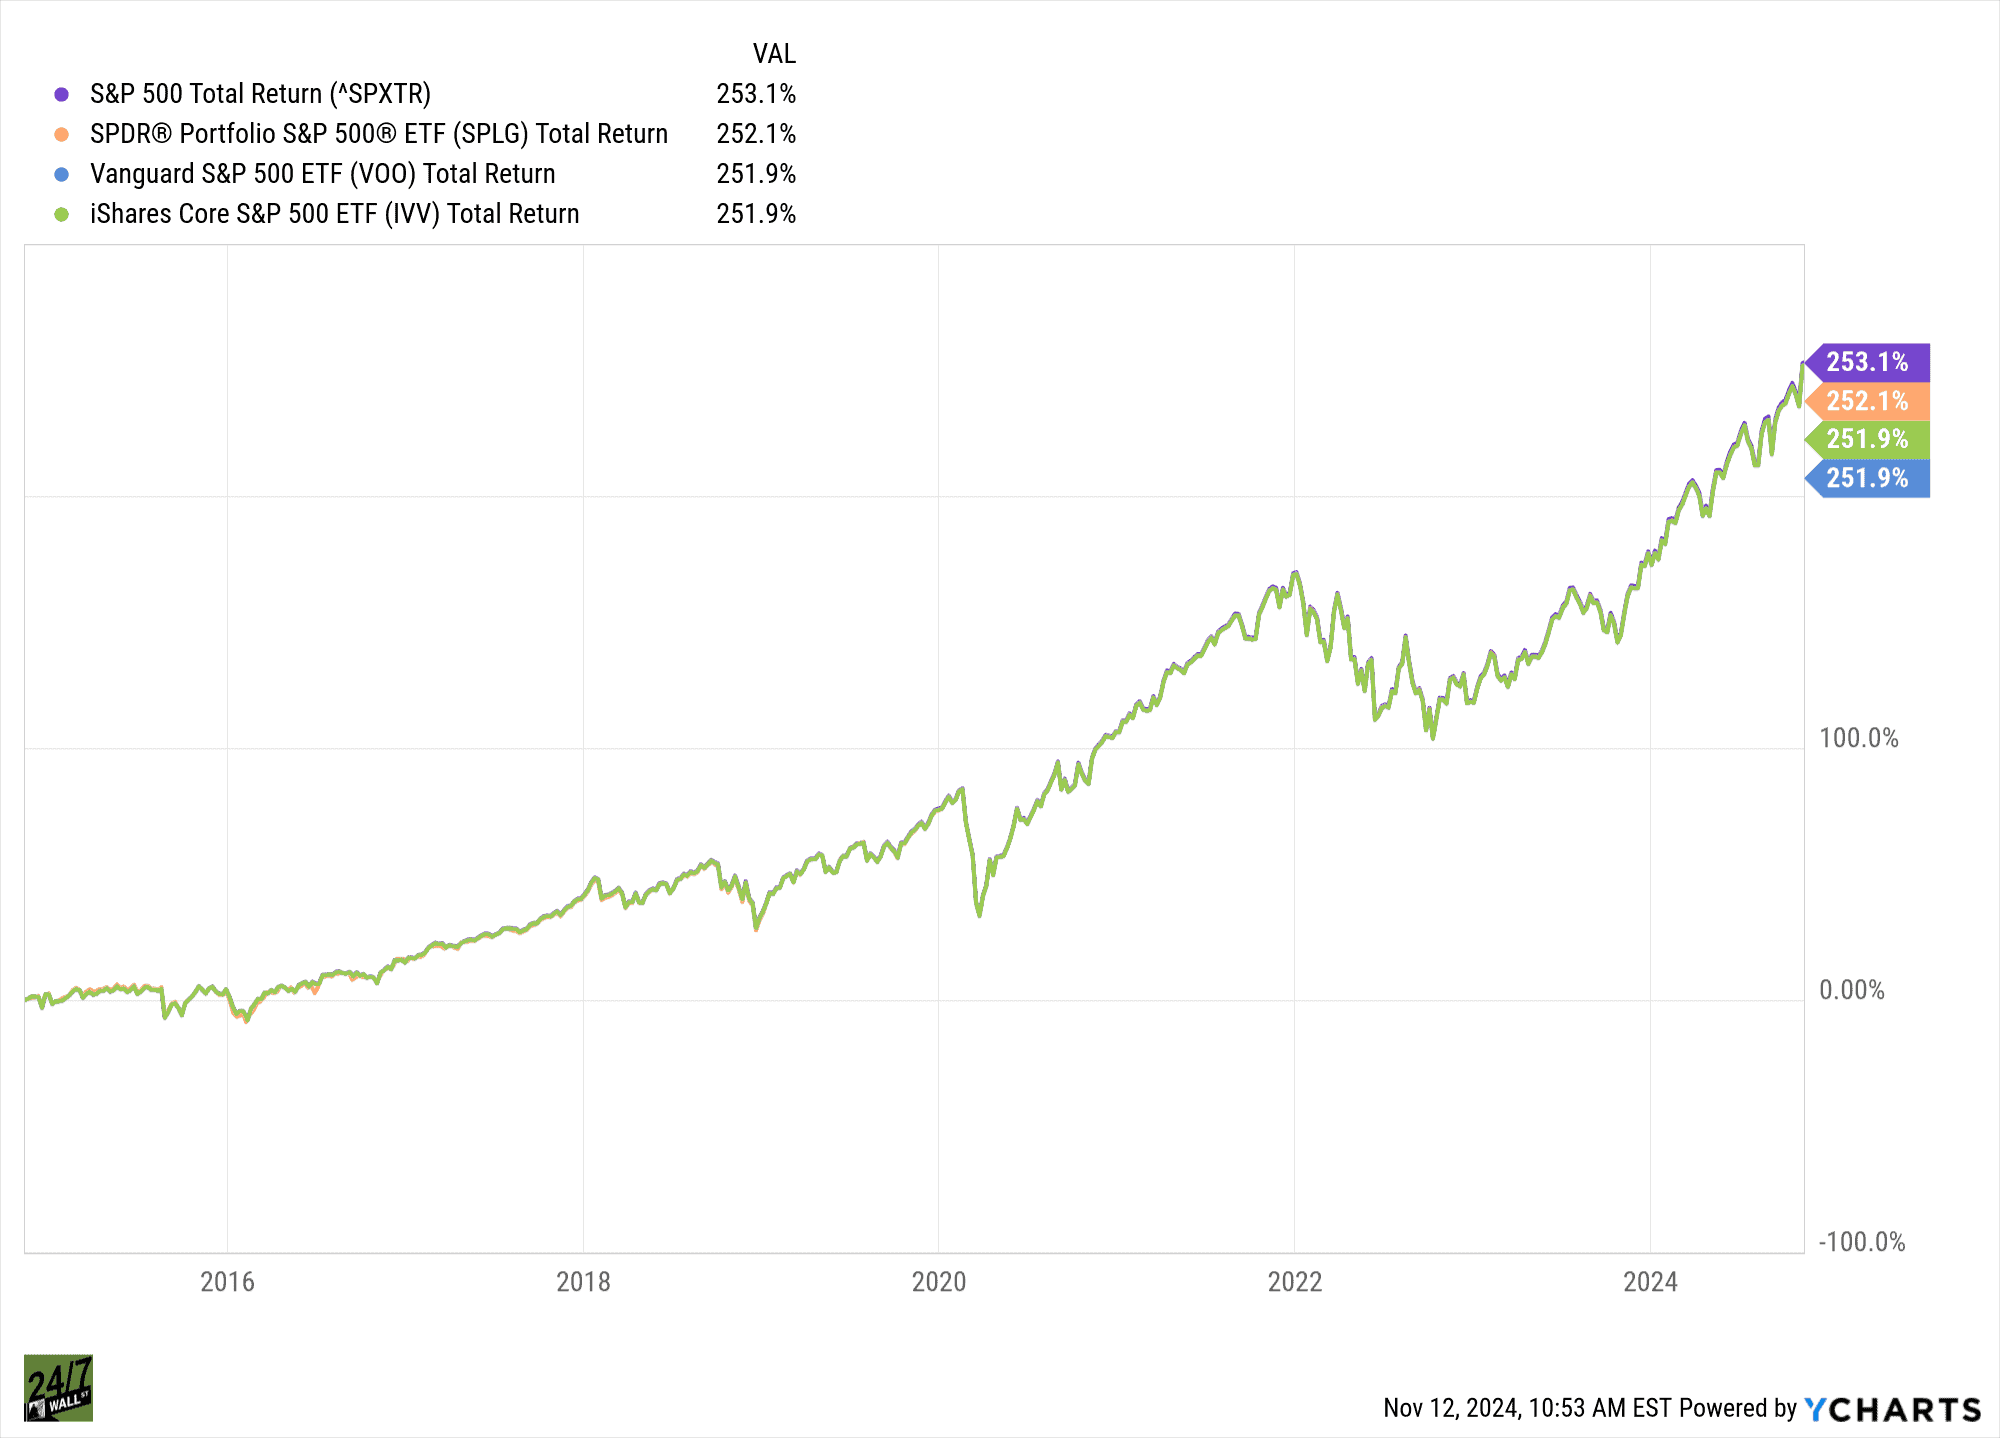
As you can see in the chart above, the total returns for all three ETFs mentioned track the S&P 500 very closely, and with a slightly less expense ratio of SPLG, the SPDR Portfolio S&P 500 ETF is our selected ETF for broad market exposure.
Currently, here are the top 15 stocks in SPLG:
| Ticker | Holdings Name | Shares | % of Net Assets |
| NVDA | NVIDIA | 24,932,135.00 | 7.03% |
| AAPL | APPLE | 15,409,480.00 | 6.71% |
| MSFT | MICROSOFT | 7,533,485.00 | 6.11% |
| AMZN | AMAZON.COM | 9,467,733.00 | 3.80% |
| META | META PLATFORMS INC | 2,214,518.00 | 2.51% |
| GOOGL | ALPHABET INC | 5,939,093.00 | 2.08% |
| TSLA | TESLA | 2,812,712.00 | 1.91% |
| GOOG | ALPHABET INC | 4,869,007.00 | 1.72% |
| BRK.B | BERKSHIRE HATHAWAY | 1,856,943.00 | 1.69% |
| AVGO | BROADCOM | 4,718,797.00 | 1.64% |
| JPM | JPMORGAN CHASE | 2,884,448.00 | 1.34% |
| LLY | ELI LILLY | 799,109.00 | 1.29% |
| UNH | UNITEDHEALTH GROUP | 935,812.00 | 1.14% |
| XOM | EXXON MOBIL | 4,502,512.00 | 1.05% |
| V | VISA INC | 1,693,029.00 | 1.02% |
| MA | MASTERCARD | 836,005.00 | 0.86% |
It’s Your Money, Your Future—Own It (sponsor)
Are you ahead, or behind on retirement? For families with more than $500,000 saved for retirement, finding a financial advisor who puts your interest first can be the difference, and today it’s easier than ever. SmartAsset’s free tool matches you with up to three fiduciary financial advisors who serve your area in minutes. Each advisor has been carefully vetted and must act in your best interests. Start your search now.
If you’ve saved and built a substantial nest egg for you and your family, don’t delay; get started right here and help your retirement dreams become a retirement reality.
Thank you for reading! Have some feedback for us?
Contact the 24/7 Wall St. editorial team.


