FELG and VUG are both down significantly this year, but one of them uses a quantitative model that can shift away from the names dragging it lower. The other cannot.
Vanguard Growth Index Fund ETF Shares (NYSEARCA:VUG | VUG Price Prediction) has been one of the harder-hit passive growth funds this year, sliding from near $488 at the open of 2026 to around $450 a share — a loss of down 7.76% year-to-date year-to-date. Fidelity Nasdaq Composite Index ETF (NASDAQ:ONEQ) has held up somewhat better, down down 4.38% year-to-date, a shallower decline that reflects its broader exposure across 700-plus securities Nasdaq-listed securities rather than a concentrated bet on the largest growth names. Both funds are passive trackers with no mechanism to reduce exposure when mega-cap tech sentiment turns.
Fidelity Enhanced Large Cap Growth ETF (NYSEARCA:FELG) is down 7.77% year-to-date, nearly identical to VUG’s loss on the surface. But the structure underneath is different, and that difference matters for how each fund might recover.
The Macro Factor That Will Drive Recovery: The Fed’s Next Move
The most important external force on all three funds right now is the trajectory of interest rates. The Federal Reserve has cut its benchmark rate 75 basis points over the past six months, bringing the federal funds rate to 3.75% as of March 18, 2026. Growth stocks are sensitive to rate moves because their value is concentrated in future earnings, which get discounted more heavily when rates are high.
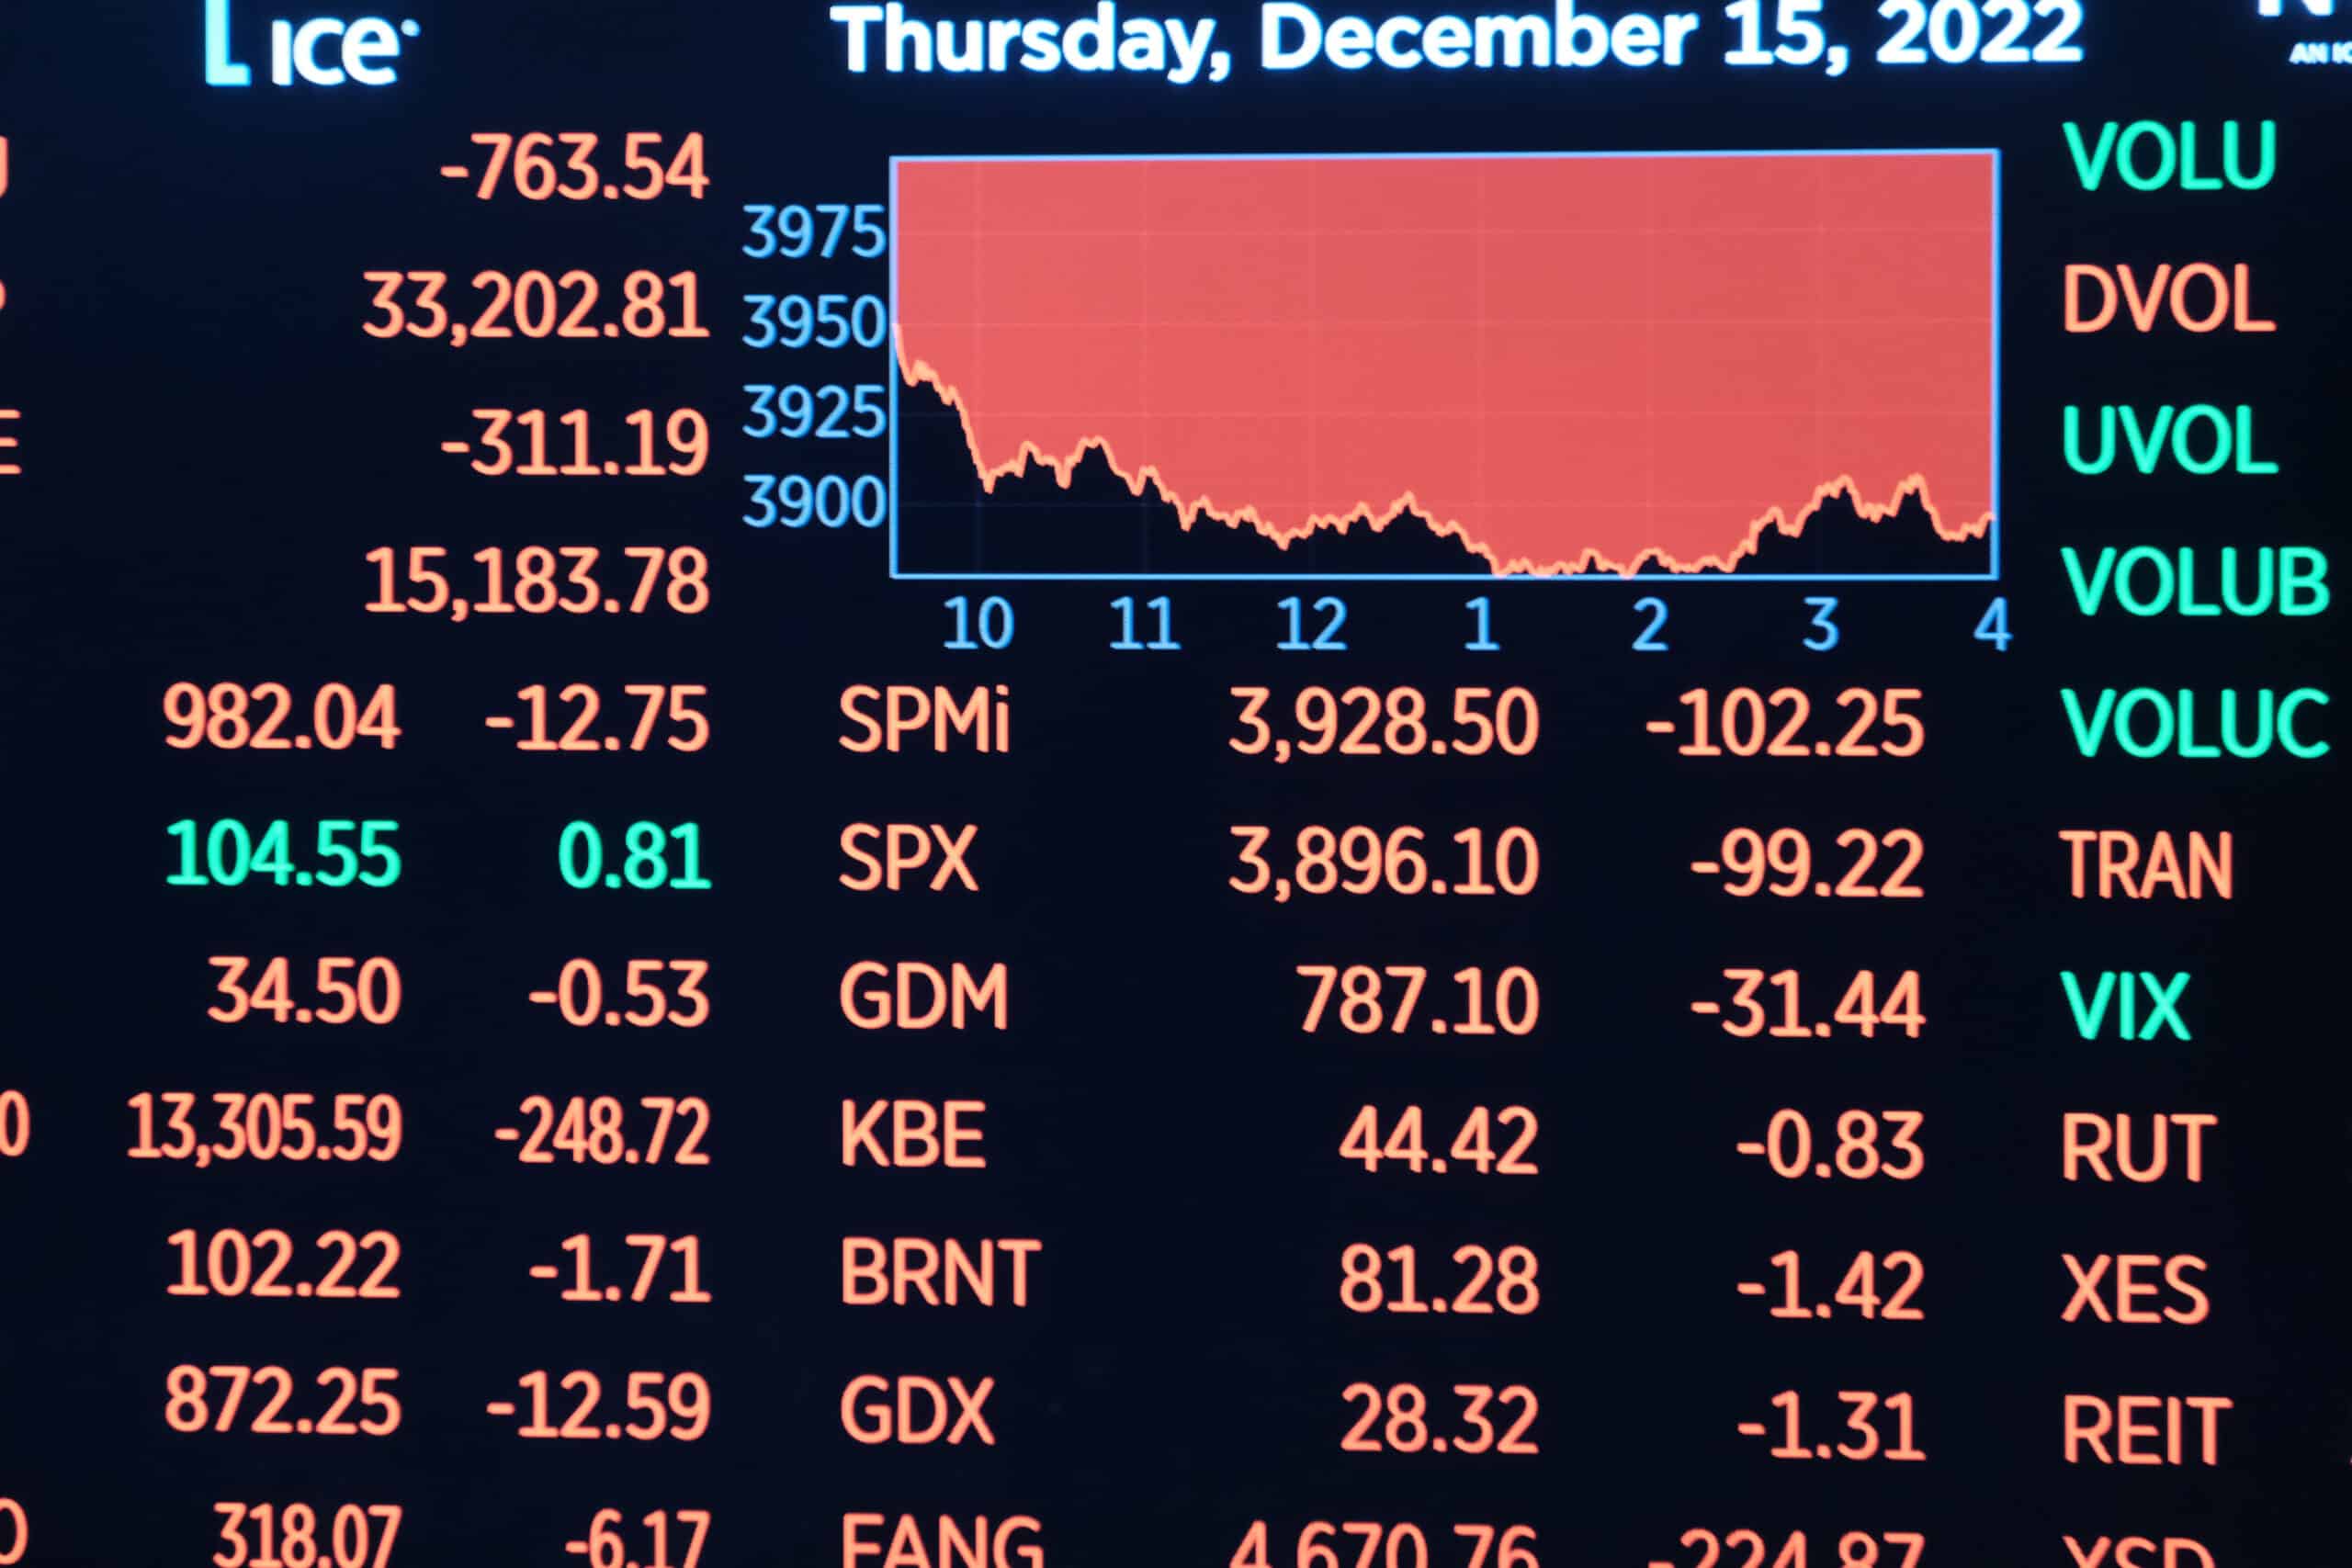
The 10-year Treasury yield tells a more complicated story. After hitting a 12-month low of 3.97% in late February, yields have climbed back to 4.20% as of March 17. That rebound in long rates, even as the Fed has cut short-term rates, is part of what has pressured growth stocks this quarter. If the 10-year yield stabilizes or retreats from current levels, all three funds should benefit. If it pushes toward the 4.58% peak seen in May 2025, expect further pressure on multiples.
Track the 10-year Treasury yield weekly through FRED. The Fed’s next policy signal at an upcoming FOMC meeting will be the clearest indicator of where rates go from here.
How FELG Differs Structurally From Its Passive Peers
FELG is not a passive index fund. It uses a quantitative process designed to favor companies with improving fundamentals and reasonable valuations relative to the Russell 1000 Growth benchmark. That distinction matters right now because passive funds like VUG and ONEQ have no mechanism to reduce exposure to overvalued names during a correction. FELG does.
FELG’s top holdings lean heavily into the same mega-cap tech names driving the broader selloff. But unlike VUG, FELG also carries a meaningful position in Eli Lilly, adding healthcare exposure that gives the fund a different recovery profile if tech continues to lag.
At a 0.18% expense ratio and $4.7 billion in assets, FELG’s cost structure is in line with other quantitative strategies in the large-cap growth space.
The micro factor to watch is whether FELG’s quantitative model continues to shift weight toward fundamentally improving companies as the growth selloff matures. Because the model targets improving fundamentals rather than market-cap weighting alone, its holdings composition differs from passive peers, which may result in a different recovery trajectory. Fidelity publishes monthly holdings updates at the fund’s fact sheet for those researching how the quantitative process is allocating across sectors.
The Setup Heading Into the Rest of 2026
The VIX peaked at 29.49 on March 6 and has since pulled back to 22.37, suggesting fear is fading but not gone. Volatility compression after a spike has preceded recoveries in growth-oriented funds in prior cycles.
If the 10-year Treasury yield retreats from its current level and the Fed signals additional cuts, FELG’s quantitative model is designed to rotate toward fundamentally improving names — a structural characteristic that differs from passive peers like VUG and ONEQ. Fidelity’s monthly holdings updates at the fund’s fact sheet provide the clearest view of how that rotation is progressing.