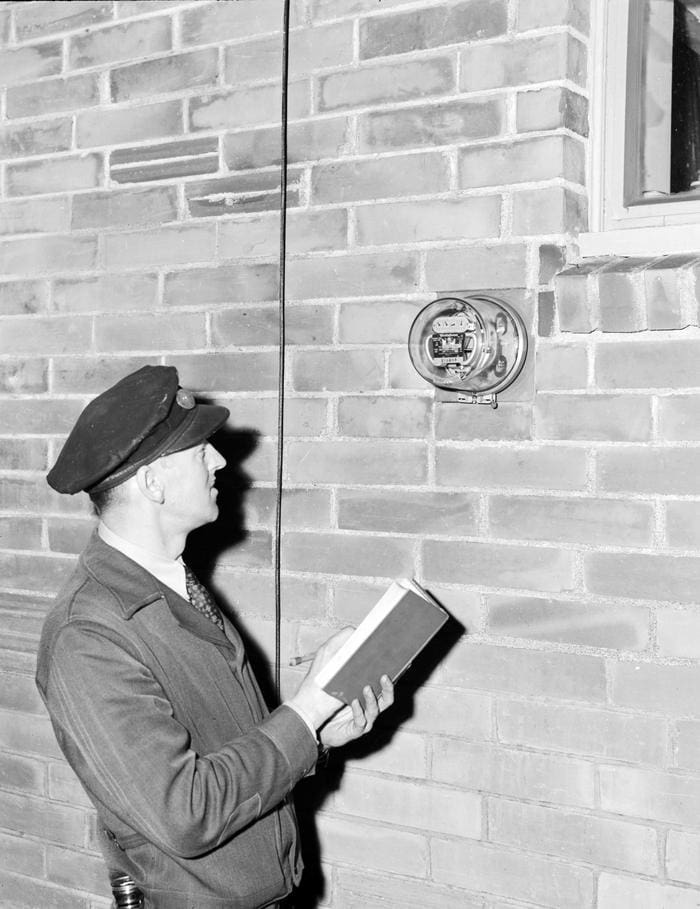
Are we all going to be replaced by machines? No doubt, more and more of our jobs are being performed by machines as artificial intelligence and automation are taking up increasing shares of certain industries — but not all.
To determine the jobs going away due to automation, 24/7 Wall St. reviewed data on projected employment change from the Bureau of Labor Statistics Employment Projections program. Detailed occupations whose factors affecting occupational utilization include automation were ranked based on projected percentage change in U.S. employment from 2022 to 2032. Data on the percentage of workers 25 and over with at least a bachelor’s degree in each occupation are also from the BLS EP and are for 2021. Supplemental data on average annual salary and total employment are from the BLS Occupational Employment and Wage Statistics program and are for May 2023.
The BLS projects that total employment is going to grow by nearly 3% from 2022 to 2023, with some industries projected to grow by double digits. Employment in the 40 jobs on the list, however, is projected to decline by anywhere from 3.2% to 38.6%.
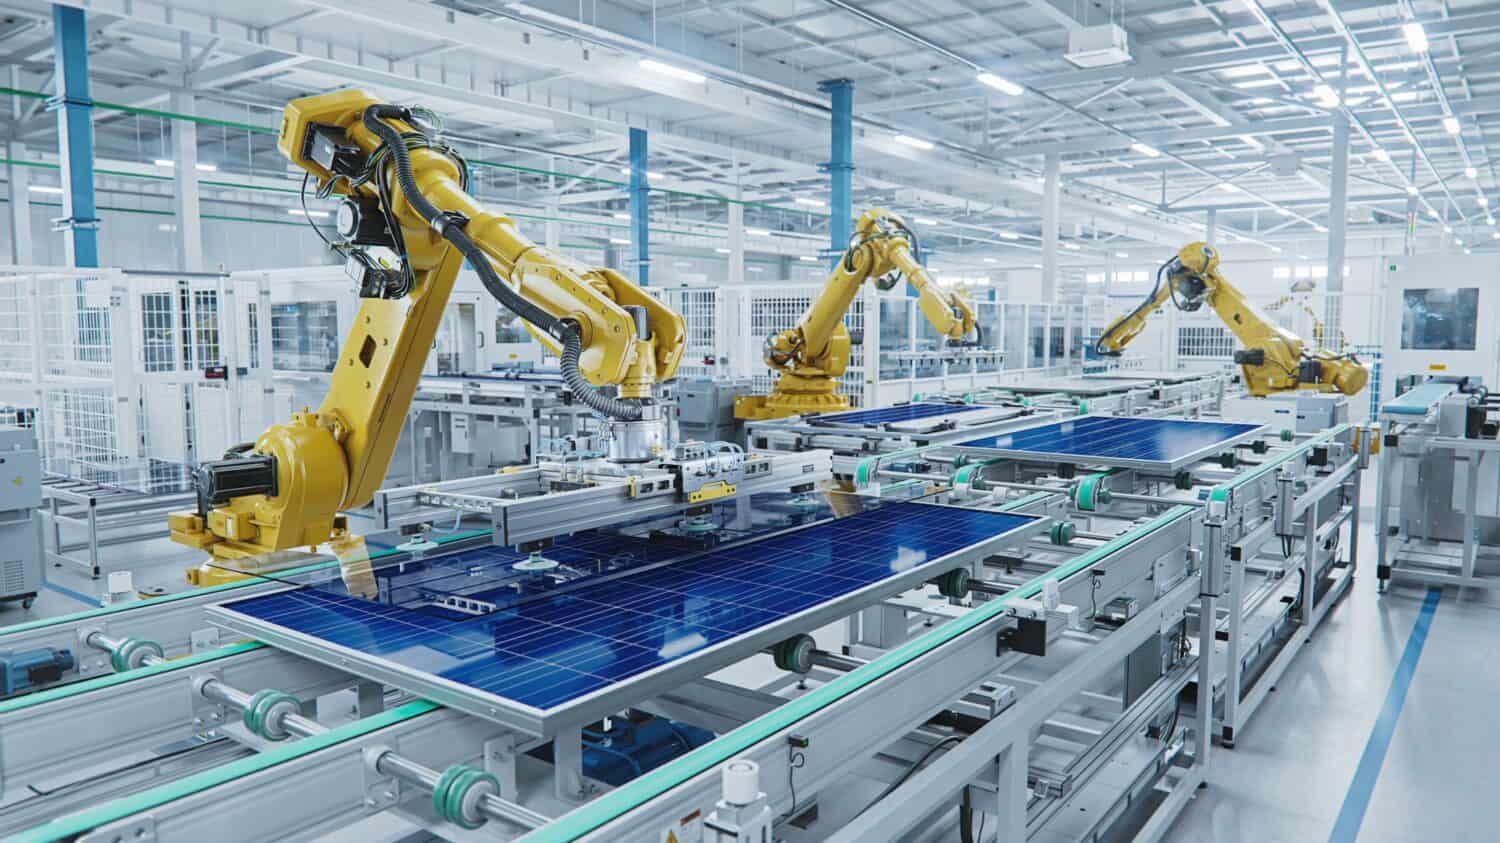
While more than half of the jobs on the list indeed are manufacturing occupations, quite a few are also office based. In all, there are 18 different machine operators, setters, or tenders and 12 different clerks and other clerical jobs. While automation may play more of a part with lower demand for manufacturing jobs, artificial intelligence might be more detrimental to those who work in offices. (Also see: Cities With the Most Physically Demanding Jobs.)
Only four of the jobs on the list have a higher mean wage than the national mean of $65,470. The highest-paying job that is projected to have less demand in the future is computer programmers. Programmers increasingly use AI in their jobs, which could indeed mean fewer are needed for the same work.
Why This Matters
40. Insurance claims and policy processing clerks

- Projected employment change, 2022 to 2032: -3.2%
- Workers with a bachelor’s degree: 27.2%
- Average annual salary: $49,530
- Total employment: 241,650
39. Survey researchers

- Projected employment change, 2022 to 2032: -3.8%
- Workers with a bachelor’s degree: 91.2%
- Average annual salary: $66,670
- Total employment: 8,190
38. Cutting and slicing machine setters, operators, and tenders
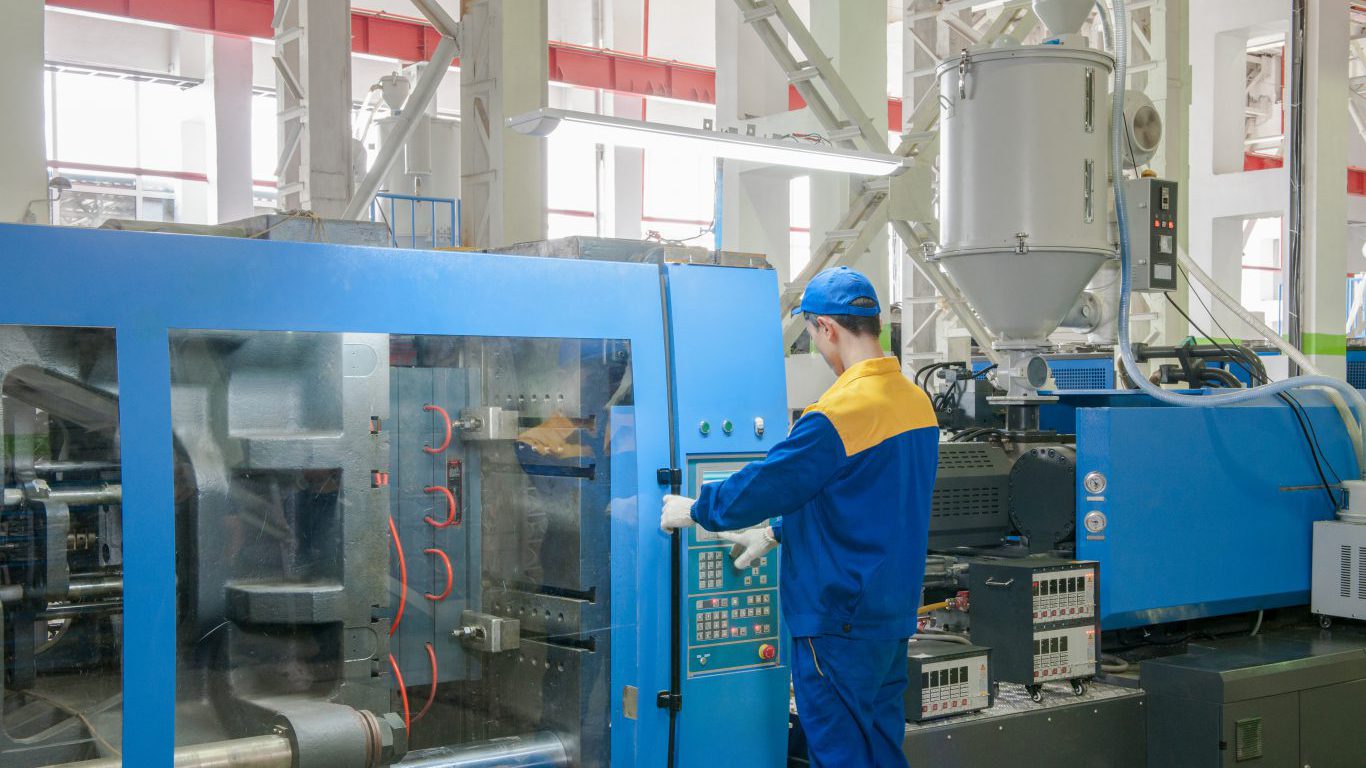
- Projected employment change, 2022 to 2032: -4.1%
- Workers with a bachelor’s degree: 5.8%
- Average annual salary: $44,700
- Total employment: 52,720
37. Graders and sorters, agricultural products
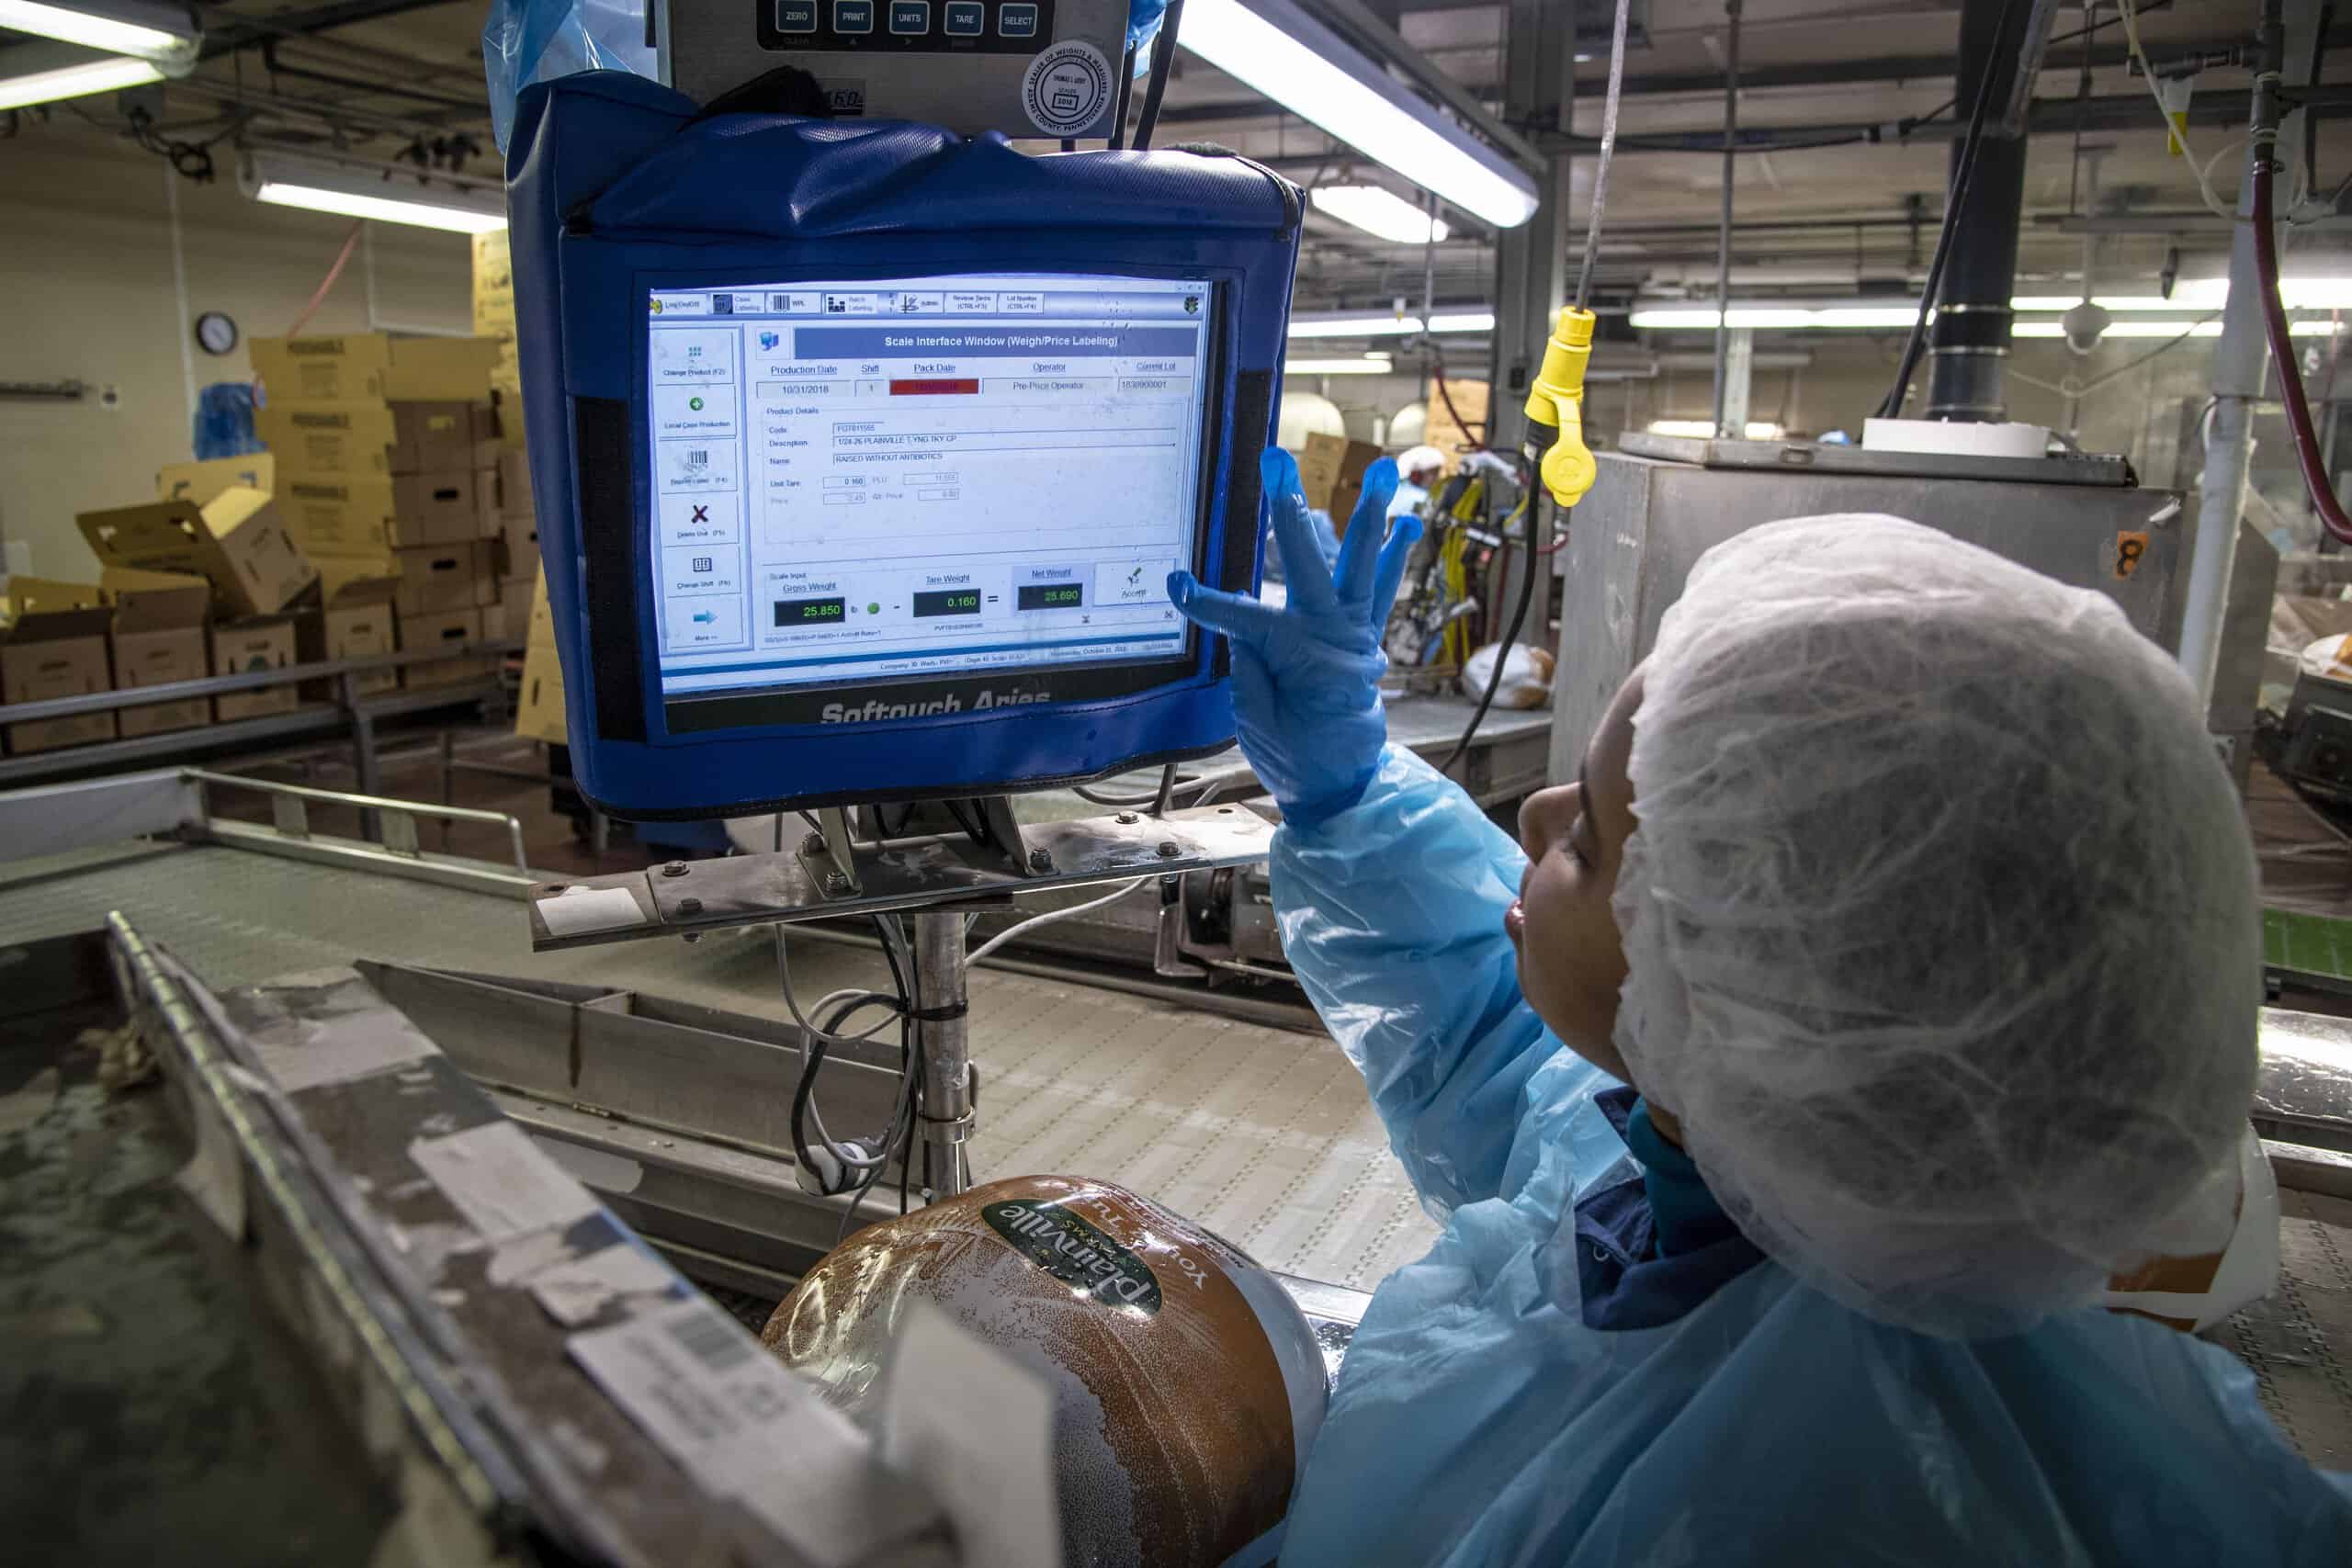
- Projected employment change, 2022 to 2032: -5.1%
- Workers with a bachelor’s degree: 7.4%
- Average annual salary: $34,880
- Total employment: 23,430
36. Chemical equipment operators and tenders

- Projected employment change, 2022 to 2032: -5.5%
- Workers with a bachelor’s degree: 27.5%
- Average annual salary: $57,350
- Total employment: 120,260
35. Correspondence clerks

- Projected employment change, 2022 to 2032: -5.9%
- Workers with a bachelor’s degree: 23.3%
- Average annual salary: $46,940
- Total employment: 4,650
34. Bookkeeping, accounting, and auditing clerks

- Projected employment change, 2022 to 2032: -6.2%
- Workers with a bachelor’s degree: 20.9%
- Average annual salary: $49,580
- Total employment: 1,501,910
33. Procurement clerks

- Projected employment change, 2022 to 2032: -7.6%
- Workers with a bachelor’s degree: 40.2%
- Average annual salary: $47,940
- Total employment: 61,580
32. Metal-refining furnace operators and tenders
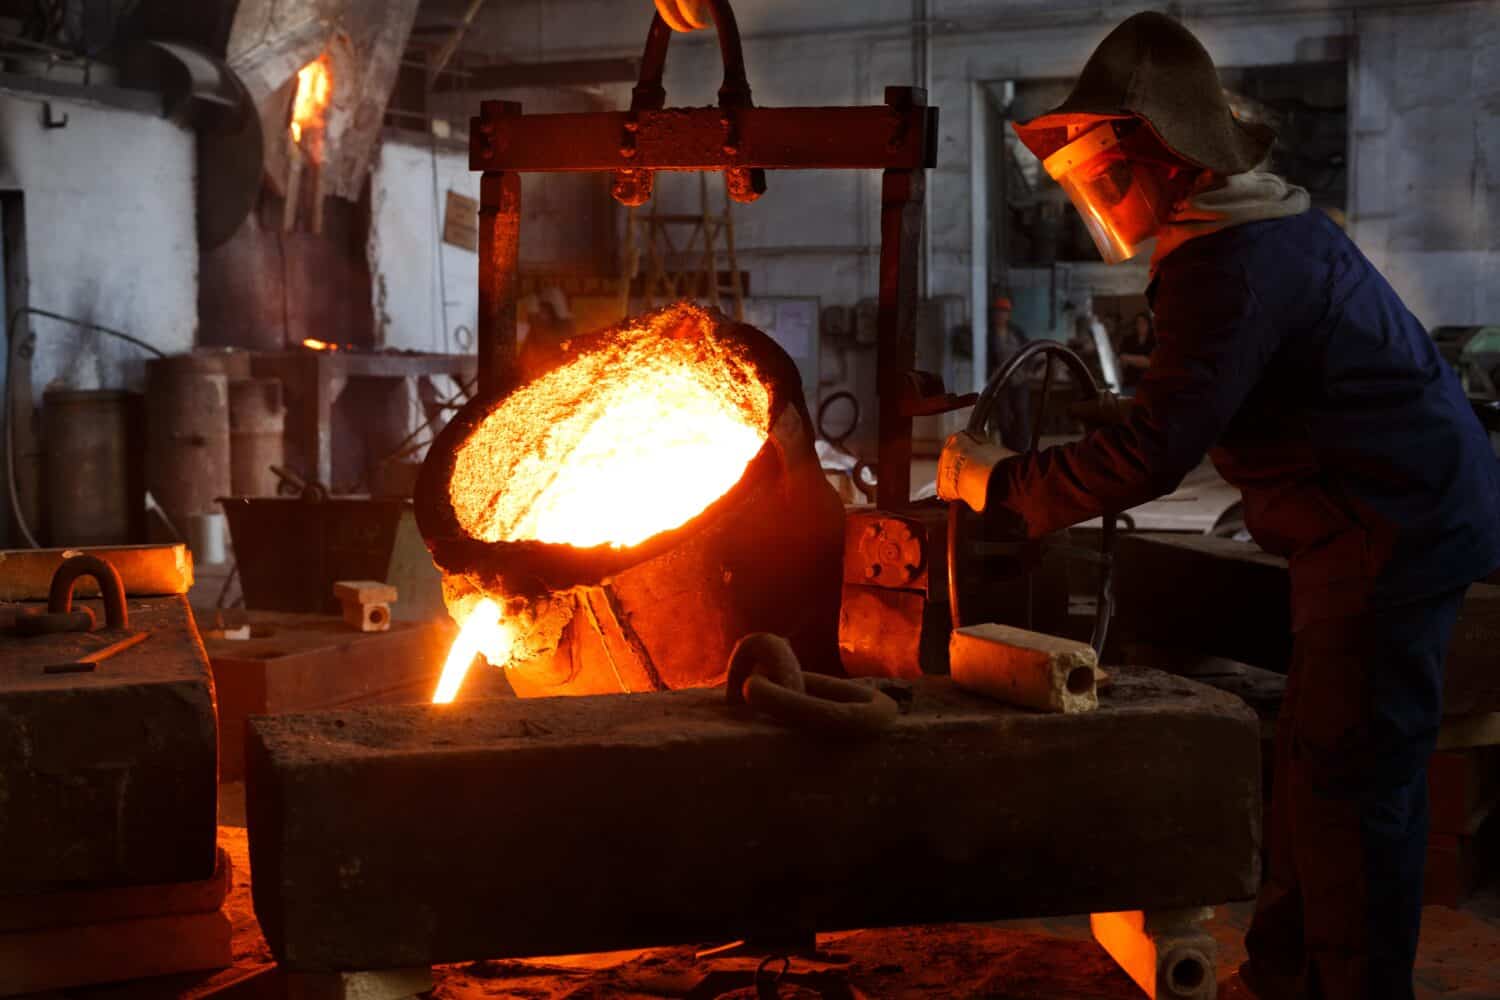
- Projected employment change, 2022 to 2032: -8.2%
- Workers with a bachelor’s degree: 8.0%
- Average annual salary: $54,340
- Total employment: 20,870
31. Shipping, receiving, and inventory clerks

- Projected employment change, 2022 to 2032: -8.4%
- Workers with a bachelor’s degree: 11.2%
- Average annual salary: $42,730
- Total employment: 844,120
30. Forest and conservation workers
- Projected employment change, 2022 to 2032: -8.7%
- Workers with a bachelor’s degree: 21.8%
- Average annual salary: $36,860
- Total employment: 5,750
29. Brokerage clerks

- Projected employment change, 2022 to 2032: -8.9%
- Workers with a bachelor’s degree: 36.6%
- Average annual salary: $63,130
- Total employment: 48,060
28. Heat treating equipment setters, operators, and tenders, metal and plastic
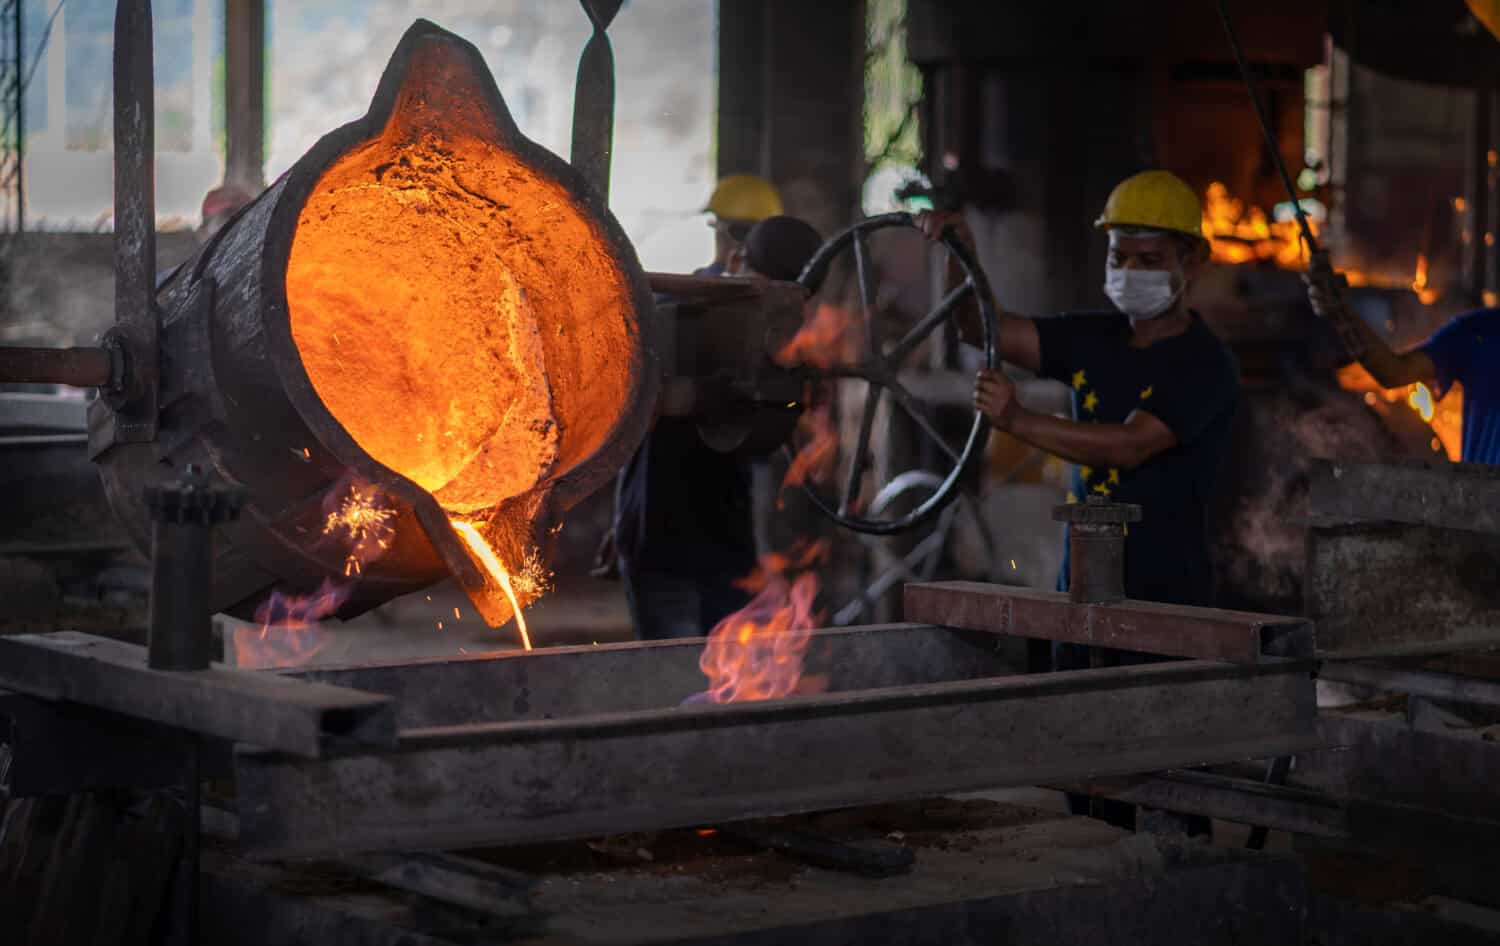
- Projected employment change, 2022 to 2032: -9.1%
- Workers with a bachelor’s degree: 6.0%
- Average annual salary: $46,540
- Total employment: 14,950
27. Production worker helpers
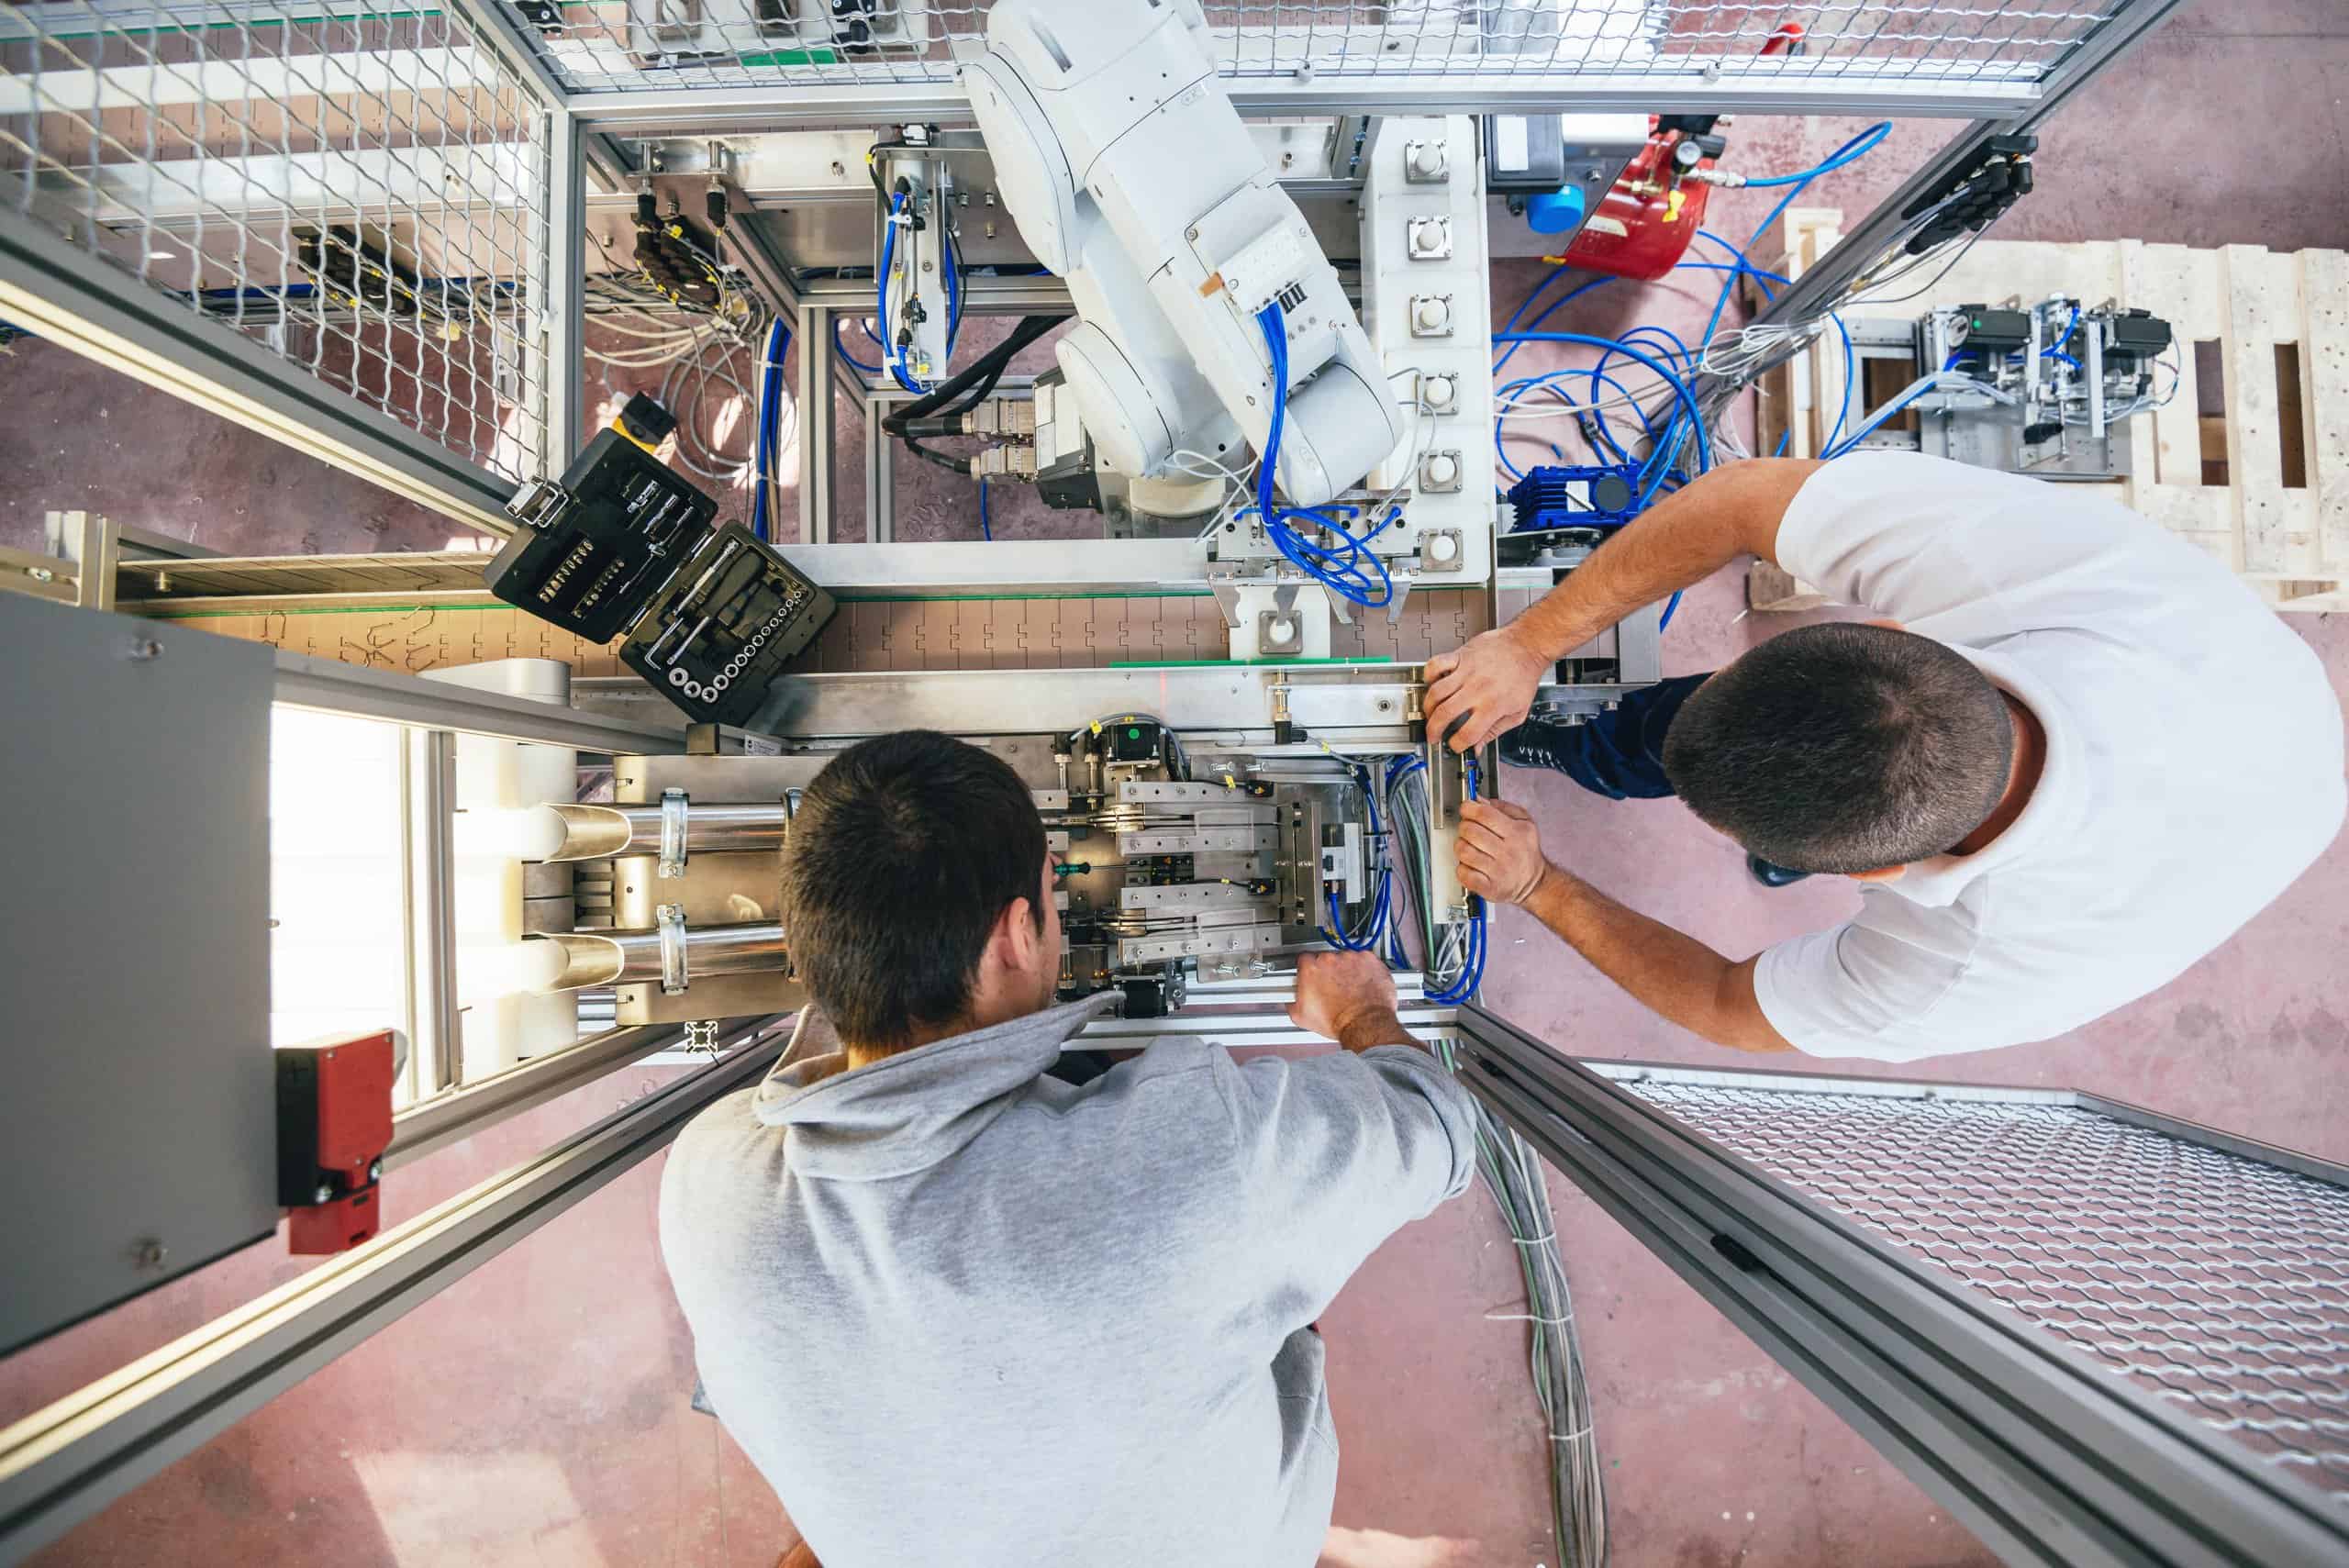
- Projected employment change, 2022 to 2032: -9.3%
- Workers with a bachelor’s degree: 9.8%
- Average annual salary: $38,160
- Total employment: 181,810
26. Lathe and turning machine tool setters, operators, and tenders, metal and plastic

- Projected employment change, 2022 to 2032: -9.4%
- Workers with a bachelor’s degree: 3.9%
- Average annual salary: $48,850
- Total employment: 19,560
25. Plating machine setters, operators, and tenders, metal and plastic
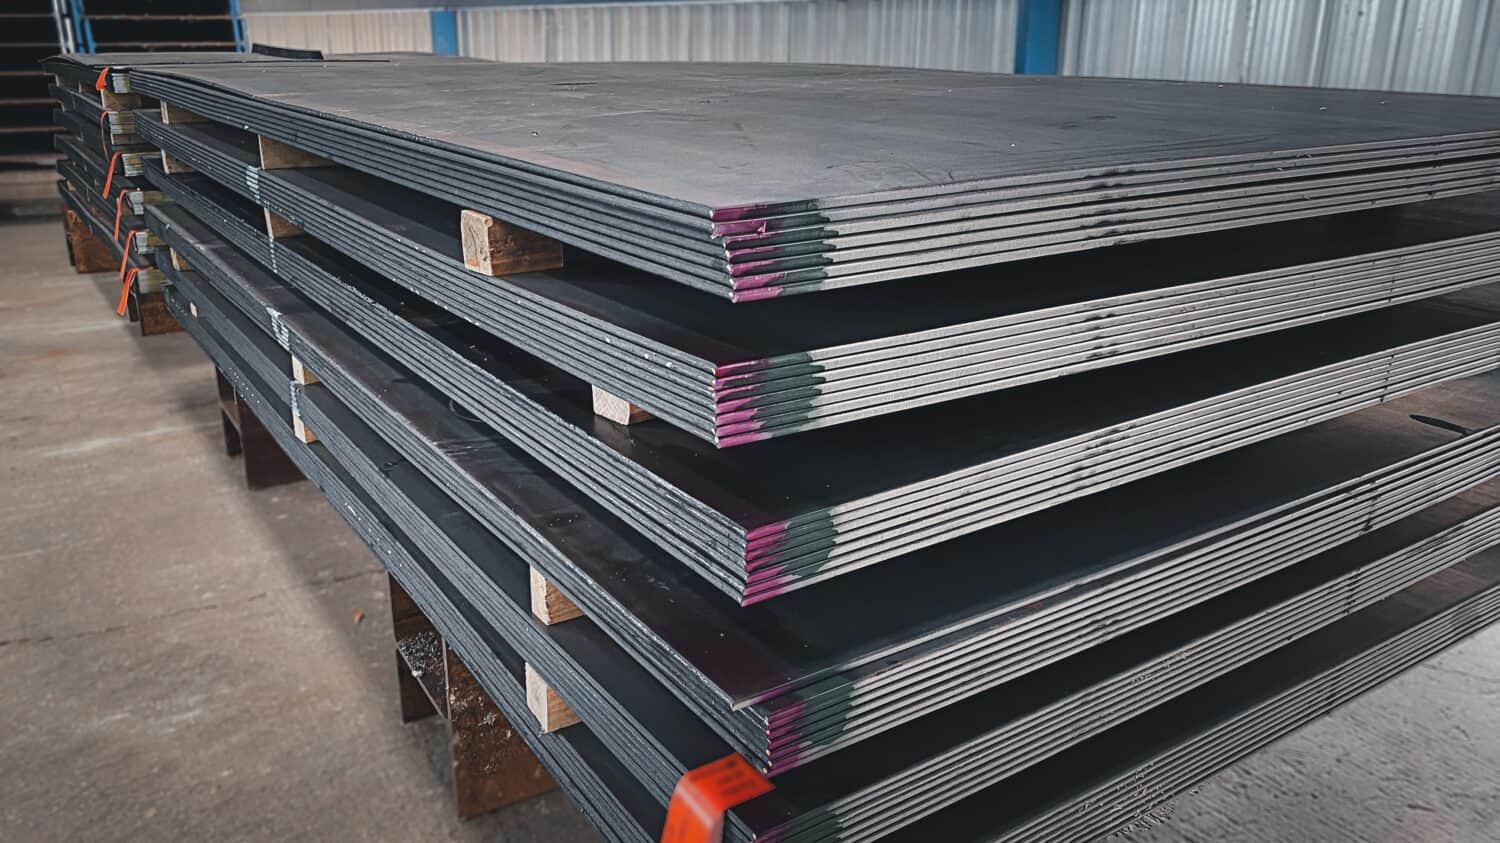
- Projected employment change, 2022 to 2032: -9.4%
- Workers with a bachelor’s degree: 6.0%
- Average annual salary: $42,550
- Total employment: 31,970
24. Metal and plastic grinding, lapping, polishing, and buffing machine tool setters, operators, and tenders

- Projected employment change, 2022 to 2032: -9.5%
- Workers with a bachelor’s degree: 4.3%
- Average annual salary: $44,450
- Total employment: 75,260
23. Bill and account collectors

- Projected employment change, 2022 to 2032: -9.6%
- Workers with a bachelor’s degree: 18.1%
- Average annual salary: $46,020
- Total employment: 190,910
22. Textile knitting and weaving machine setters, operators, and tenders

- Projected employment change, 2022 to 2032: -10.5%
- Workers with a bachelor’s degree: 8.6%
- Average annual salary: $37,880
- Total employment: 15,980
21. Textile cutting machine setters, operators, and tenders

- Projected employment change, 2022 to 2032: -10.8%
- Workers with a bachelor’s degree: 8.6%
- Average annual salary: $37,040
- Total employment: 9,760
20. Metal and plastic cutting, punching, and press machine setters, operators, and tenders
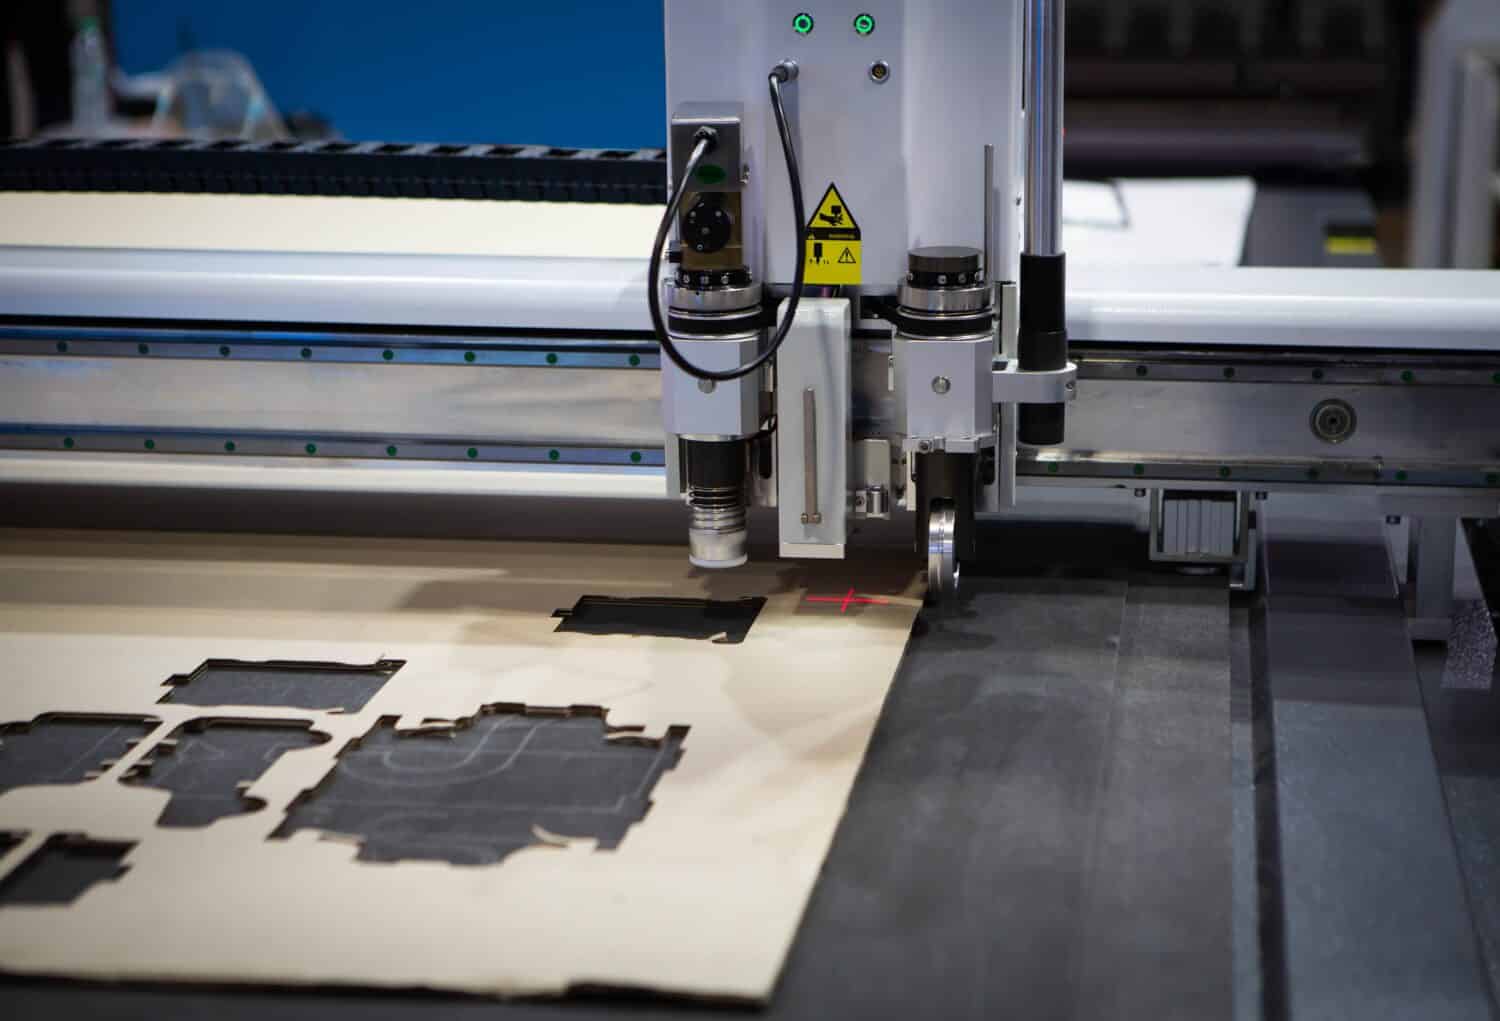
- Projected employment change, 2022 to 2032: -10.9%
- Workers with a bachelor’s degree: 3.7%
- Average annual salary: $44,260
- Total employment: 179,230
19. Rolling machine setters, operators, and tenders, metal and plastic

- Projected employment change, 2022 to 2032: -11.0%
- Workers with a bachelor’s degree: 4.4%
- Average annual salary: $49,290
- Total employment: 24,750
18. Computer programmers

- Projected employment change, 2022 to 2032: -11.2%
- Workers with a bachelor’s degree: 72.9%
- Average annual salary: $107,750
- Total employment: 120,370
17. Secretaries and administrative assistants, except legal, medical, and executive

- Projected employment change, 2022 to 2032: -11.6%
- Workers with a bachelor’s degree: 26.5%
- Average annual salary: $45,490
- Total employment: 1,785,430
16. Gas plant operators

- Projected employment change, 2022 to 2032: -11.7%
- Workers with a bachelor’s degree: 13.5%
- Average annual salary: $83,020
- Total employment: 15,930
15. Utilities meter readers
- Projected employment change, 2022 to 2032: -12.2%
- Workers with a bachelor’s degree: 5.2%
- Average annual salary: $53,610
- Total employment: 19,900
14. Metal and plastic milling and planing machine setters, operators, and tenders

- Projected employment change, 2022 to 2032: -13.9%
- Workers with a bachelor’s degree: 3.9%
- Average annual salary: $50,020
- Total employment: 13,990
13. Forging machine setters, operators, and tenders, metal and plastic

- Projected employment change, 2022 to 2032: -14.6%
- Workers with a bachelor’s degree: 4.4%
- Average annual salary: $47,350
- Total employment: 9,170
12. Sewing machine operators

- Projected employment change, 2022 to 2032: -15.2%
- Workers with a bachelor’s degree: 7.6%
- Average annual salary: $35,000
- Total employment: 116,130
11. Hand sewers

- Projected employment change, 2022 to 2032: -15.8%
- Workers with a bachelor’s degree: 19.7%
- Average annual salary: $33,860
- Total employment: 3,390
10. Print binding and finishing workers

- Projected employment change, 2022 to 2032: -16.4%
- Workers with a bachelor’s degree: 8.2%
- Average annual salary: $40,860
- Total employment: 38,880
9. Payroll and timekeeping clerks

- Projected employment change, 2022 to 2032: -16.4%
- Workers with a bachelor’s degree: 26.5%
- Average annual salary: $54,690
- Total employment: 157,230
8. Order clerks

- Projected employment change, 2022 to 2032: -18.2%
- Workers with a bachelor’s degree: 23.3%
- Average annual salary: $43,530
- Total employment: 91,830
7. Metal and plastic drilling and boring machine tool setters, operators, and tenders

- Projected employment change, 2022 to 2032: -18.3%
- Workers with a bachelor’s degree: 3.9%
- Average annual salary: $47,490
- Total employment: 5,740
6. Hand grinding and polishing workers

- Projected employment change, 2022 to 2032: -19.5%
- Workers with a bachelor’s degree: 5.4%
- Average annual salary: $41,490
- Total employment: 12,290
5. Executive secretaries and executive administrative assistants

- Projected employment change, 2022 to 2032: -21.1%
- Workers with a bachelor’s degree: 42.7%
- Average annual salary: $73,680
- Total employment: 483,570
4. Switchboard operators

- Projected employment change, 2022 to 2032: -25.1%
- Workers with a bachelor’s degree: 17.4%
- Average annual salary: $40,020
- Total employment: 43,830
3. Data entry keyers

- Projected employment change, 2022 to 2032: -26.0%
- Workers with a bachelor’s degree: 24.3%
- Average annual salary: $40,130
- Total employment: 154,230
2. Telephone operators

- Projected employment change, 2022 to 2032: -26.6%
- Workers with a bachelor’s degree: 18.7%
- Average annual salary: $42,100
- Total employment: 4,600
1. Word processors and typists

- Projected employment change, 2022 to 2032: -38.6%
- Workers with a bachelor’s degree: 22.3%
- Average annual salary: $47,170
- Total employment: 37,200
The #1 Thing to Do Before You Claim Social Security (Sponsor)
Choosing the right (or wrong) time to claim Social Security can dramatically change your retirement. So, before making one of the biggest decisions of your financial life, it’s a smart idea to get an extra set of eyes on your complete financial situation.
A financial advisor can help you decide the right Social Security option for you and your family. Finding a qualified financial advisor doesn’t have to be hard. SmartAsset’s free tool matches you with up to three financial advisors who serve your area, and you can interview your advisor matches at no cost to decide which one is right for you.
Click here to match with up to 3 financial pros who would be excited to help you optimize your Social Security outcomes.
Have questions about retirement or personal finance? Email us at [email protected]!
By emailing your questions to 24/7 Wall St., you agree to have them published anonymously on a673b.bigscoots-temp.com.
By submitting your story, you understand and agree that we may use your story, or versions of it, in all media and platforms, including via third parties.
Thank you for reading! Have some feedback for us?
Contact the 24/7 Wall St. editorial team.

