The Nielsen Company has released latest Cross-Platform Report, and no one will be surprised to learn that TV still gets the lion’s share of Americans’ media time, about 155.5 hours a month in the fourth quarter of 2013. A lot, yes, but slightly more than a full hour less than in the fourth quarter of 2012.
But that is not as big as the decline in using the Internet on a computer, which dropped from about 29.5 hours in the last quarter of 2012 to about 27.75 hours in the same period last year.
If you guessed that TV and computer time is being replaced by smartphone usage, you would be right on target. Using an app or the Web on a smartphone now gets just over 34 hours a month of Americans’ time, compared to about 27.5 hours in the last quarter of 2012.
Nielsen slices and dices the data among age groups, race and ethnicity, and other measures. Here are a few highlights:
- Among all Americans, adults 65 and older watch more than 225 hours of TV a month, a full 30 hours more than the 50 to 64 year-old group, more than double that of teens aged 12 to 17 and double the rate of young adults in the 18 to 24 age group.
- Gaming console usage is highest among 18 to 24 year olds, at 18.3 hours, and lowest among adults 65 and older at just 27 minutes.
- Women use their smartphones more than an hour and a half longer per month than men to consume media. Women also use tablet devices about five hours more per month than do men.
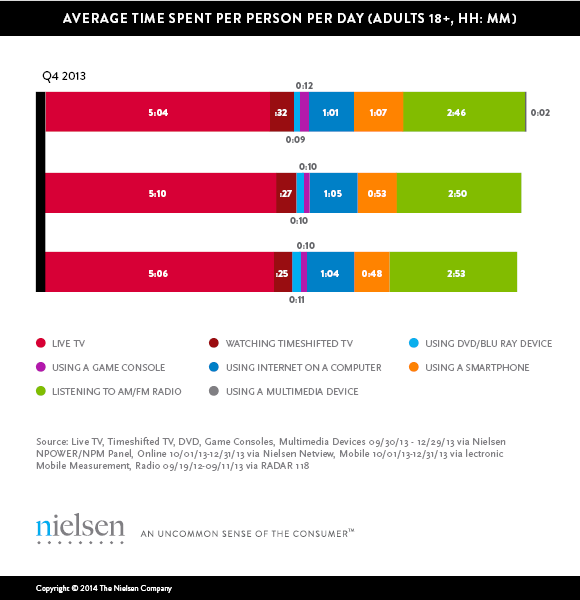
The following chart from Nielsen’s report illustrates how media consumption is changing among Americans 18 years of age and older. The changes are subtle, but significant, especially for advertisers and media programmers.