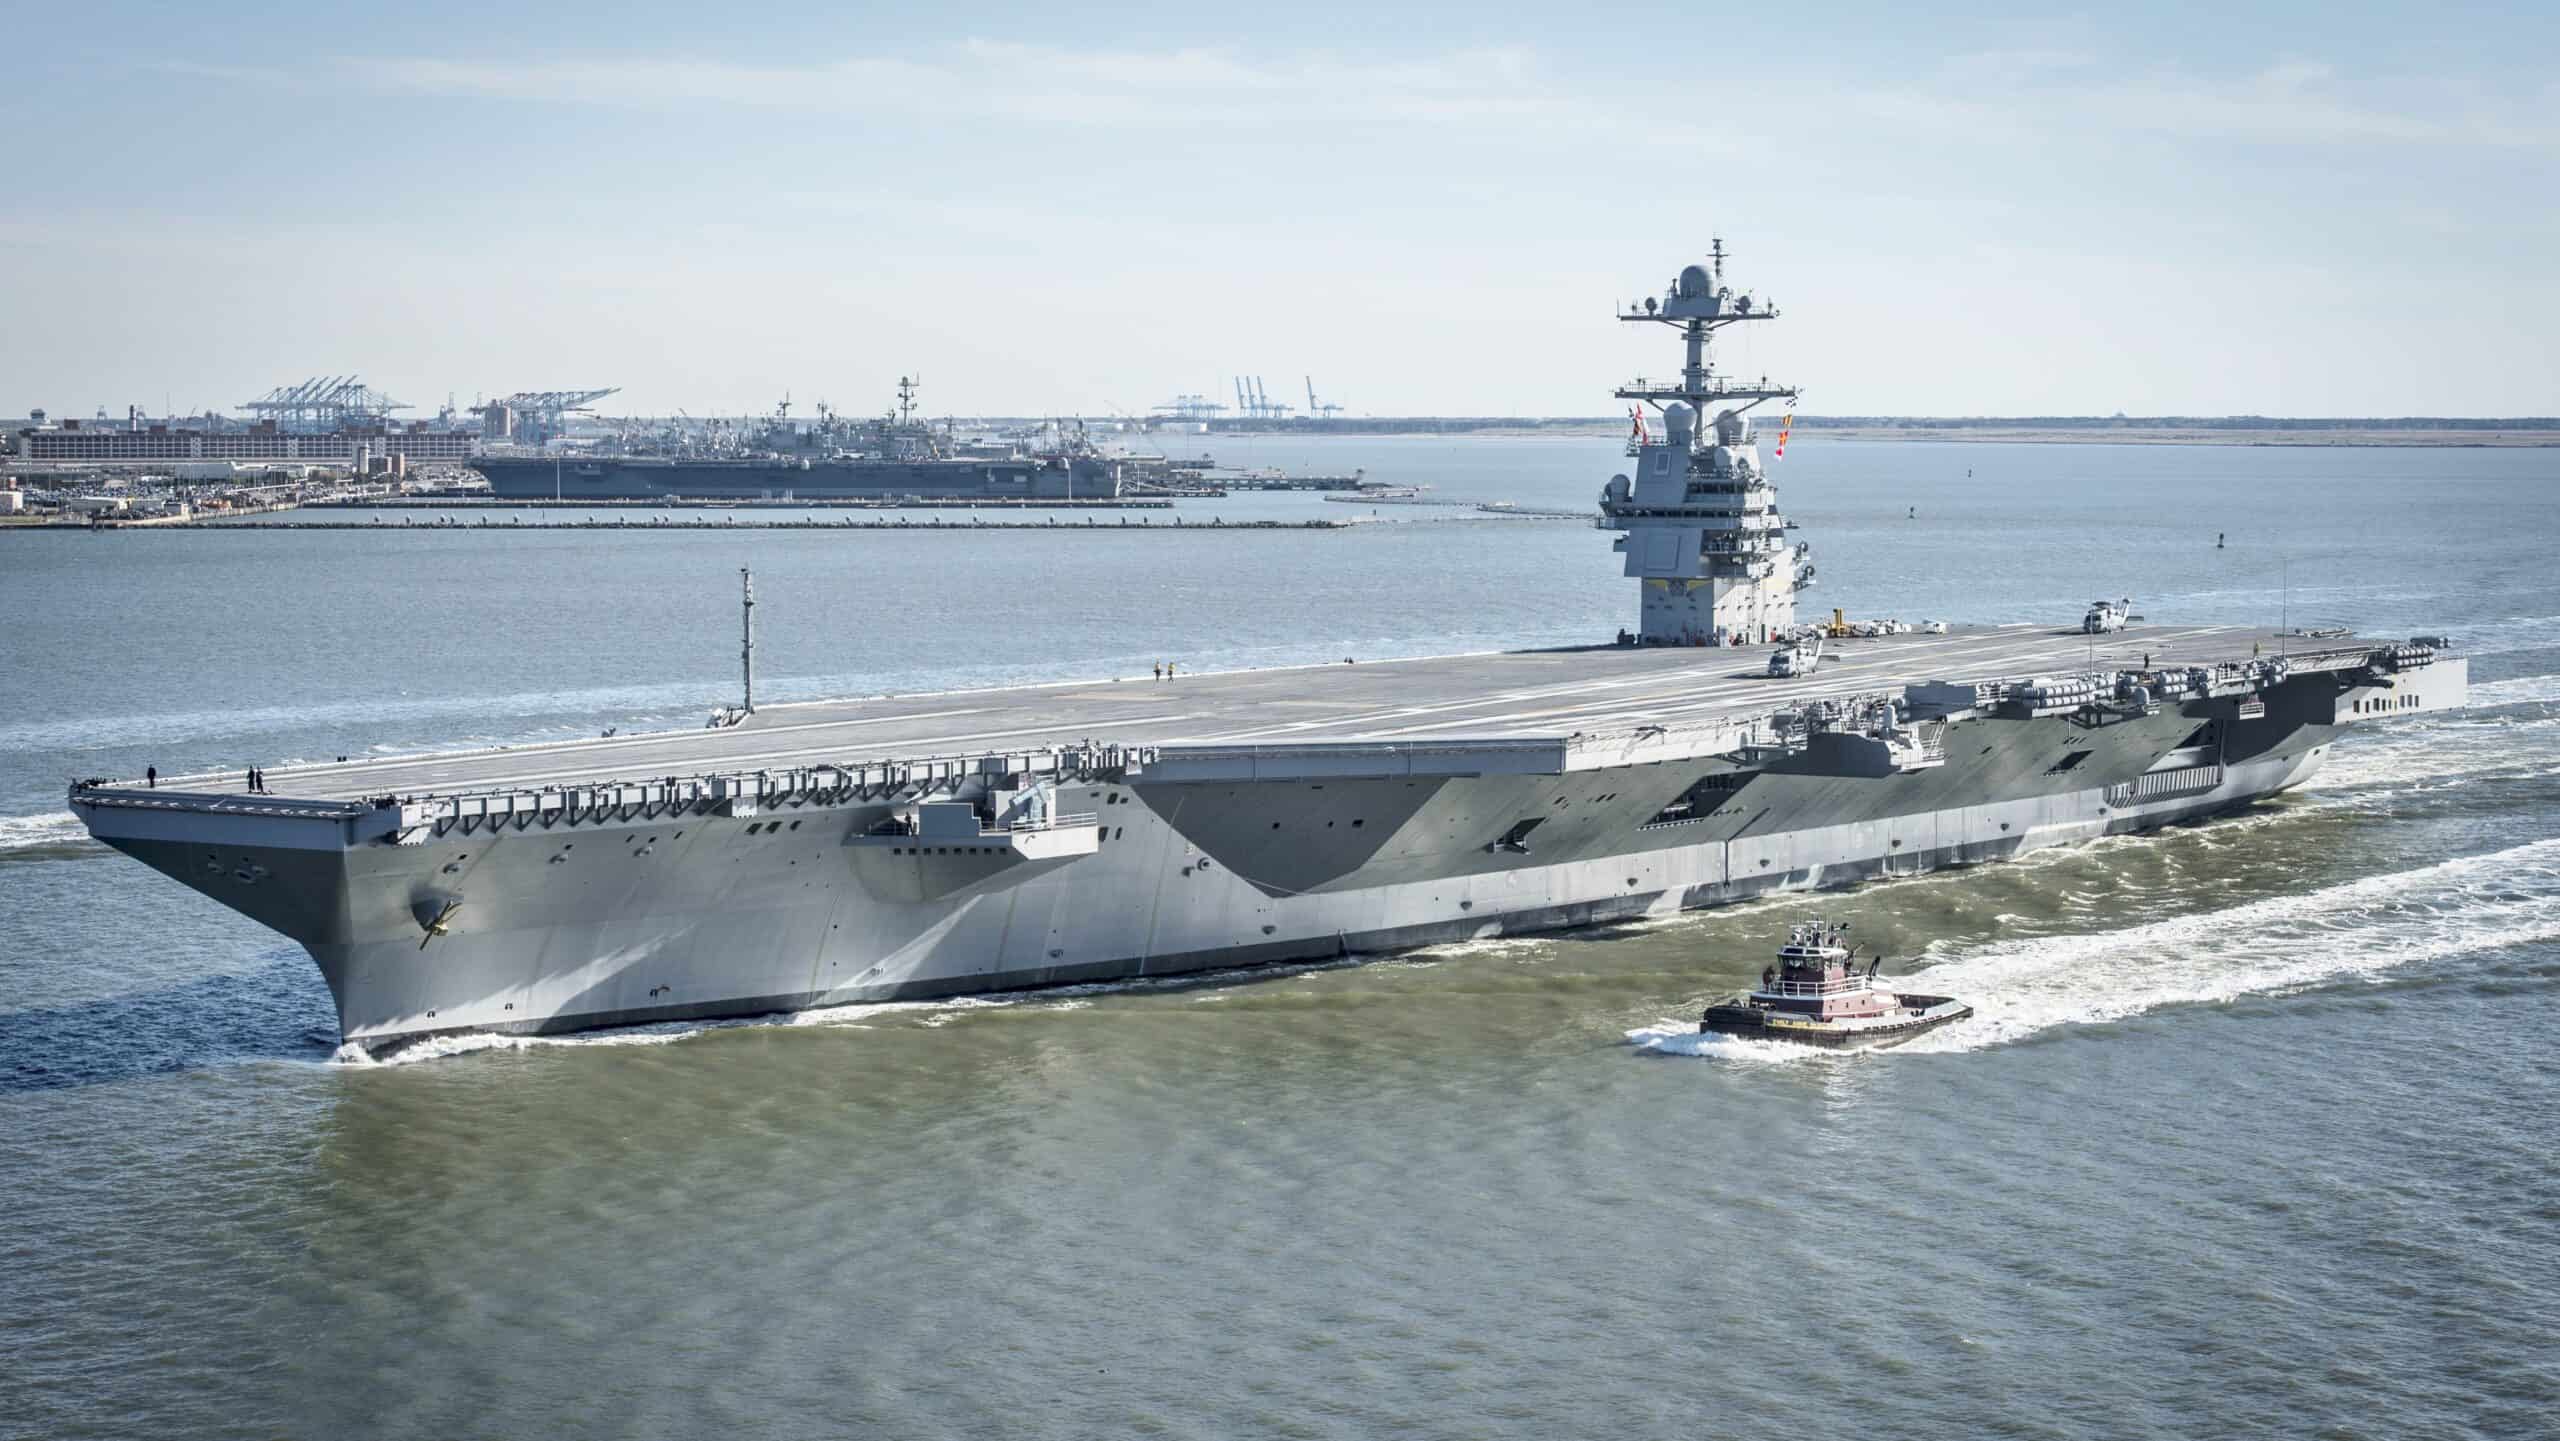
Military spending is paramount to power and success – why the U.S. military is considered one of the most powerful in the world. Compared to other nations, the spending that the United States does on behalf of its military completely dwarfs the competition. (These are the states where the U.S. military spends the most money.)
Here 24/7 Wall St. is taking a closer look at how much the United States has spent on its armed forces over the years. To identify what the U.S. spent on the military each year over the last 50 years, 24/7 Wall St. reviewed data on U.S. military spending from the Stockholm International Peace Research Institute Military Expenditure Database, listing the years 1973-2022. Figures are in current U.S. dollars. We also calculated the percentage change in military spending from the previous year and the spending as a percent of GDP.
In the early 1970s, during the height of the Vietnam War, the U.S. military budget had risen to roughly $80 billion, a more than 50% increase from 1965, when the U.S. first sent troops into Southeast Asia.
In the years following, expenditures continued to steadily rise, and by the early 1980s, military spending accelerated significantly. This surge came under President Ronald Reagan, practically tripling military expenditures of the Vietnam era.
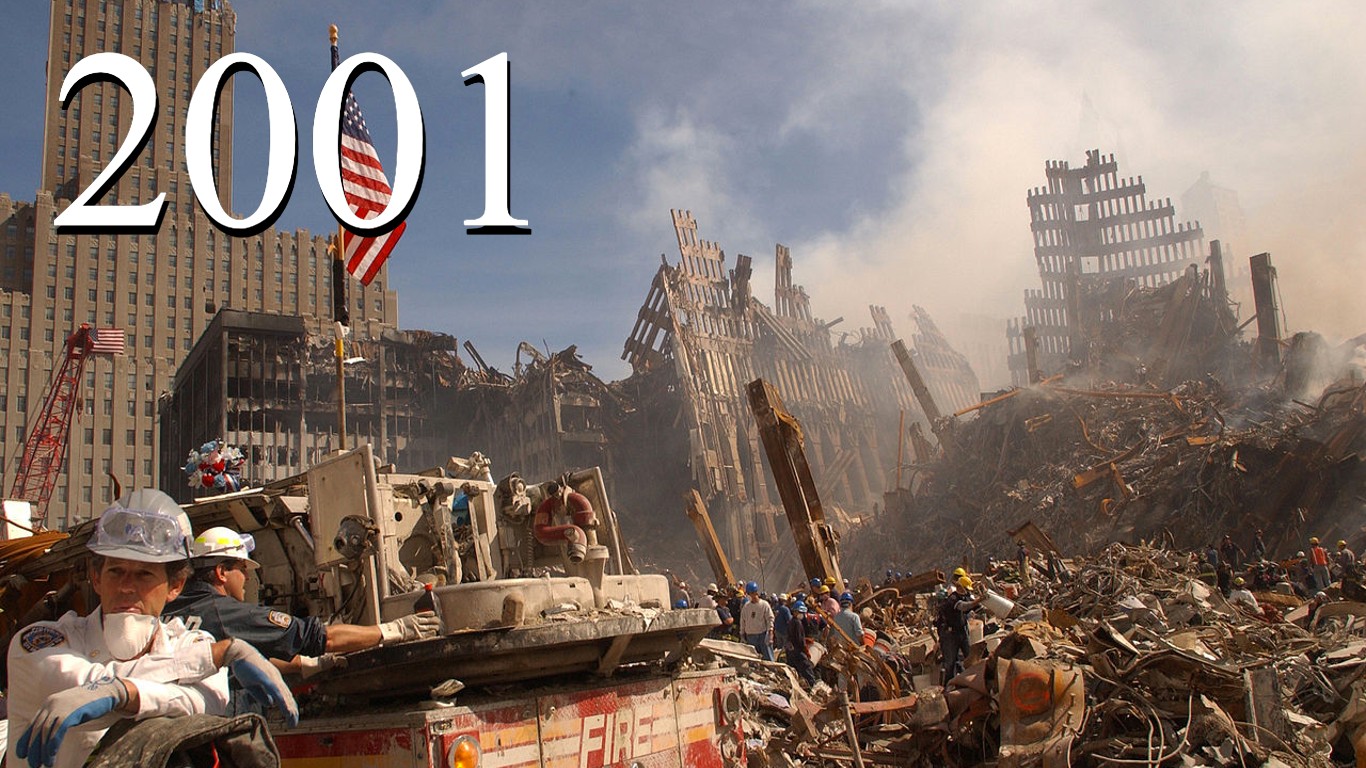
While the 1990s saw defense spending stabilize or even decline in some years, the terrorist attack of Sept. 11, 2001, changed everything. Spending ramped up from here as the U.S. embarked on the War on Terror, again increasing defense expenditures significantly for the following decades. (These are the U.S. military’s biggest weapons programs.)
Here is a look at U.S. military expenditures over the last 50 years:
Why Are We Covering This?

U.S. military expenditure is important for maintaining national security in what is an uncertain geopolitical landscape. It ensures the readiness and capability of armed forces to deter potential adversaries and respond effectively to threats.
1973: $ 81.47 billion
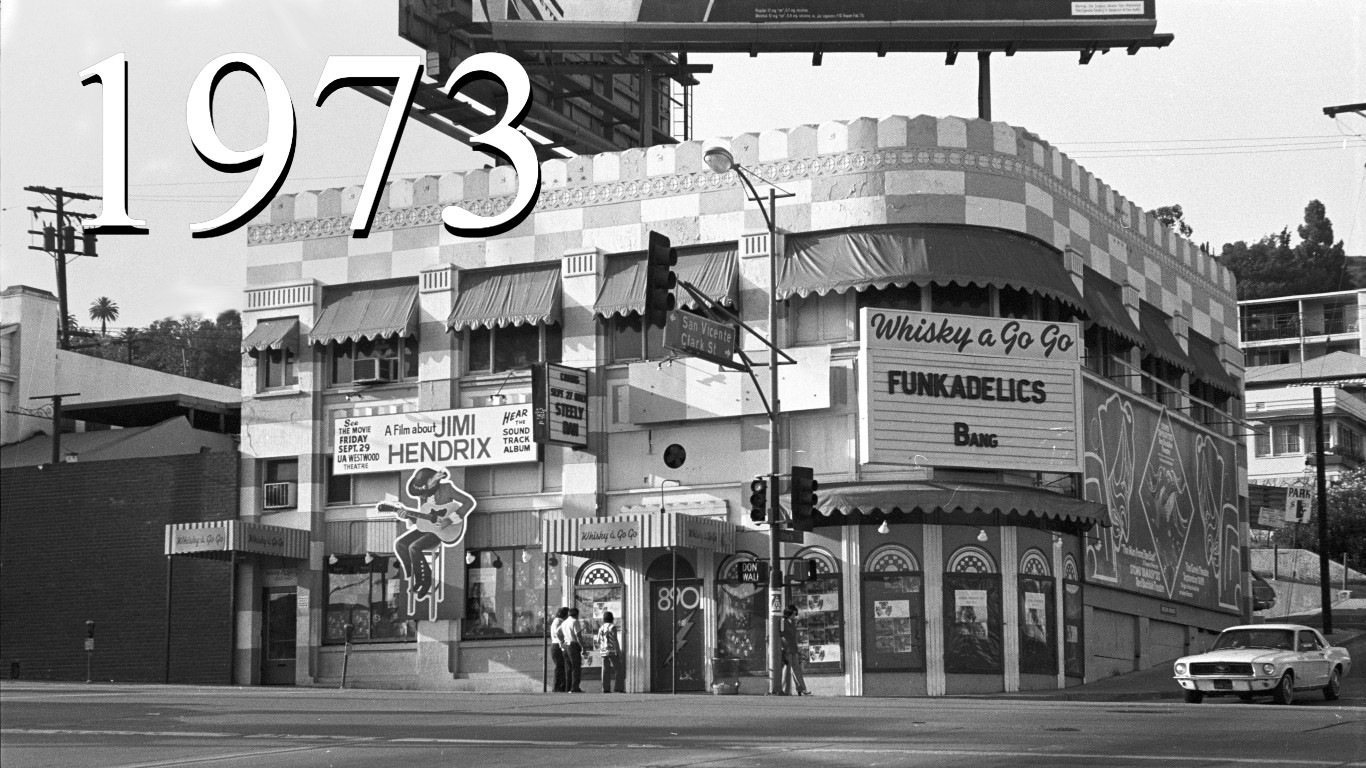
- Percent change in spending: 0.94% – #39 largest year over year increase
- Spending as a percent of GDP: 5.89%
1974: $ 89.28 billion
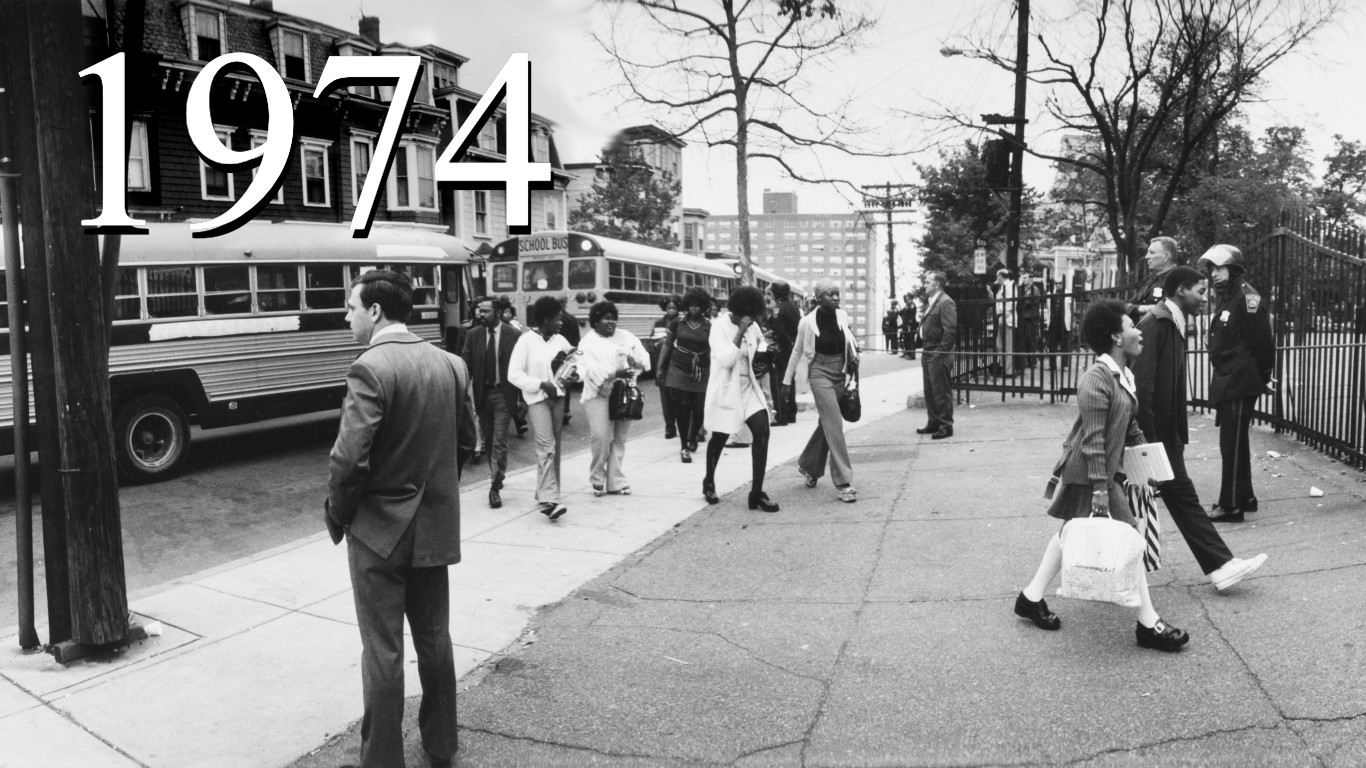
- Percent change in spending: 9.59% – #12 largest year over year increase
- Spending as a percent of GDP: 5.95%
1975: $ 92.08 billion
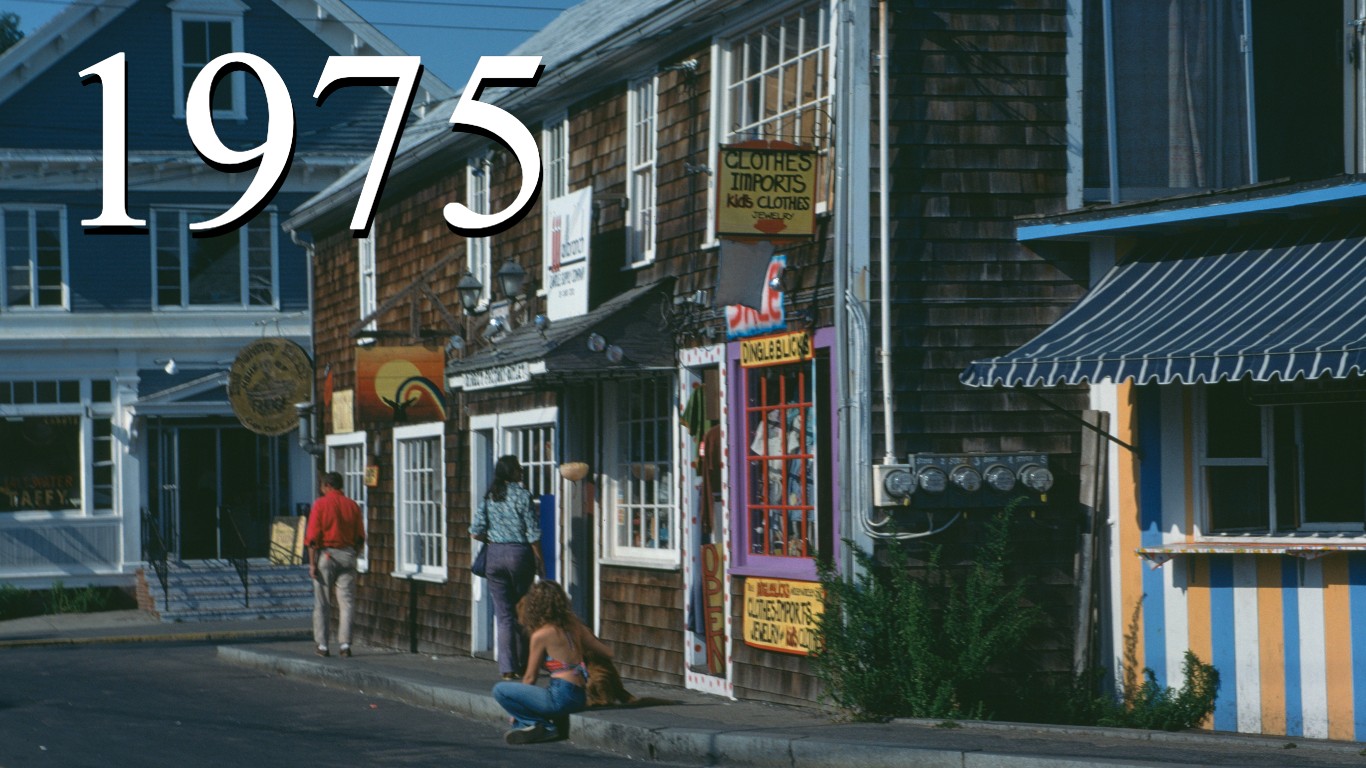
- Percent change in spending: 3.14% – #29 largest year over year increase
- Spending as a percent of GDP: 5.62%
1976: $ 94.72 billion
- Percent change in spending: 2.86% – #31 largest year over year increase
- Spending as a percent of GDP: 5.19%
1977: $ 104.67 billion
- Percent change in spending: 10.51% – #10 largest year over year increase
- Spending as a percent of GDP: 5.16%
1978: $ 113.38 billion
- Percent change in spending: 8.33% – #16 largest year over year increase
- Spending as a percent of GDP: 4.94%
1979: $ 126.88 billion
- Percent change in spending: 11.90% – #7 largest year over year increase
- Spending as a percent of GDP: 4.95%
1980: $ 143.69 billion
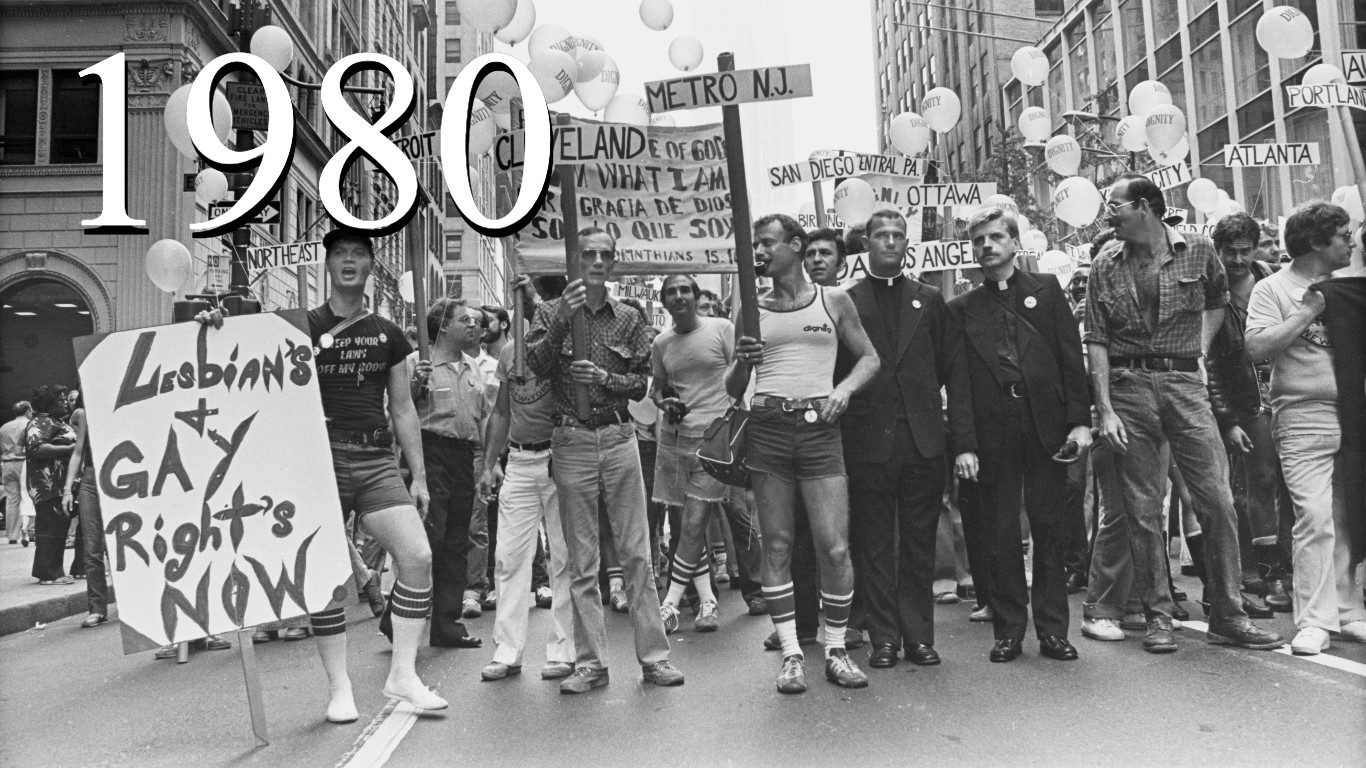
- Percent change in spending: 13.25% – #5 largest year over year increase
- Spending as a percent of GDP: 5.15%
1981: $ 176.56 billion
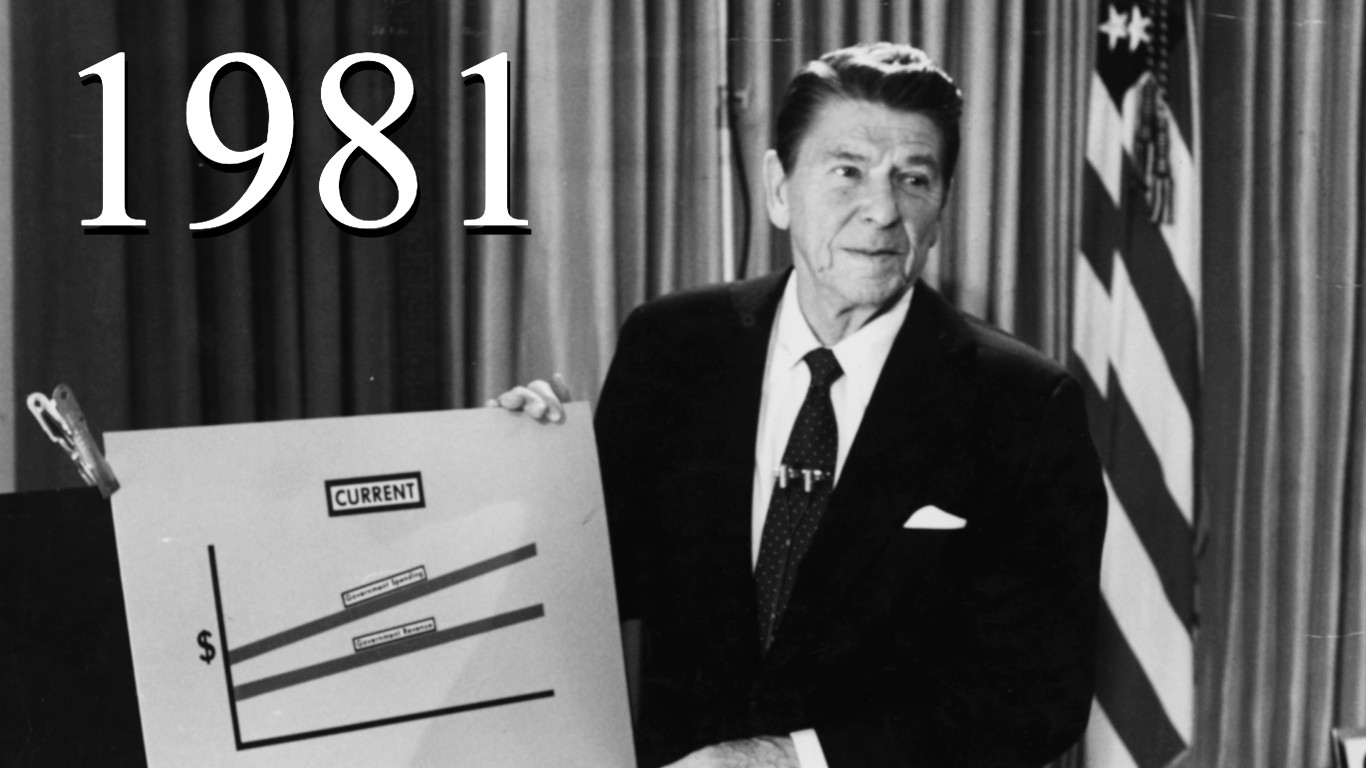
- Percent change in spending: 22.88% – #2 largest year over year increase
- Spending as a percent of GDP: 5.65%
1982: $ 221.67 billion
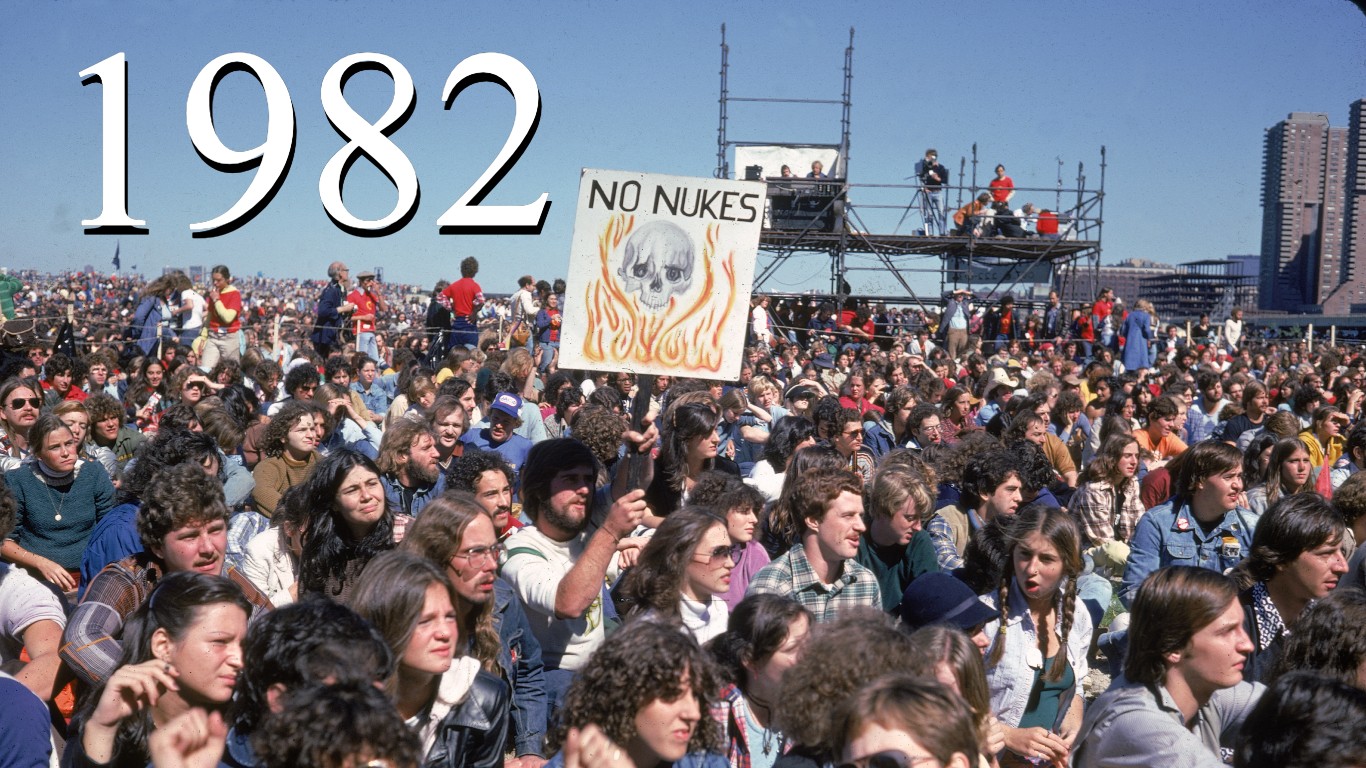
- Percent change in spending: 25.55% – #1 largest year over year increase
- Spending as a percent of GDP: 6.81%
1983: $ 223.43 billion
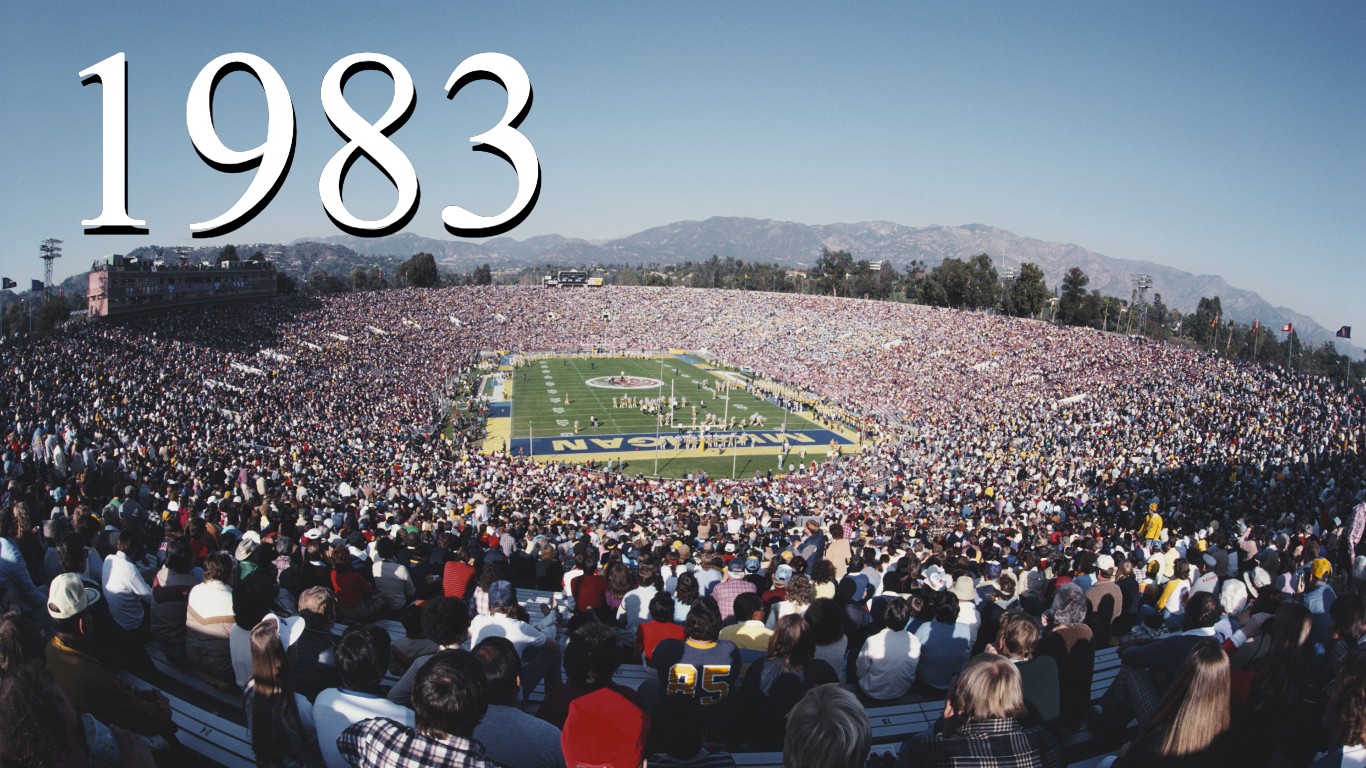
- Percent change in spending: 0.79% – #40 largest year over year increase
- Spending as a percent of GDP: 6.32%
1984: $ 245.15 billion
- Percent change in spending: 9.72% – #11 largest year over year increase
- Spending as a percent of GDP: 6.24%
1985: $ 272.16 billion
- Percent change in spending: 11.02% – #9 largest year over year increase
- Spending as a percent of GDP: 6.45%
1986: $ 295.55 billion
- Percent change in spending: 8.59% – #14 largest year over year increase
- Spending as a percent of GDP: 6.63%
1987: $ 304.09 billion
- Percent change in spending: 2.89% – #30 largest year over year increase
- Spending as a percent of GDP: 6.42%
1988: $ 309.66 billion
- Percent change in spending: 1.83% – #34 largest year over year increase
- Spending as a percent of GDP: 6.07%
1989: $ 321.87 billion
- Percent change in spending: 3.94% – #26 largest year over year increase
- Spending as a percent of GDP: 5.87%
1990: $ 325.13 billion
- Percent change in spending: 1.01% – #37 largest year over year increase
- Spending as a percent of GDP: 5.61%
1991: $ 299.37 billion
- Percent change in spending: -7.92% – #1 largest year over year decrease
- Spending as a percent of GDP: 4.88%
1992: $ 325.03 billion
- Percent change in spending: 8.57% – #15 largest year over year increase
- Spending as a percent of GDP: 4.97%
1993: $ 316.72 billion

- Percent change in spending: -2.56% – #8 largest year over year decrease
- Spending as a percent of GDP: 4.60%
1994: $ 308.08 billion
- Percent change in spending: -2.73% – #6 largest year over year decrease
- Spending as a percent of GDP: 4.22%
1995: $ 295.85 billion
- Percent change in spending: -3.97% – #4 largest year over year decrease
- Spending as a percent of GDP: 3.86%
1996: $ 287.96 billion
- Percent change in spending: -2.67% – #7 largest year over year decrease
- Spending as a percent of GDP: 3.55%
1997: $ 293.17 billion
- Percent change in spending: 1.81% – #35 largest year over year increase
- Spending as a percent of GDP: 3.41%
1998: $ 291.00 billion
- Percent change in spending: -0.74% – #10 largest year over year decrease
- Spending as a percent of GDP: 3.20%
1999: $ 298.09 billion
- Percent change in spending: 2.44% – #32 largest year over year increase
- Spending as a percent of GDP: 3.09%
2000: $ 320.09 billion
- Percent change in spending: 7.38% – #20 largest year over year increase
- Spending as a percent of GDP: 3.11%
2001: $ 331.81 billion
- Percent change in spending: 3.66% – #27 largest year over year increase
- Spending as a percent of GDP: 3.12%
2002: $ 378.46 billion
- Percent change in spending: 14.06% – #4 largest year over year increase
- Spending as a percent of GDP: 3.45%
2003: $ 440.53 billion
- Percent change in spending: 16.40% – #3 largest year over year increase
- Spending as a percent of GDP: 3.83%
2004: $ 493.00 billion
- Percent change in spending: 11.91% – #6 largest year over year increase
- Spending as a percent of GDP: 4.02%
2005: $ 533.20 billion
- Percent change in spending: 8.15% – #17 largest year over year increase
- Spending as a percent of GDP: 4.09%
2006: $ 558.34 billion
- Percent change in spending: 4.71% – #24 largest year over year increase
- Spending as a percent of GDP: 4.04%
2007: $ 589.59 billion
- Percent change in spending: 5.60% – #22 largest year over year increase
- Spending as a percent of GDP: 4.07%
2008: $ 656.76 billion
- Percent change in spending: 11.39% – #8 largest year over year increase
- Spending as a percent of GDP: 4.45%
2009: $ 705.92 billion
- Percent change in spending: 7.49% – #19 largest year over year increase
- Spending as a percent of GDP: 4.88%
2010: $ 738.01 billion
- Percent change in spending: 4.55% – #25 largest year over year increase
- Spending as a percent of GDP: 4.90%
2011: $ 752.29 billion

- Percent change in spending: 1.94% – #33 largest year over year increase
- Spending as a percent of GDP: 4.82%
2012: $ 725.21 billion
- Percent change in spending: -3.60% – #5 largest year over year decrease
- Spending as a percent of GDP: 4.46%
2013: $ 679.23 billion
- Percent change in spending: -6.34% – #2 largest year over year decrease
- Spending as a percent of GDP: 4.03%
2014: $ 647.79 billion
- Percent change in spending: -4.63% – #3 largest year over year decrease
- Spending as a percent of GDP: 3.69%
2015: $ 633.83 billion
- Percent change in spending: -2.15% – #9 largest year over year decrease
- Spending as a percent of GDP: 3.48%
2016: $ 639.86 billion
- Percent change in spending: 0.95% – #38 largest year over year increase
- Spending as a percent of GDP: 3.42%
2017: $ 646.75 billion
- Percent change in spending: 1.08% – #36 largest year over year increase
- Spending as a percent of GDP: 3.32%
2018: $ 682.49 billion

- Percent change in spending: 5.53% – #23 largest year over year increase
- Spending as a percent of GDP: 3.32%
2019: $ 734.34 billion
- Percent change in spending: 7.60% – #18 largest year over year increase
- Spending as a percent of GDP: 3.43%
2020: $ 778.40 billion
- Percent change in spending: 6.00% – #21 largest year over year increase
- Spending as a percent of GDP: 3.70%
2021: $ 806.23 billion
- Percent change in spending: 3.58% – #28 largest year over year increase
- Spending as a percent of GDP: 3.46%
2022: $ 876.94 billion
- Percent change in spending: 8.77% – #13 largest year over year increase
- Spending as a percent of GDP: 3.45%
Take Charge of Your Retirement In Just A Few Minutes (Sponsor)
Retirement planning doesn’t have to feel overwhelming. The key is finding expert guidance—and SmartAsset’s simple quiz makes it easier than ever for you to connect with a vetted financial advisor.
Here’s how it works:
- Answer a Few Simple Questions. Tell us a bit about your goals and preferences—it only takes a few minutes!
- Get Matched with Vetted Advisors Our smart tool matches you with up to three pre-screened, vetted advisors who serve your area and are held to a fiduciary standard to act in your best interests. Click here to begin
- Choose Your Fit Review their profiles, schedule an introductory call (or meet in person), and select the advisor who feel is right for you.
Why wait? Start building the retirement you’ve always dreamed of. Click here to get started today!
Thank you for reading! Have some feedback for us?
Contact the 24/7 Wall St. editorial team.
Latest from 24/7


Our expert who first called NVIDIA in 2009 is predicting 2025 will see a historic AI breakthrough.
You can follow him investing $500,000 of his own money on our top AI stocks for free.